FIN20014 Financial Management: Capital Budgeting Analysis Report
VerifiedAdded on 2023/06/14
|6
|1136
|433
Report
AI Summary
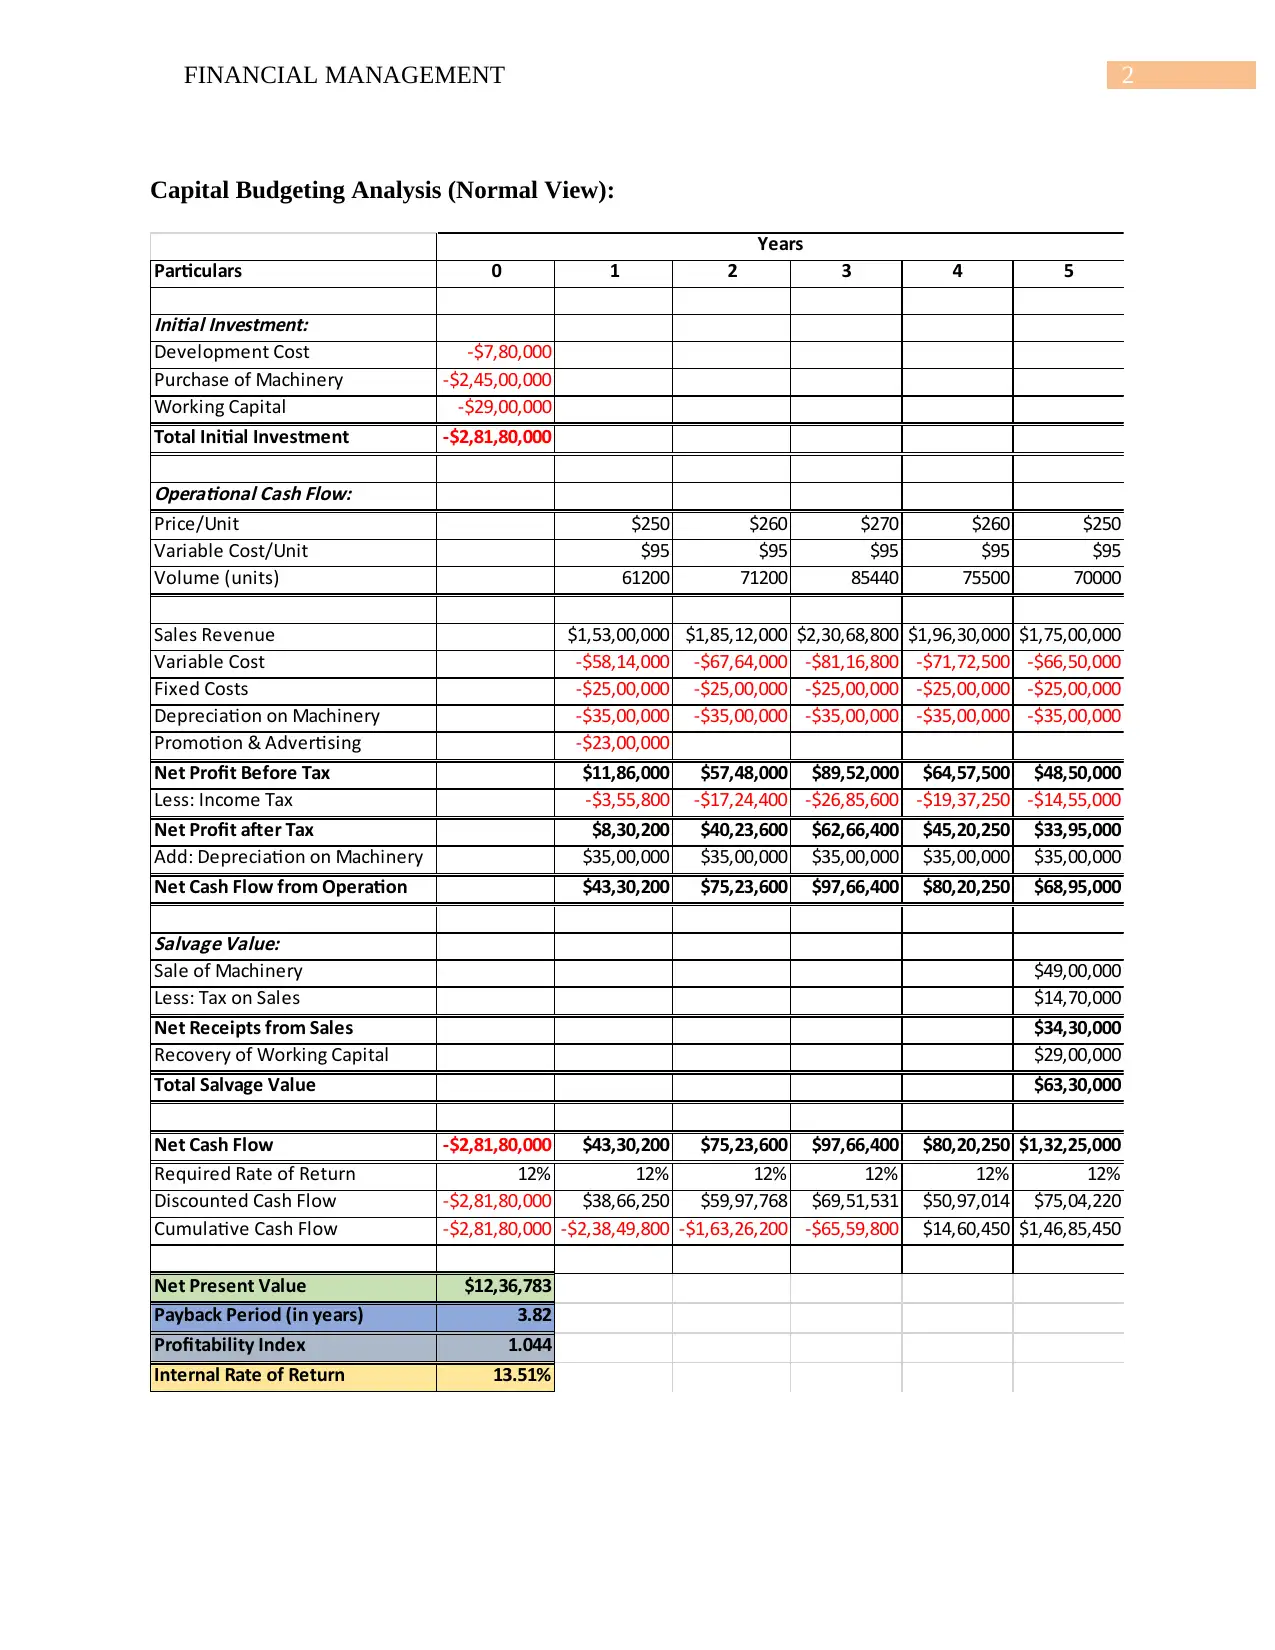
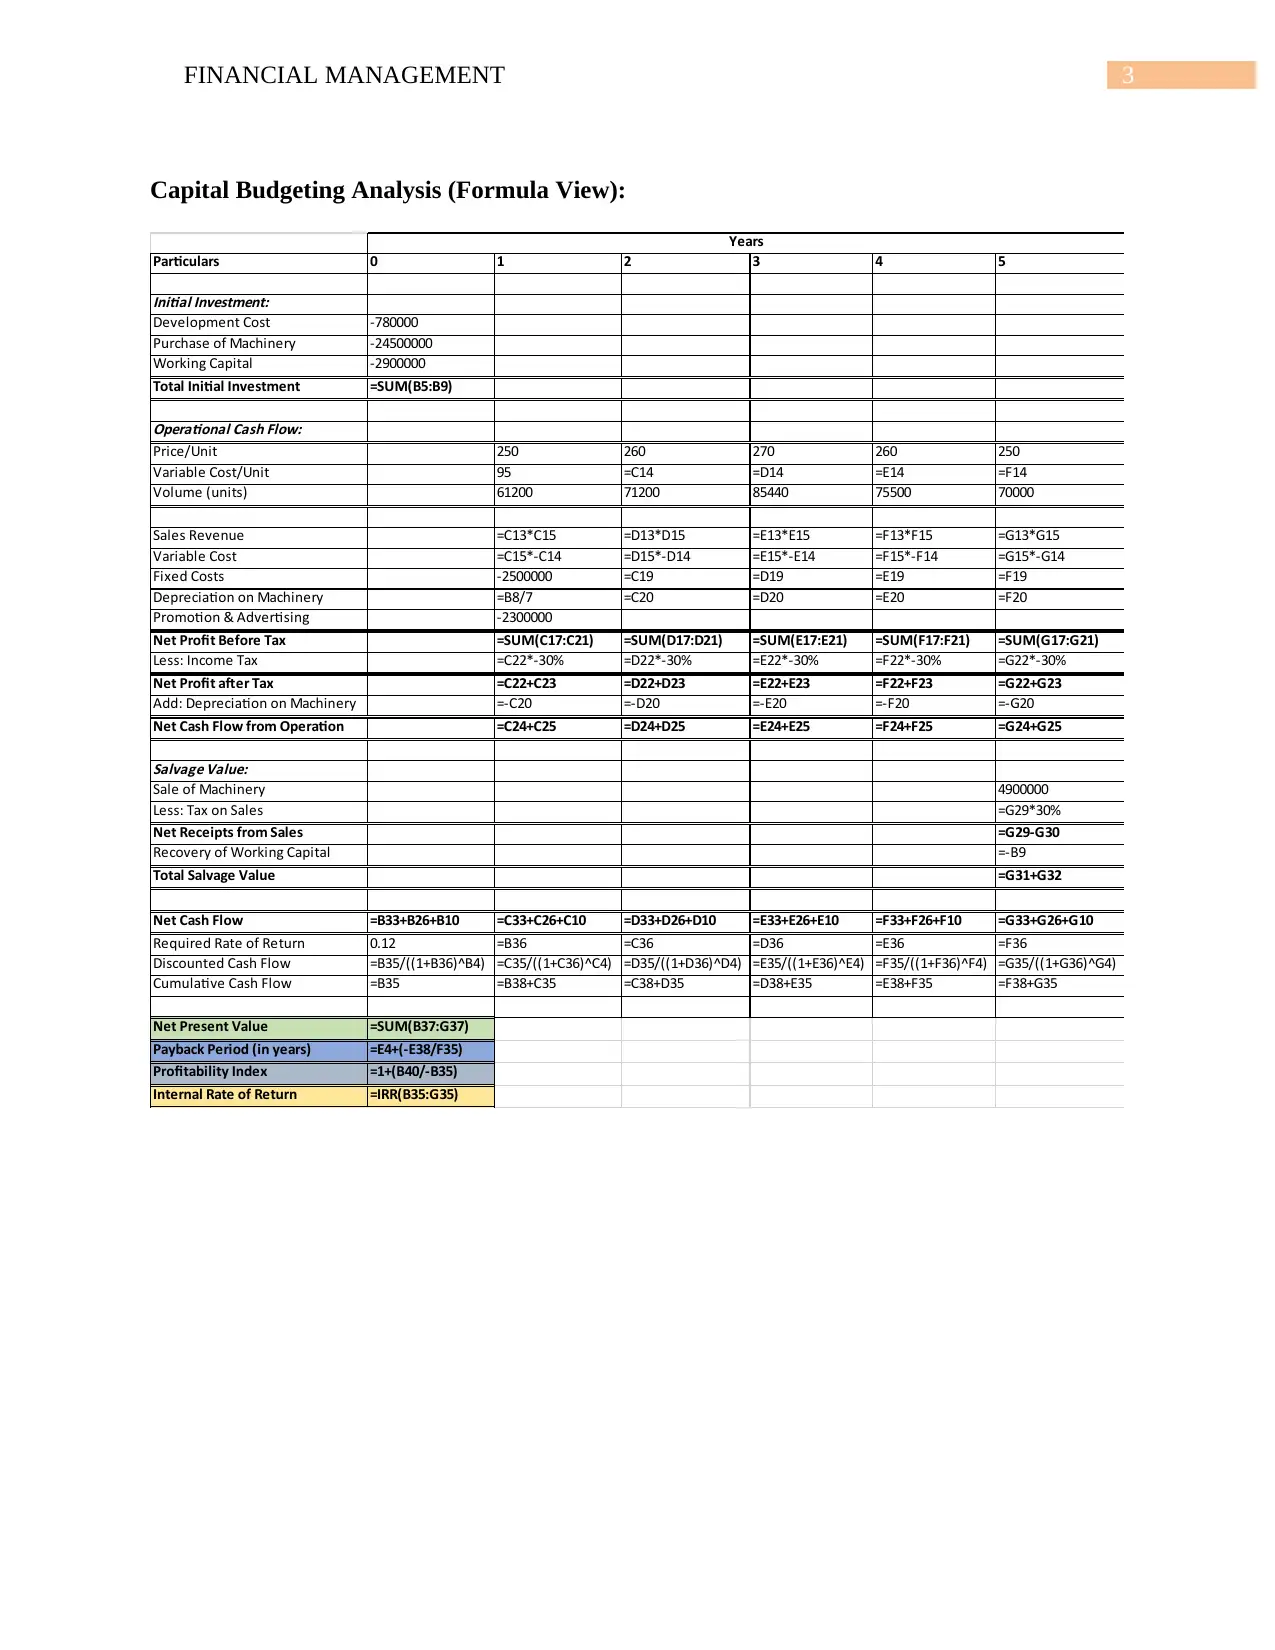
This report presents a capital budgeting analysis for a new PDA project, employing investment appraisal techniques such as net present value (NPV), payback period, profitability index, and internal rate of return (IRR). The project's feasibility is determined through an analysis of computed figures, with profitability assessed by calculating the difference between the present value of future cash flows and the initial investment. A positive NPV, as observed in this case ($1,236,783), suggests project acceptance due to the higher present value of future returns compared to the initial investment. The profitability index of 1.044 further supports acceptance, indicating a return exceeding the required rate. The IRR of 13.51%, surpassing the required rate of 12%, aligns with IRR criteria for project viability. With a payback period of 3.82 years, the project's initial investment is recovered in 3 years and 8 months, deemed acceptable due to the relatively short duration. Based on these analyses, the report concludes that the project should be accepted.

1 out of 6

Your All-in-One AI-Powered Toolkit for Academic Success.
+13062052269
info@desklib.com
Available 24*7 on WhatsApp / Email
![[object Object]](/_next/static/media/star-bottom.7253800d.svg)
Copyright © 2020–2026 A2Z Services. All Rights Reserved. Developed and managed by ZUCOL.