Financial Analysis & Investment Appraisal Report: Detailed Review
VerifiedAdded on 2024/06/04
|17
|4013
|351
Report
AI Summary
This report provides a detailed analysis of financial performance using ratio analysis, covering profitability, liquidity, gearing, asset utilization, and investor potential. It evaluates a company's performance based on calculated ratios for the years 2015 and 2016, highlighting strengths and areas needing improvement. The report also discusses the limitations of ratio analysis, such as inflationary effects and differences in accounting practices. Furthermore, it explores investment appraisal techniques, including payback period, discounted payback period, ARR, NPV, and IRR, detailing their benefits and limitations. The document concludes by considering possible sources of finance for investment projects. Desklib offers a range of similar solved assignments and study tools for students.

Financial Management & Control
1
1
Paraphrase This Document
Need a fresh take? Get an instant paraphrase of this document with our AI Paraphraser
Table of Contents
Part A..............................................................................................................................................3
Introduction................................................................................................................................3
1. Evaluation of performance of the company........................................................................3
Conclusion..................................................................................................................................6
2. Limitation of ratio analysis...................................................................................................7
Part B..............................................................................................................................................9
1. Investment appraisal technique............................................................................................9
2. Key benefits and limitations of each of the differing investment appraisal techniques 12
3. Possible sources of finance..................................................................................................14
References.....................................................................................................................................16
2
Part A
Introduction
The report consists of various ratios that are being calculated to determine the various aspect of
the company such as the profitability, liquidity, gearing, asset utilisation and investor potential
from the viewpoint of investors as well as the company so that the performance can be measured.
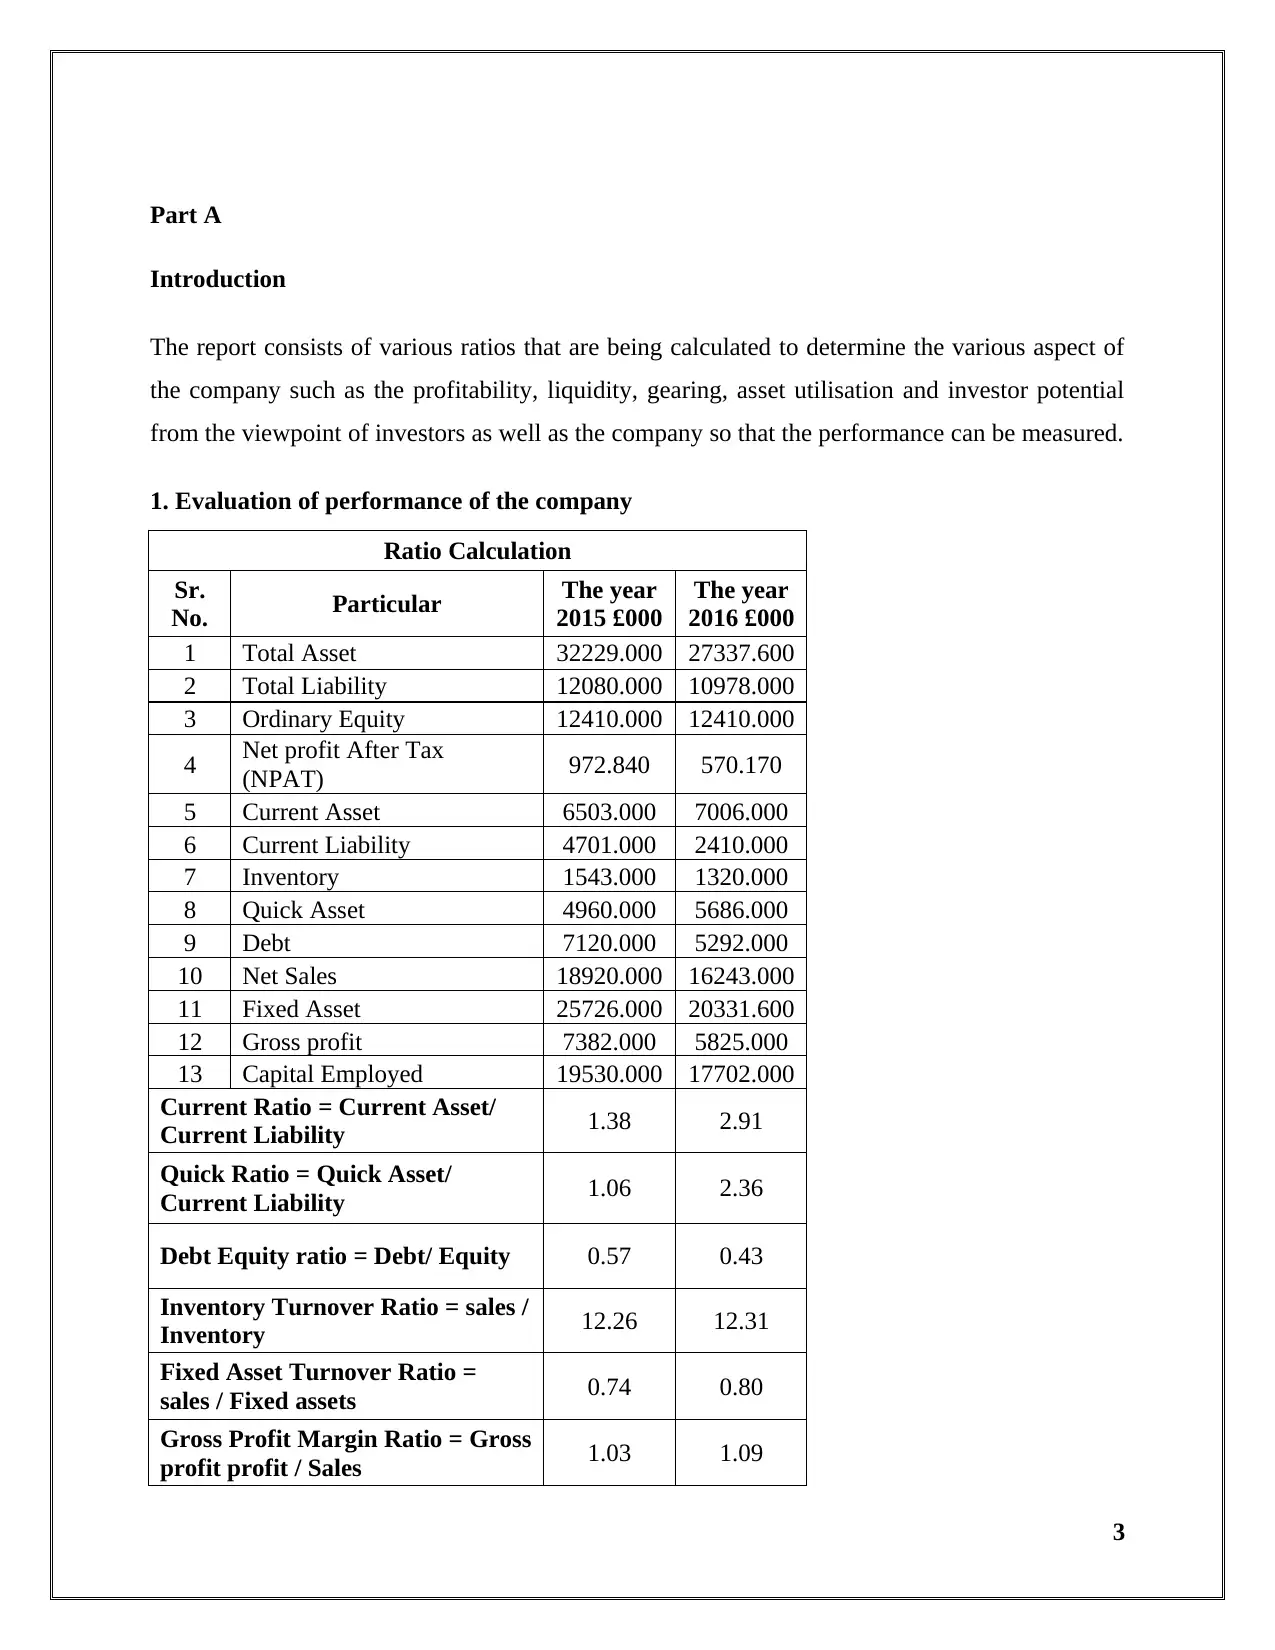
1. Evaluation of performance of the company
Ratio Calculation
Sr.
No. Particular The year
2015 £000
The year
2016 £000
1 Total Asset 32229.000 27337.600
2 Total Liability 12080.000 10978.000
3 Ordinary Equity 12410.000 12410.000
4 Net profit After Tax
(NPAT) 972.840 570.170
5 Current Asset 6503.000 7006.000
6 Current Liability 4701.000 2410.000
7 Inventory 1543.000 1320.000
8 Quick Asset 4960.000 5686.000
9 Debt 7120.000 5292.000
10 Net Sales 18920.000 16243.000
11 Fixed Asset 25726.000 20331.600
12 Gross profit 7382.000 5825.000
13 Capital Employed 19530.000 17702.000
Current Ratio = Current Asset/
Current Liability 1.38 2.91
Quick Ratio = Quick Asset/
Current Liability 1.06 2.36
Debt Equity ratio = Debt/ Equity 0.57 0.43
Inventory Turnover Ratio = sales /
Inventory 12.26 12.31
Fixed Asset Turnover Ratio =
sales / Fixed assets 0.74 0.80
Gross Profit Margin Ratio = Gross
profit profit / Sales 1.03 1.09
3
Introduction
The report consists of various ratios that are being calculated to determine the various aspect of
the company such as the profitability, liquidity, gearing, asset utilisation and investor potential
from the viewpoint of investors as well as the company so that the performance can be measured.
1. Evaluation of performance of the company
Ratio Calculation
Sr.
No. Particular The year
2015 £000
The year
2016 £000
1 Total Asset 32229.000 27337.600
2 Total Liability 12080.000 10978.000
3 Ordinary Equity 12410.000 12410.000
4 Net profit After Tax
(NPAT) 972.840 570.170
5 Current Asset 6503.000 7006.000
6 Current Liability 4701.000 2410.000
7 Inventory 1543.000 1320.000
8 Quick Asset 4960.000 5686.000
9 Debt 7120.000 5292.000
10 Net Sales 18920.000 16243.000
11 Fixed Asset 25726.000 20331.600
12 Gross profit 7382.000 5825.000
13 Capital Employed 19530.000 17702.000
Current Ratio = Current Asset/
Current Liability 1.38 2.91
Quick Ratio = Quick Asset/
Current Liability 1.06 2.36
Debt Equity ratio = Debt/ Equity 0.57 0.43
Inventory Turnover Ratio = sales /
Inventory 12.26 12.31
Fixed Asset Turnover Ratio =
sales / Fixed assets 0.74 0.80
Gross Profit Margin Ratio = Gross
profit profit / Sales 1.03 1.09
3
⊘ This is a preview!⊘
Do you want full access?
Subscribe today to unlock all pages.
Trusted by 1+ million students worldwide
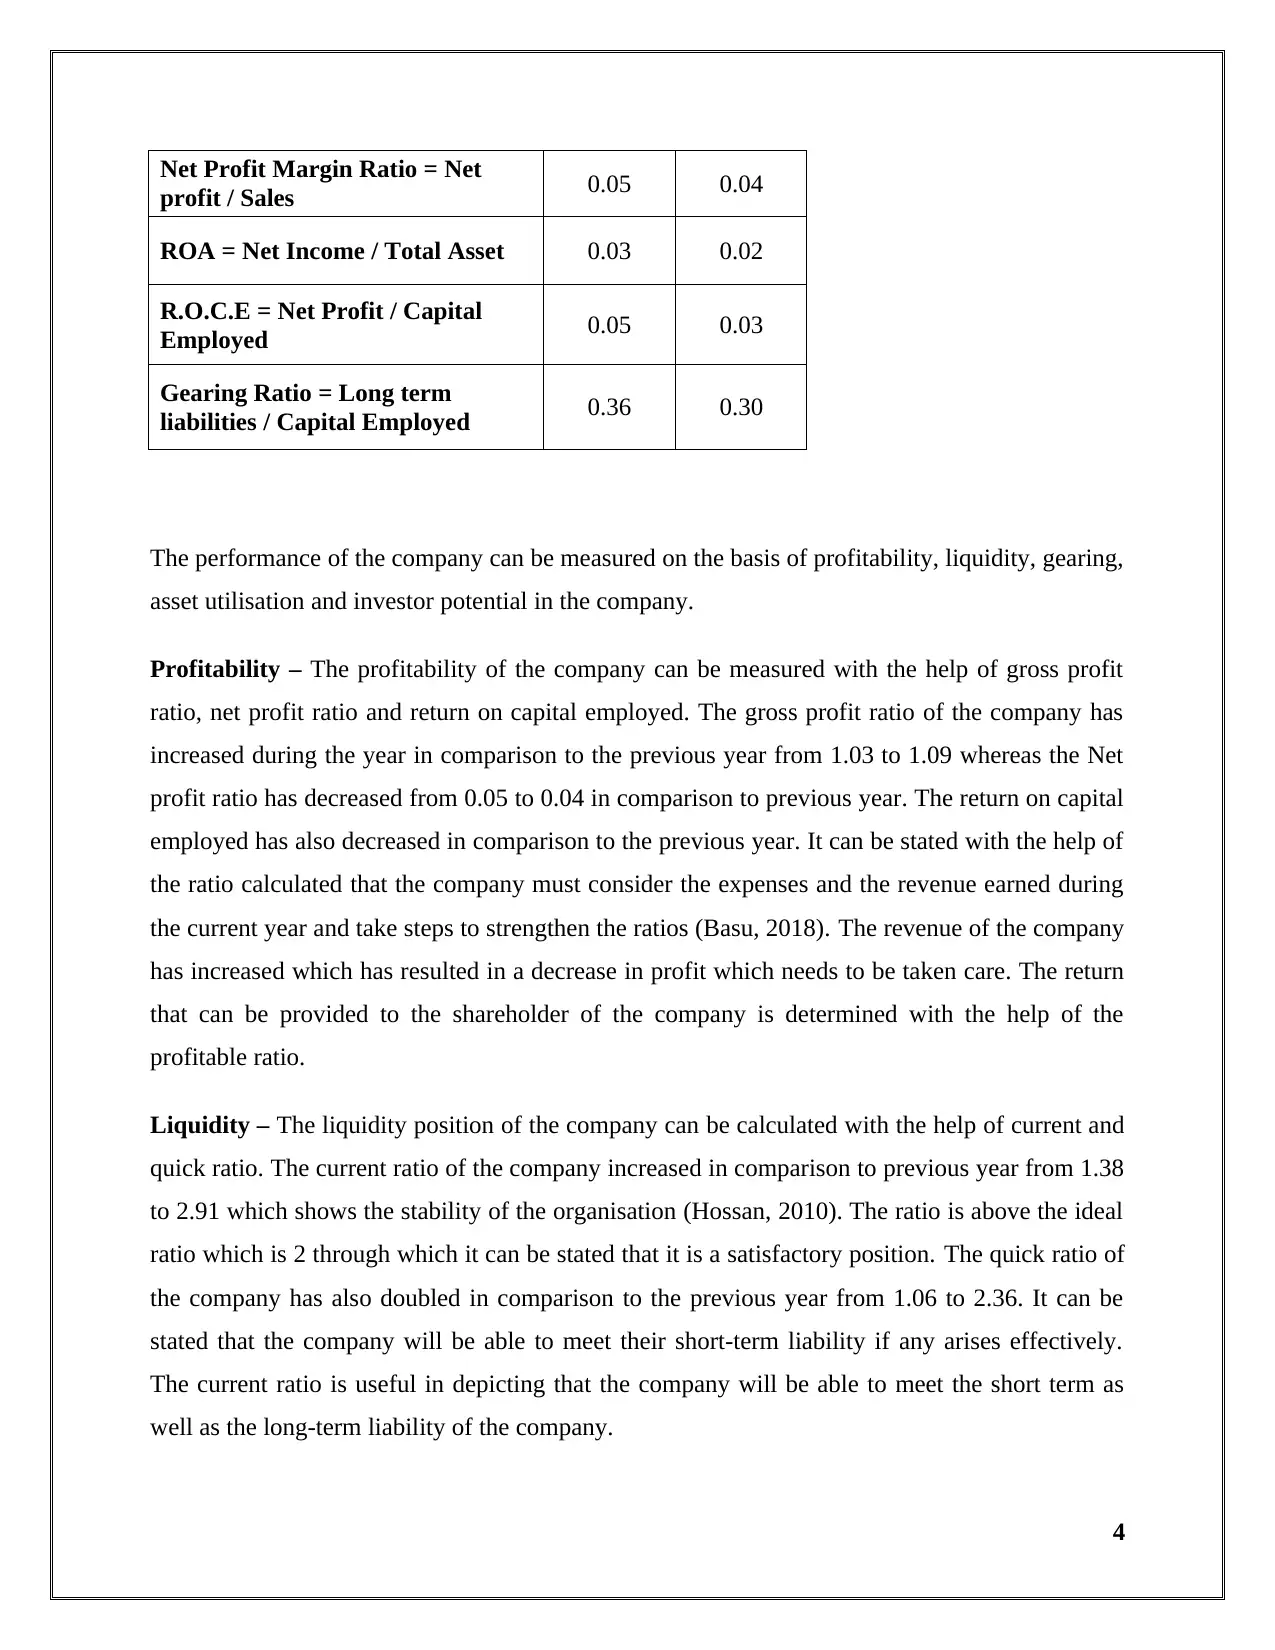
Net Profit Margin Ratio = Net
profit / Sales 0.05 0.04
ROA = Net Income / Total Asset 0.03 0.02
R.O.C.E = Net Profit / Capital
Employed 0.05 0.03
Gearing Ratio = Long term
liabilities / Capital Employed 0.36 0.30
The performance of the company can be measured on the basis of profitability, liquidity, gearing,
asset utilisation and investor potential in the company.
Profitability – The profitability of the company can be measured with the help of gross profit
ratio, net profit ratio and return on capital employed. The gross profit ratio of the company has
increased during the year in comparison to the previous year from 1.03 to 1.09 whereas the Net
profit ratio has decreased from 0.05 to 0.04 in comparison to previous year. The return on capital
employed has also decreased in comparison to the previous year. It can be stated with the help of
the ratio calculated that the company must consider the expenses and the revenue earned during
the current year and take steps to strengthen the ratios (Basu, 2018). The revenue of the company
has increased which has resulted in a decrease in profit which needs to be taken care. The return
that can be provided to the shareholder of the company is determined with the help of the
profitable ratio.
Liquidity – The liquidity position of the company can be calculated with the help of current and
quick ratio. The current ratio of the company increased in comparison to previous year from 1.38
to 2.91 which shows the stability of the organisation (Hossan, 2010). The ratio is above the ideal
ratio which is 2 through which it can be stated that it is a satisfactory position. The quick ratio of
the company has also doubled in comparison to the previous year from 1.06 to 2.36. It can be
stated that the company will be able to meet their short-term liability if any arises effectively.
The current ratio is useful in depicting that the company will be able to meet the short term as
well as the long-term liability of the company.
4
Paraphrase This Document
Need a fresh take? Get an instant paraphrase of this document with our AI Paraphraser
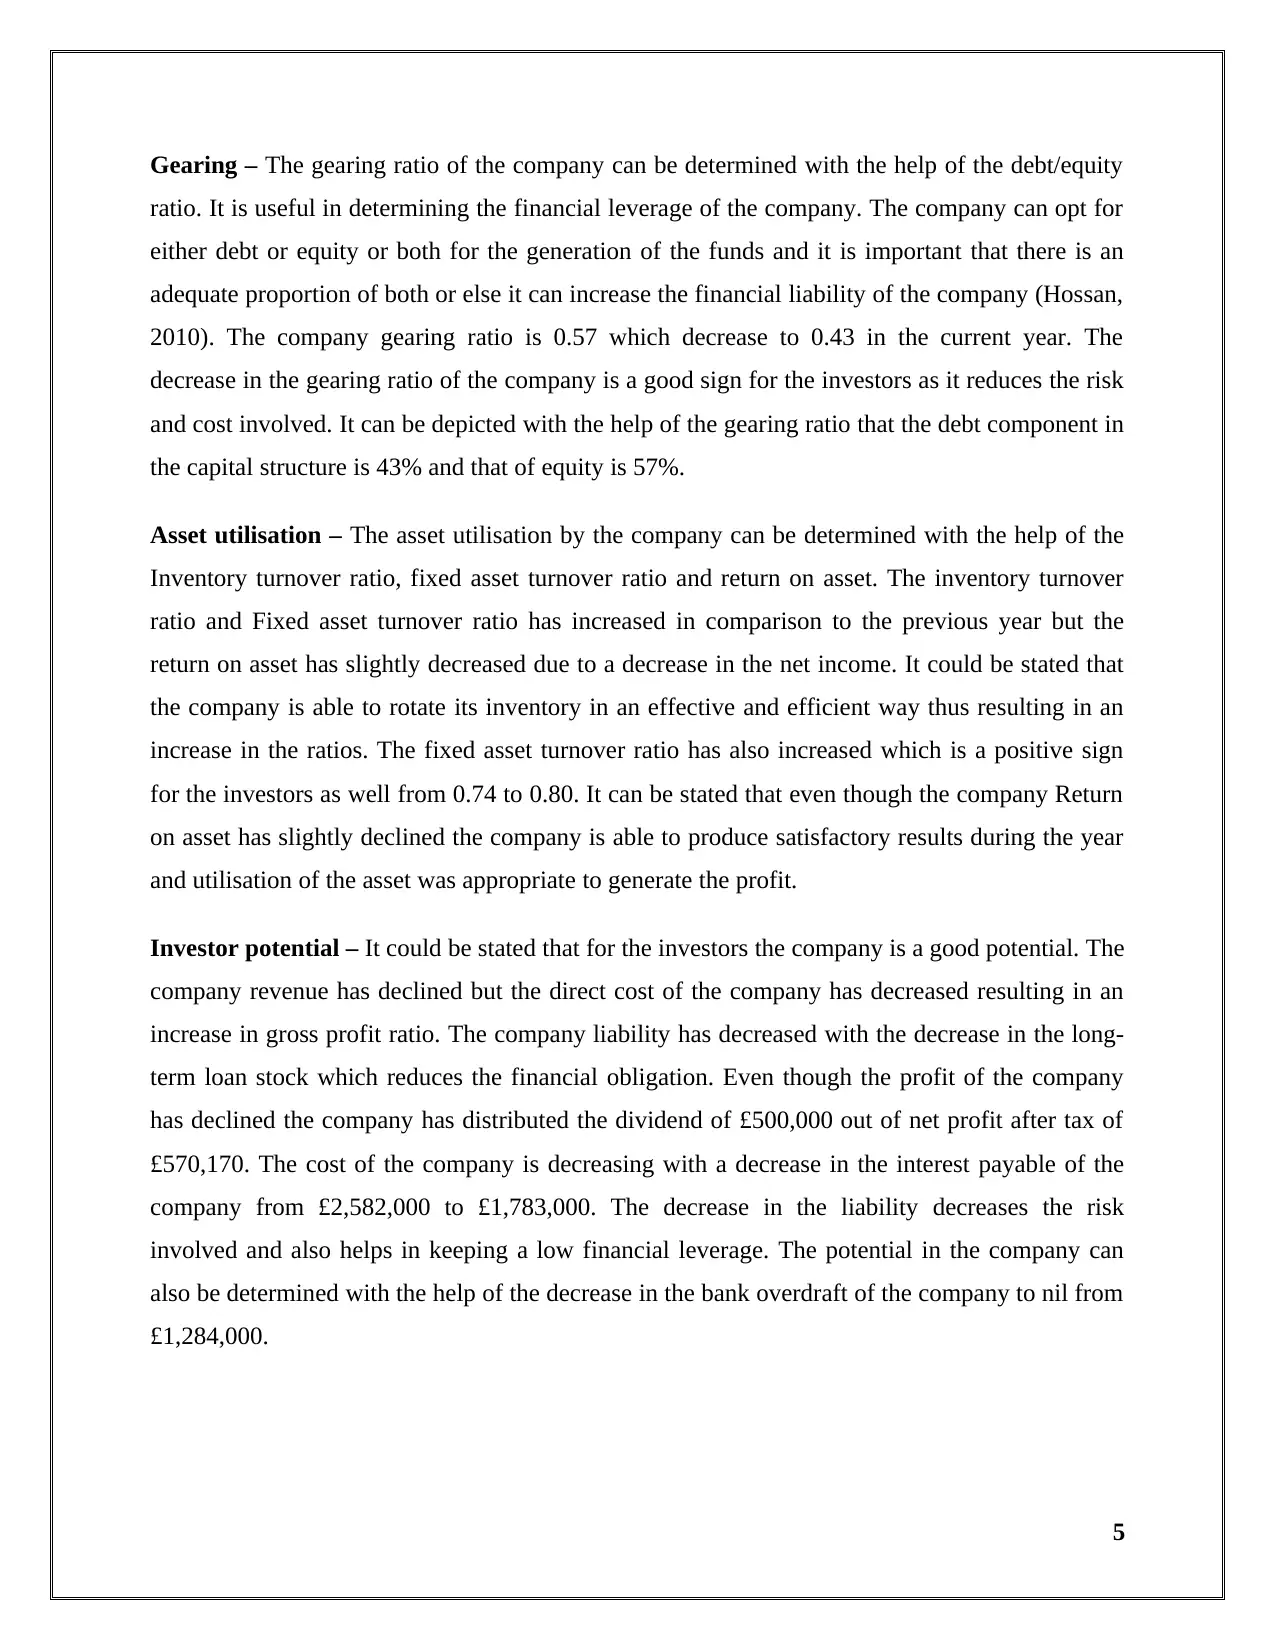
Gearing – The gearing ratio of the company can be determined with the help of the debt/equity
ratio. It is useful in determining the financial leverage of the company. The company can opt for
either debt or equity or both for the generation of the funds and it is important that there is an
adequate proportion of both or else it can increase the financial liability of the company (Hossan,
2010). The company gearing ratio is 0.57 which decrease to 0.43 in the current year. The
decrease in the gearing ratio of the company is a good sign for the investors as it reduces the risk
and cost involved. It can be depicted with the help of the gearing ratio that the debt component in
the capital structure is 43% and that of equity is 57%.
Asset utilisation – The asset utilisation by the company can be determined with the help of the
Inventory turnover ratio, fixed asset turnover ratio and return on asset. The inventory turnover
ratio and Fixed asset turnover ratio has increased in comparison to the previous year but the
return on asset has slightly decreased due to a decrease in the net income. It could be stated that
the company is able to rotate its inventory in an effective and efficient way thus resulting in an
increase in the ratios. The fixed asset turnover ratio has also increased which is a positive sign
for the investors as well from 0.74 to 0.80. It can be stated that even though the company Return
on asset has slightly declined the company is able to produce satisfactory results during the year
and utilisation of the asset was appropriate to generate the profit.
Investor potential – It could be stated that for the investors the company is a good potential. The
company revenue has declined but the direct cost of the company has decreased resulting in an
increase in gross profit ratio. The company liability has decreased with the decrease in the long-
term loan stock which reduces the financial obligation. Even though the profit of the company
has declined the company has distributed the dividend of £500,000 out of net profit after tax of
£570,170. The cost of the company is decreasing with a decrease in the interest payable of the
company from £2,582,000 to £1,783,000. The decrease in the liability decreases the risk
involved and also helps in keeping a low financial leverage. The potential in the company can
also be determined with the help of the decrease in the bank overdraft of the company to nil from
£1,284,000.
5

Conclusion
It can be concluded with the help of the report that the company is having a strong financial
position but there are some key areas which need to be focused for the long-term growth and
sustainability such as the revenue of the company which affects the profitability of the company.
It could also be seen that even after the company profit was not much in comparison to the
previous year the dividend was distributed which a positive sign is for the investors of the
company.
6
⊘ This is a preview!⊘
Do you want full access?
Subscribe today to unlock all pages.
Trusted by 1+ million students worldwide
2. Limitation of ratio analysis
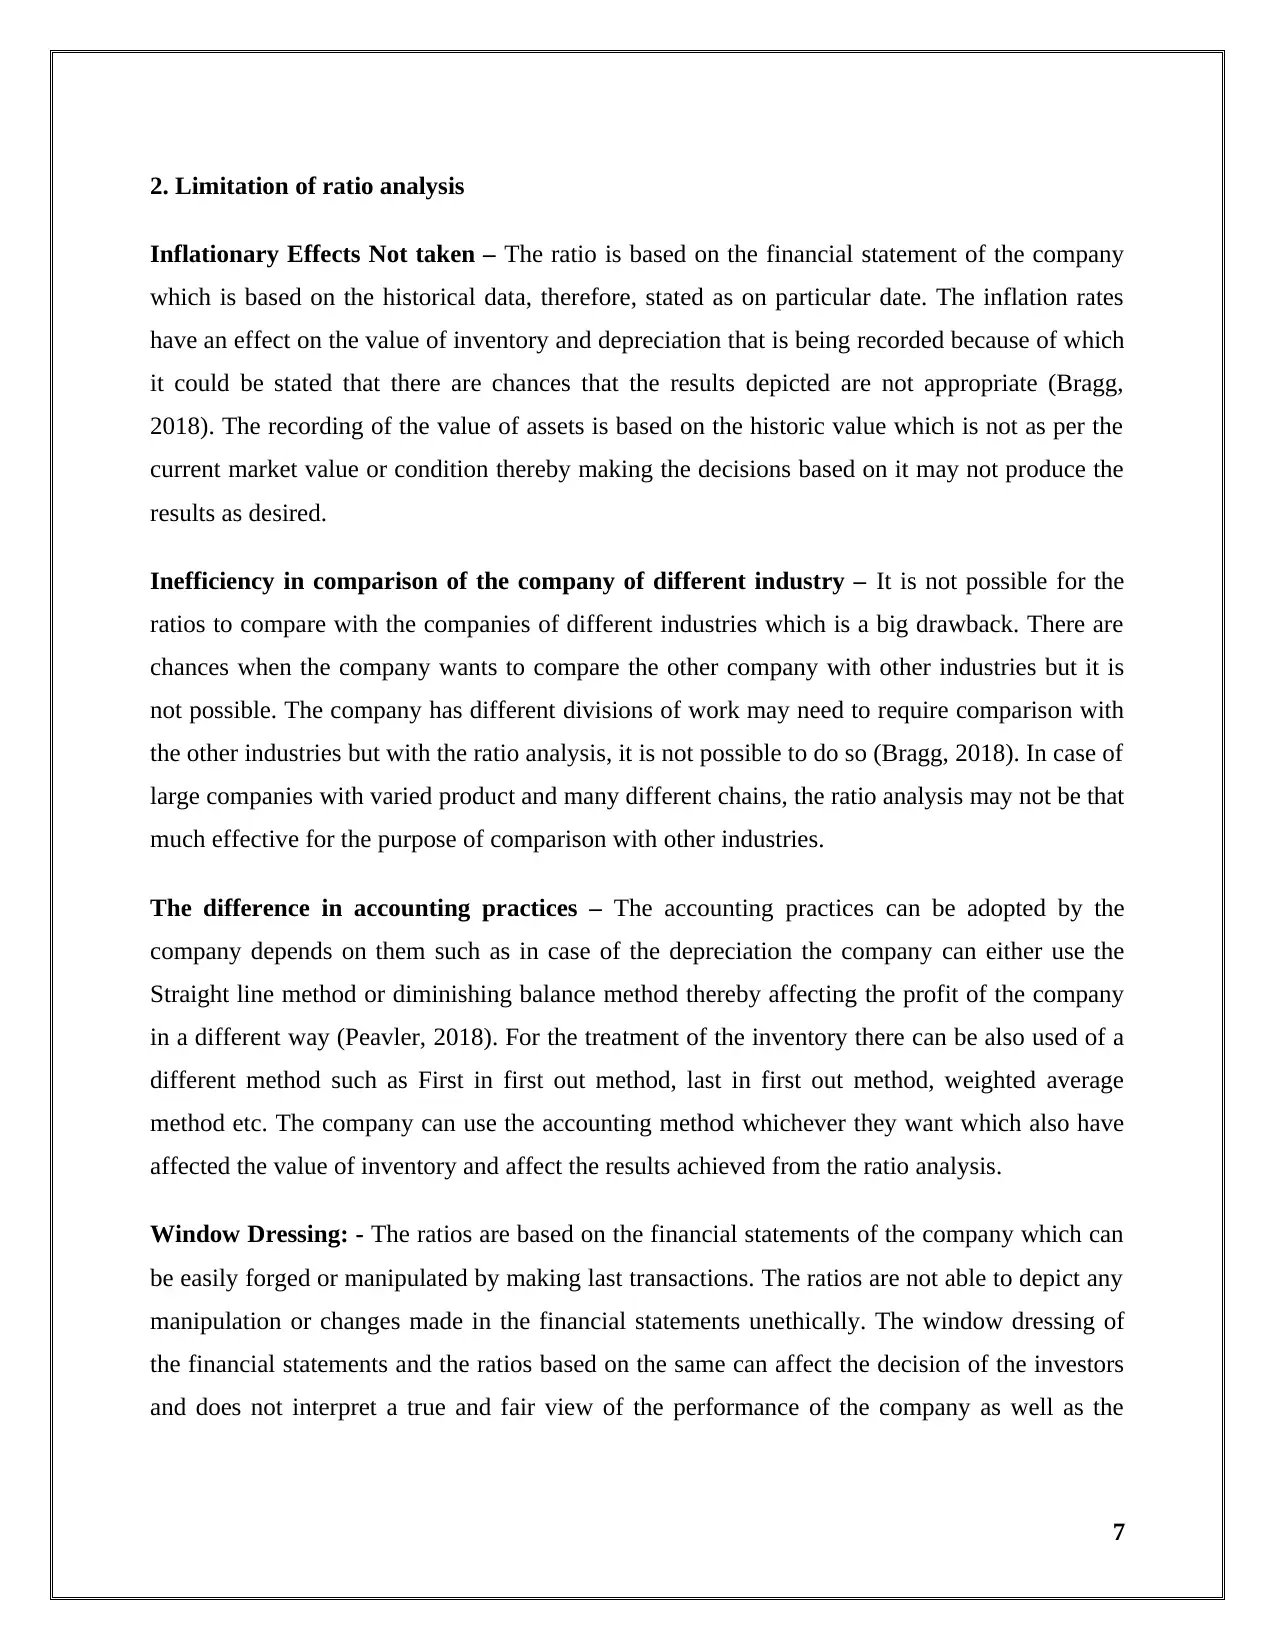
Inflationary Effects Not taken – The ratio is based on the financial statement of the company
which is based on the historical data, therefore, stated as on particular date. The inflation rates
have an effect on the value of inventory and depreciation that is being recorded because of which
it could be stated that there are chances that the results depicted are not appropriate (Bragg,
2018). The recording of the value of assets is based on the historic value which is not as per the
current market value or condition thereby making the decisions based on it may not produce the
results as desired.
Inefficiency in comparison of the company of different industry – It is not possible for the
ratios to compare with the companies of different industries which is a big drawback. There are
chances when the company wants to compare the other company with other industries but it is
not possible. The company has different divisions of work may need to require comparison with
the other industries but with the ratio analysis, it is not possible to do so (Bragg, 2018). In case of
large companies with varied product and many different chains, the ratio analysis may not be that
much effective for the purpose of comparison with other industries.
The difference in accounting practices – The accounting practices can be adopted by the
company depends on them such as in case of the depreciation the company can either use the
Straight line method or diminishing balance method thereby affecting the profit of the company
in a different way (Peavler, 2018). For the treatment of the inventory there can be also used of a
different method such as First in first out method, last in first out method, weighted average
method etc. The company can use the accounting method whichever they want which also have
affected the value of inventory and affect the results achieved from the ratio analysis.
Window Dressing: - The ratios are based on the financial statements of the company which can
be easily forged or manipulated by making last transactions. The ratios are not able to depict any
manipulation or changes made in the financial statements unethically. The window dressing of
the financial statements and the ratios based on the same can affect the decision of the investors
and does not interpret a true and fair view of the performance of the company as well as the
7
Paraphrase This Document
Need a fresh take? Get an instant paraphrase of this document with our AI Paraphraser
growth (Peavler, 2018). The delay in the payments may show high cash and cash equivalent
balances which may show the liquidity position of the company strong.
Qualitative aspect cannot be measured: - The ratio analysis is quantitative approach through
which there can be a measurement of the financial statement to determine the various aspects
such as the profitability; liquidity etc. but there is no measure to determine the qualitative aspect.
The ratio analysis is not an effective measure to determine the reason for any unfavorable
position or what steps can be taken to correct the same (Peavler, 2018). There can be various
other reasons which may not be quantitative in nature such as the strategy implemented, quality
or customer satisfaction etc. which may have affected the ratios but it is not identifiable with the
ratio analysis.
8
Part B
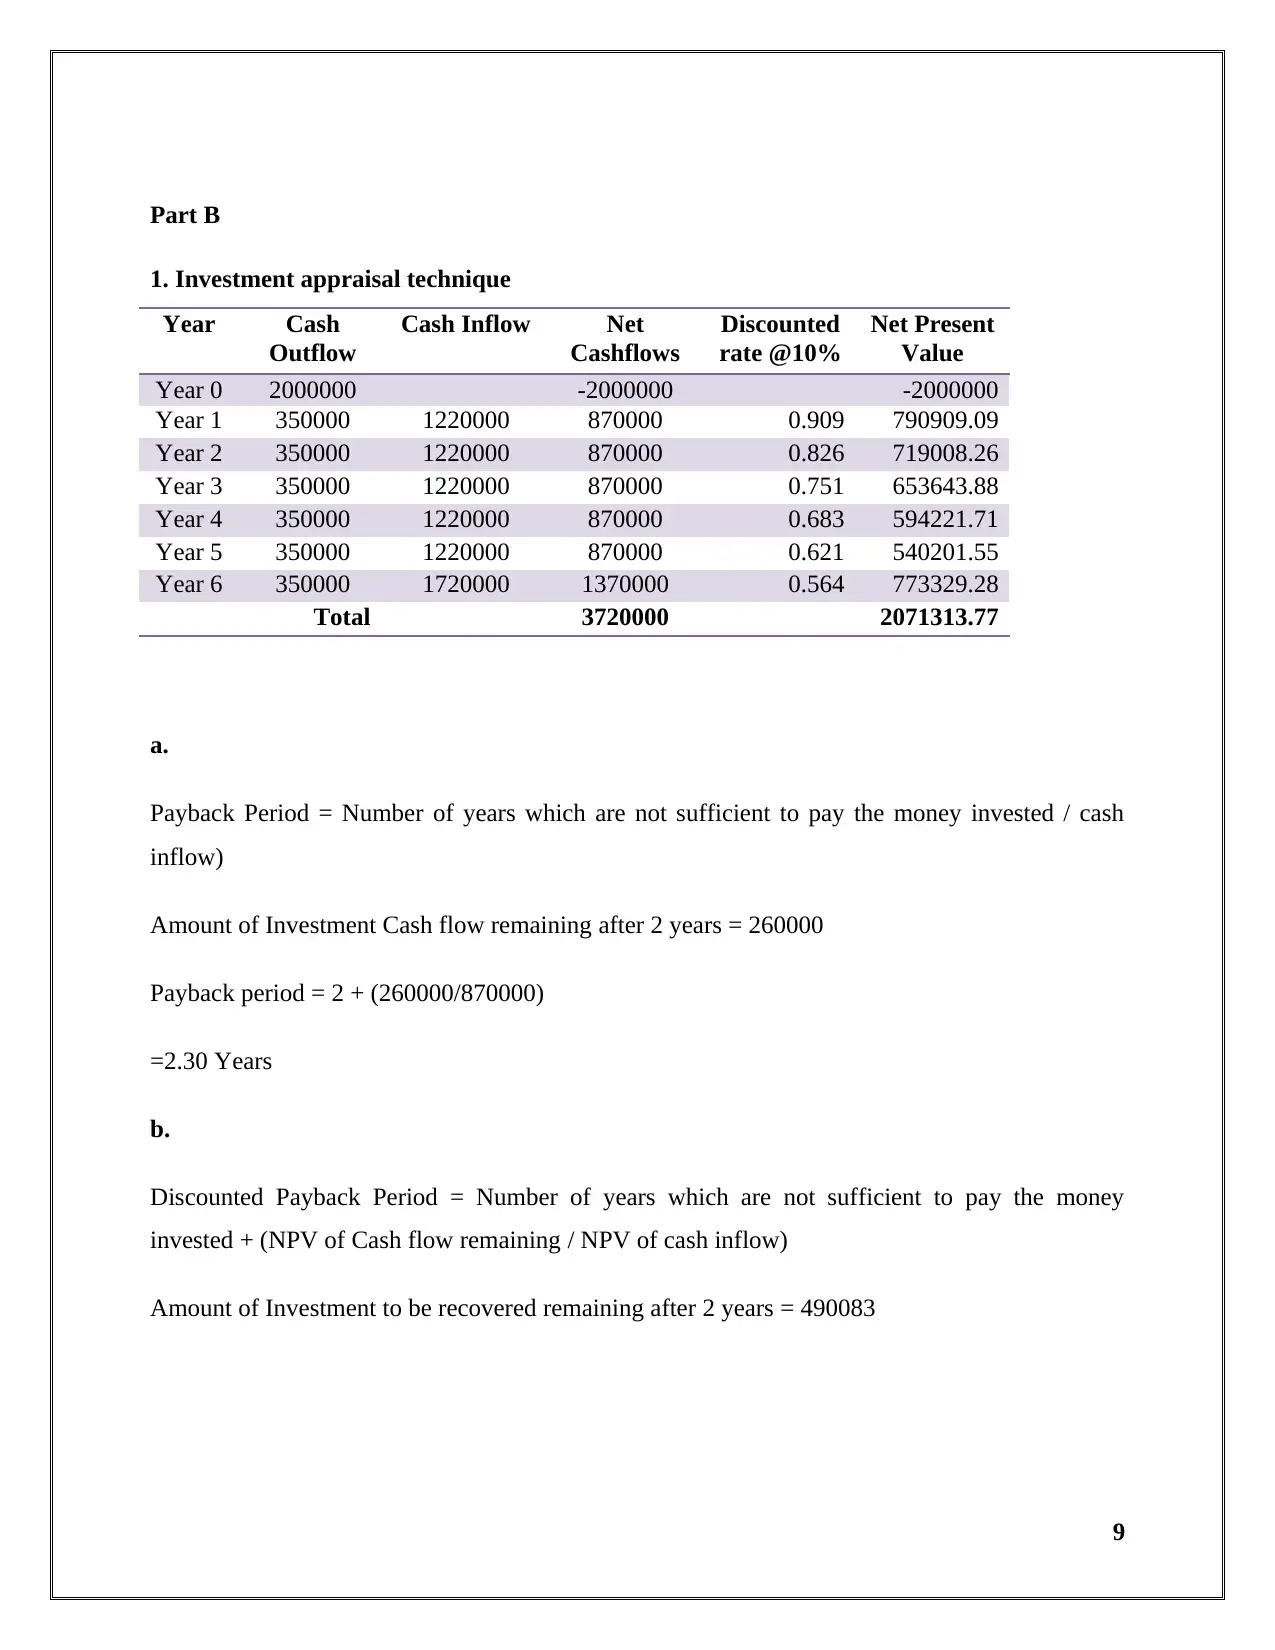
1. Investment appraisal technique
Year Cash
Outflow
Cash Inflow Net
Cashflows
Discounted
rate @10%
Net Present
Value
Year 0 2000000 -2000000 -2000000
Year 1 350000 1220000 870000 0.909 790909.09
Year 2 350000 1220000 870000 0.826 719008.26
Year 3 350000 1220000 870000 0.751 653643.88
Year 4 350000 1220000 870000 0.683 594221.71
Year 5 350000 1220000 870000 0.621 540201.55
Year 6 350000 1720000 1370000 0.564 773329.28
Total 3720000 2071313.77
a.
Payback Period = Number of years which are not sufficient to pay the money invested / cash
inflow)
Amount of Investment Cash flow remaining after 2 years = 260000
Payback period = 2 + (260000/870000)
=2.30 Years
b.
Discounted Payback Period = Number of years which are not sufficient to pay the money
invested + (NPV of Cash flow remaining / NPV of cash inflow)
Amount of Investment to be recovered remaining after 2 years = 490083
9
⊘ This is a preview!⊘
Do you want full access?
Subscribe today to unlock all pages.
Trusted by 1+ million students worldwide
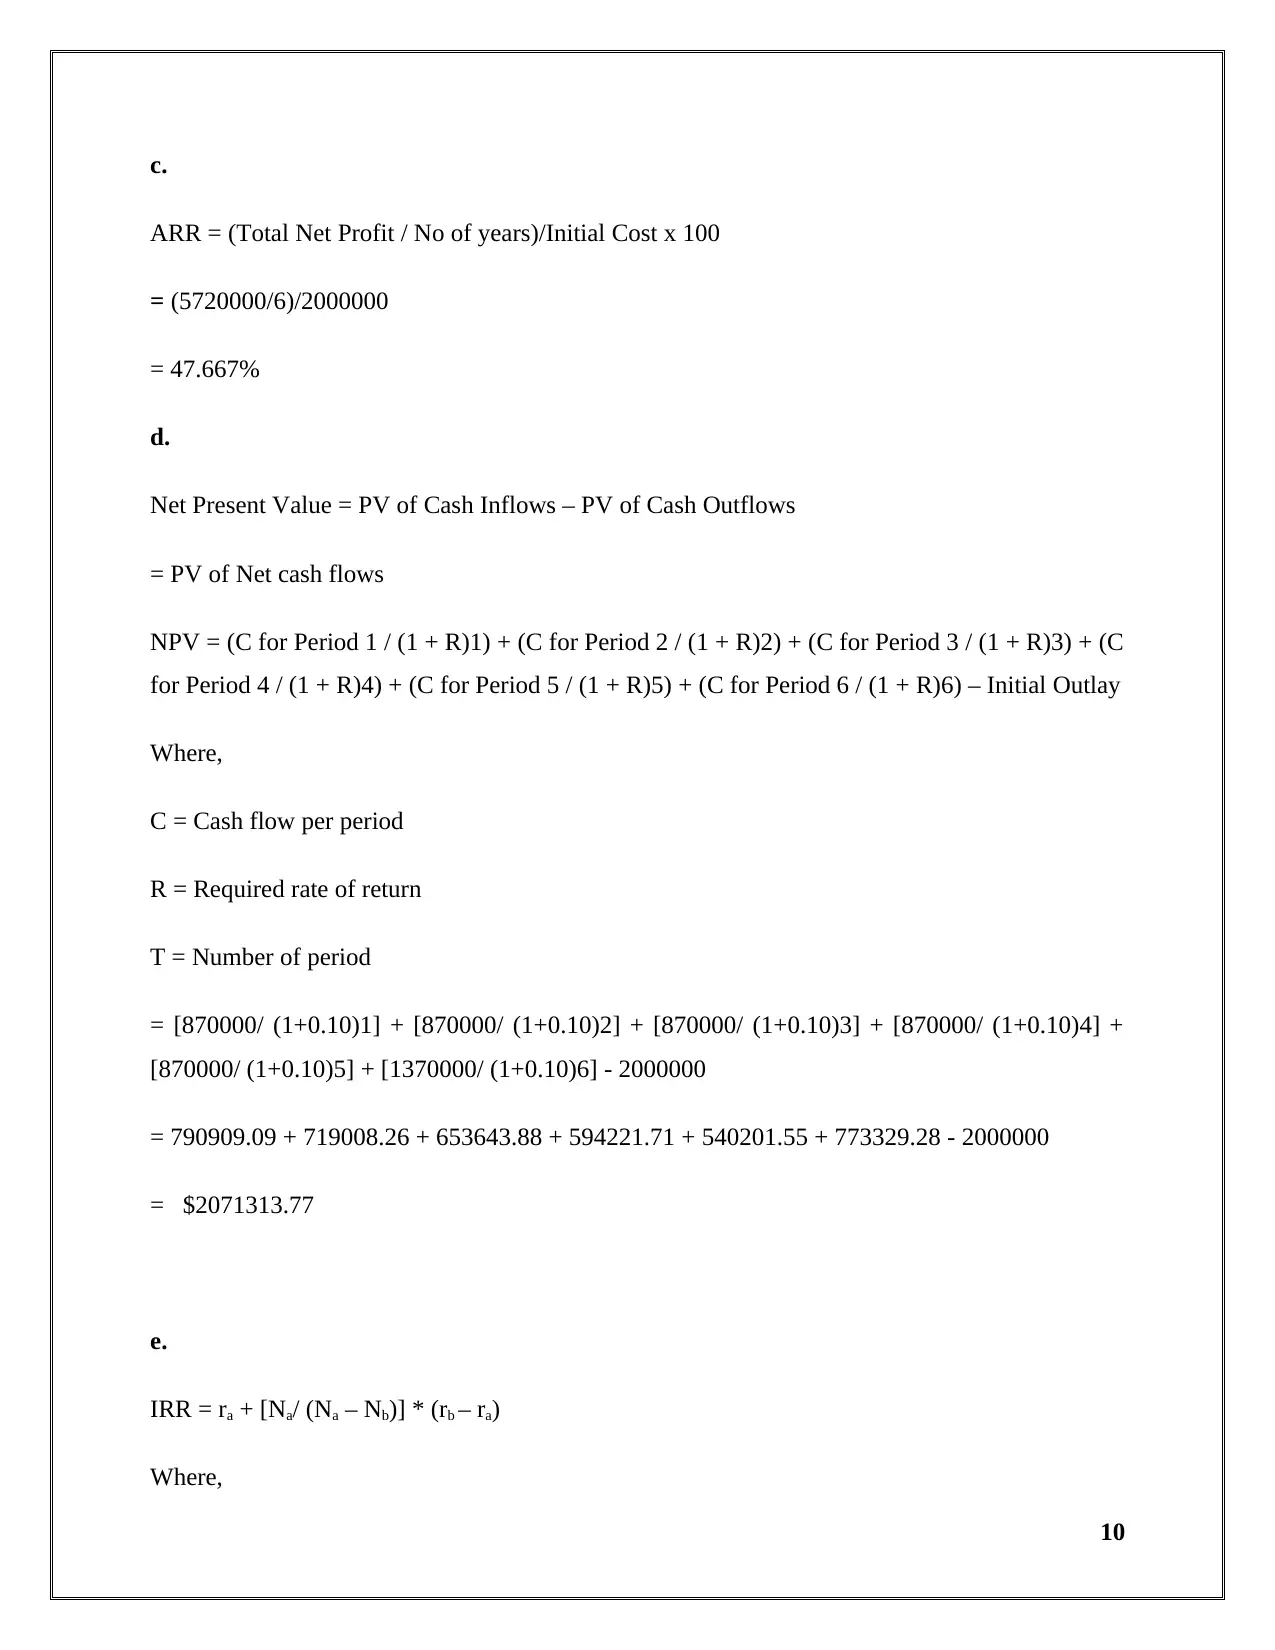
c.
ARR = (Total Net Profit / No of years)/Initial Cost x 100
= (5720000/6)/2000000
= 47.667%
d.
Net Present Value = PV of Cash Inflows – PV of Cash Outflows
= PV of Net cash flows
NPV = (C for Period 1 / (1 + R)1) + (C for Period 2 / (1 + R)2) + (C for Period 3 / (1 + R)3) + (C
for Period 4 / (1 + R)4) + (C for Period 5 / (1 + R)5) + (C for Period 6 / (1 + R)6) – Initial Outlay
Where,
C = Cash flow per period
R = Required rate of return
T = Number of period
= [870000/ (1+0.10)1] + [870000/ (1+0.10)2] + [870000/ (1+0.10)3] + [870000/ (1+0.10)4] +
[870000/ (1+0.10)5] + [1370000/ (1+0.10)6] - 2000000
= 790909.09 + 719008.26 + 653643.88 + 594221.71 + 540201.55 + 773329.28 - 2000000
= $2071313.77
e.
IRR = ra + [Na/ (Na – Nb)] * (rb – ra)
Where,
10
Paraphrase This Document
Need a fresh take? Get an instant paraphrase of this document with our AI Paraphraser
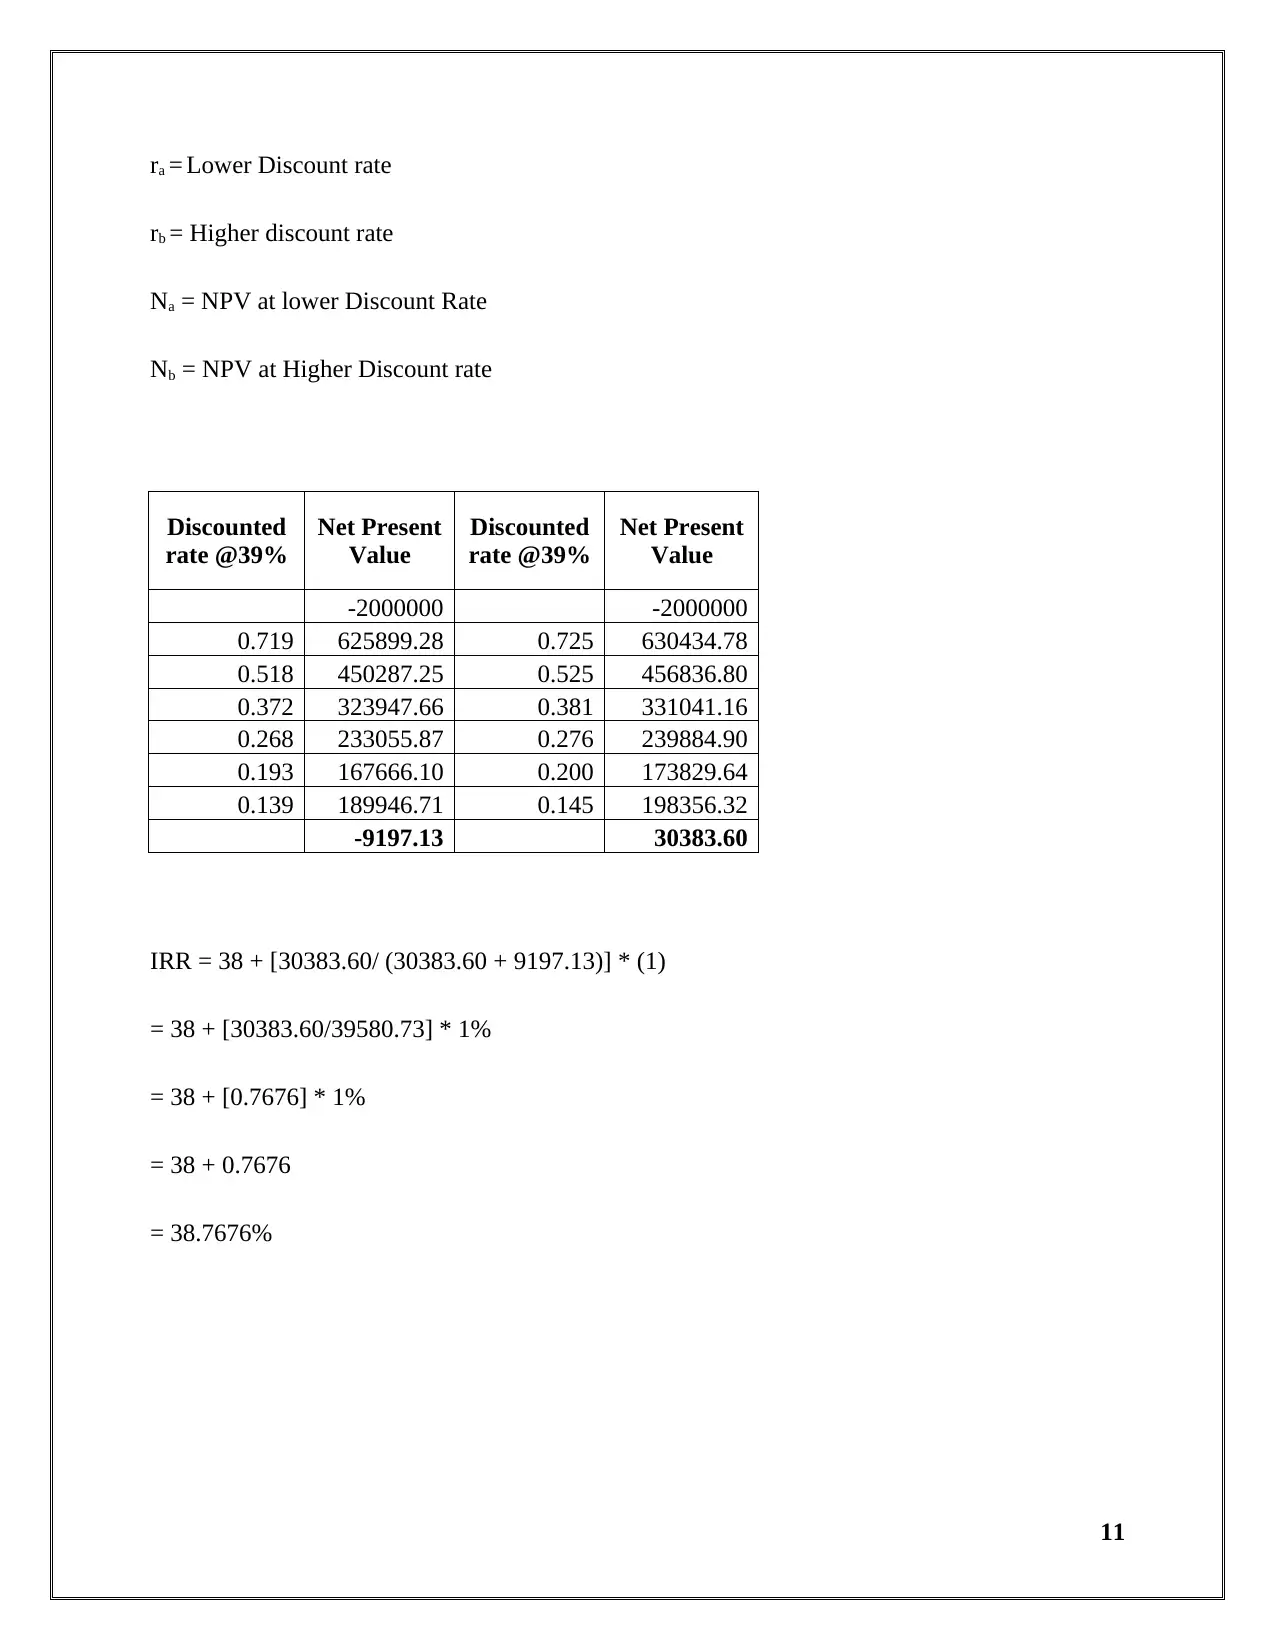
ra = Lower Discount rate
rb = Higher discount rate
Na = NPV at lower Discount Rate
Nb = NPV at Higher Discount rate
Discounted
rate @39%
Net Present
Value
Discounted
rate @39%
Net Present
Value
-2000000 -2000000
0.719 625899.28 0.725 630434.78
0.518 450287.25 0.525 456836.80
0.372 323947.66 0.381 331041.16
0.268 233055.87 0.276 239884.90
0.193 167666.10 0.200 173829.64
0.139 189946.71 0.145 198356.32
-9197.13 30383.60
IRR = 38 + [30383.60/ (30383.60 + 9197.13)] * (1)
= 38 + [30383.60/39580.73] * 1%
= 38 + [0.7676] * 1%
= 38 + 0.7676
= 38.7676%
11
2. Key benefits and limitations of each of the differing investment appraisal techniques
a) Payback Period – The Number of years that are required in order to cover the initial
investment that was incurred is known as the Payback period. There are many advantages and
disadvantages of the method such as the ignorance of time value of money etc. which are as
follows:-
Advantages – The payback period is simple and easy to apply. It does not require any technical
expertise and experience to determine the same. It is less time consuming when there are several
projects available to be chosen.
Disadvantages – The biggest disadvantage of using the Payback period method is that it ignores
the time value of money which may also result in the inefficient decision making if the payback
period of different projects is same.
b) Discounted Payback Period – The project evaluation is based on the discounted technique of
the cash flows for the purpose of valuation of the project on the basis of time taken to recover the
cost invested.
Advantages – There can be a measurement of the risk involved and the liquidity of the project
through analysis of the payback period time as shorter the payback period better it is as it has
greater liquidity and the risk involved with the cash flows to be generated is low (Woodruff,
2018).
Disadvantages – The cash flows after the payback period are also ignored by the method but
there can be instances that the cash flow after payback period is more profitable in the project in
which initial cash was not much resulting in the inefficient decision (Woodruff, 2018).
c) Accounting Rate of Return – The accounting rate of return is used for the determination of
the projected return that could be earned with respect to the percentage of investment after the
treatment of the depreciation in the cash flow (Money Matters, 2018).
Advantages – The average rate of return is useful in quick decisions about the effectiveness of
the project is undertaken as it is easy to use. There can be an easy comparison of the various
12
⊘ This is a preview!⊘
Do you want full access?
Subscribe today to unlock all pages.
Trusted by 1+ million students worldwide
1 out of 17
Related Documents


Your All-in-One AI-Powered Toolkit for Academic Success.
+13062052269
info@desklib.com
Available 24*7 on WhatsApp / Email
![[object Object]](/_next/static/media/star-bottom.7253800d.svg)
Unlock your academic potential
Copyright © 2020–2026 A2Z Services. All Rights Reserved. Developed and managed by ZUCOL.