MBA7011: Financial Management and Decision Making - Regent College
VerifiedAdded on 2023/06/18
|7
|1312
|367
Report
AI Summary
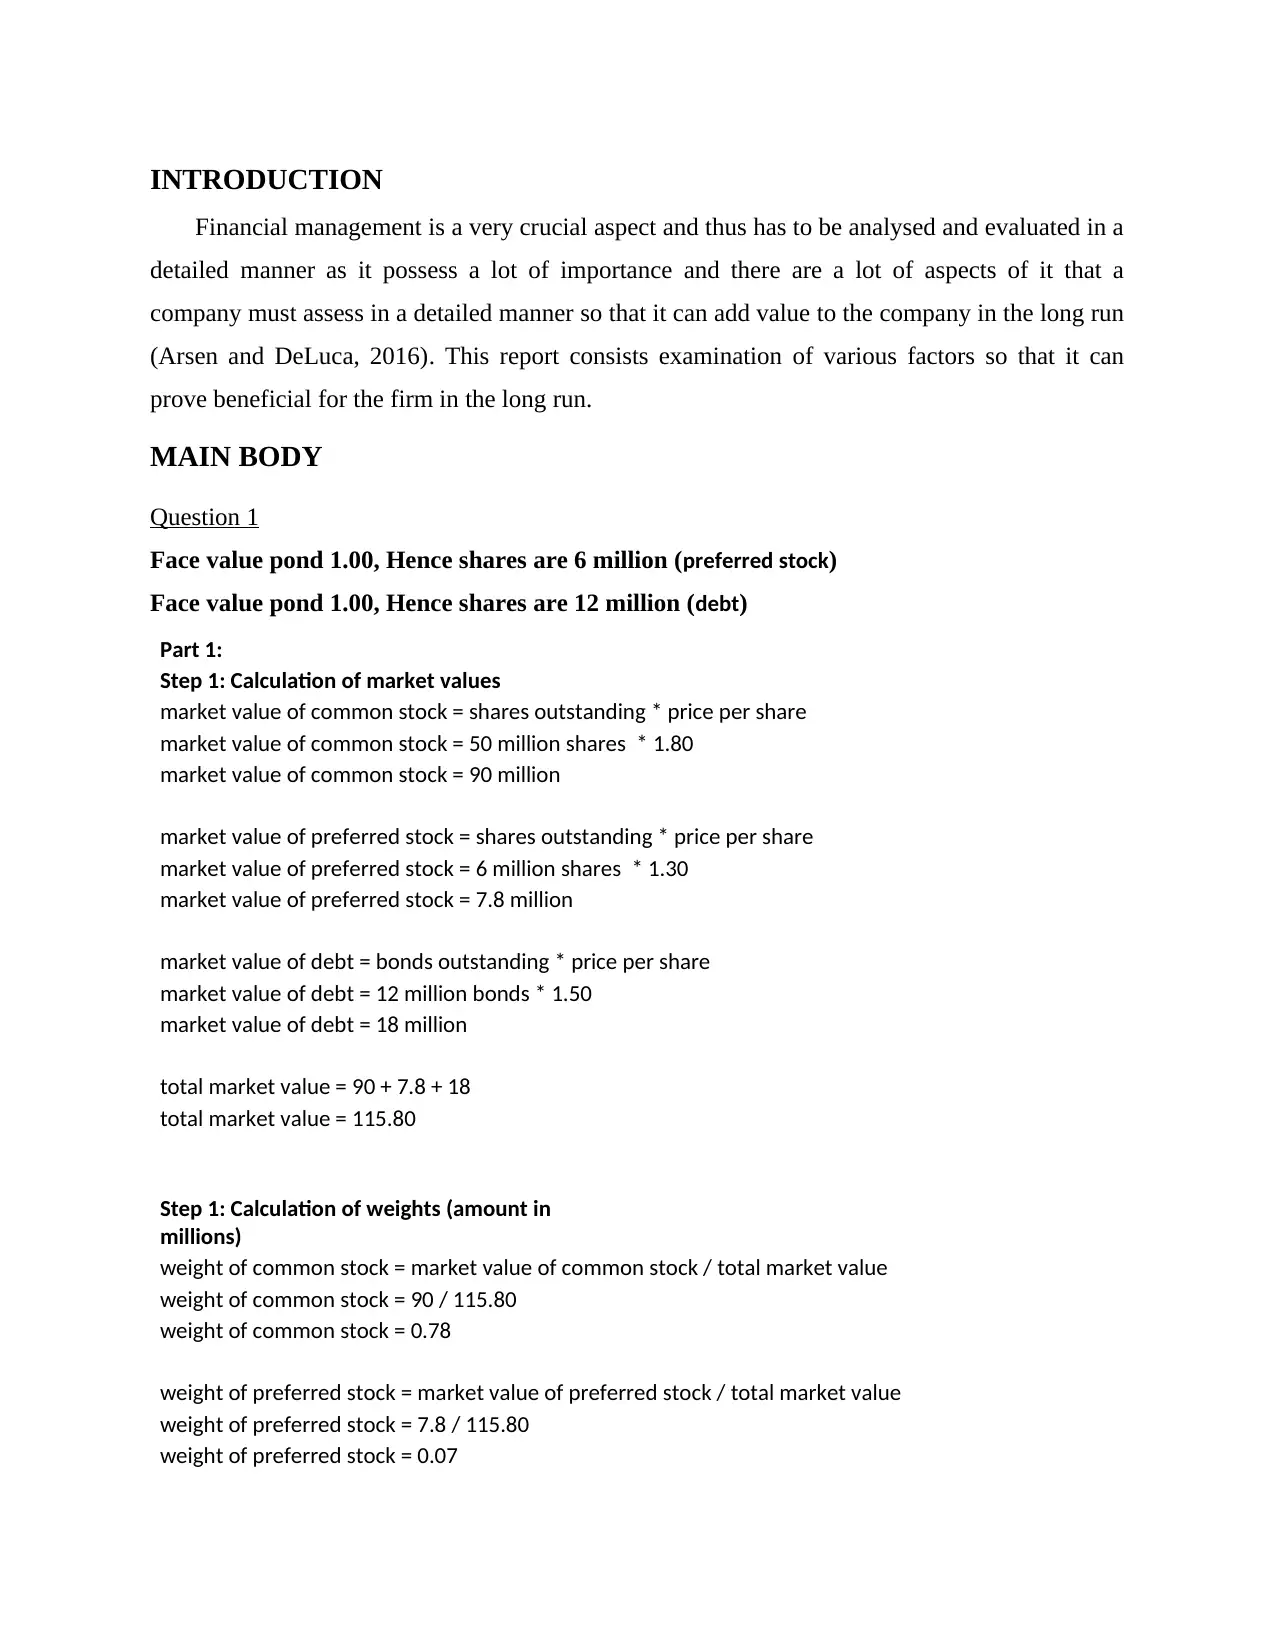
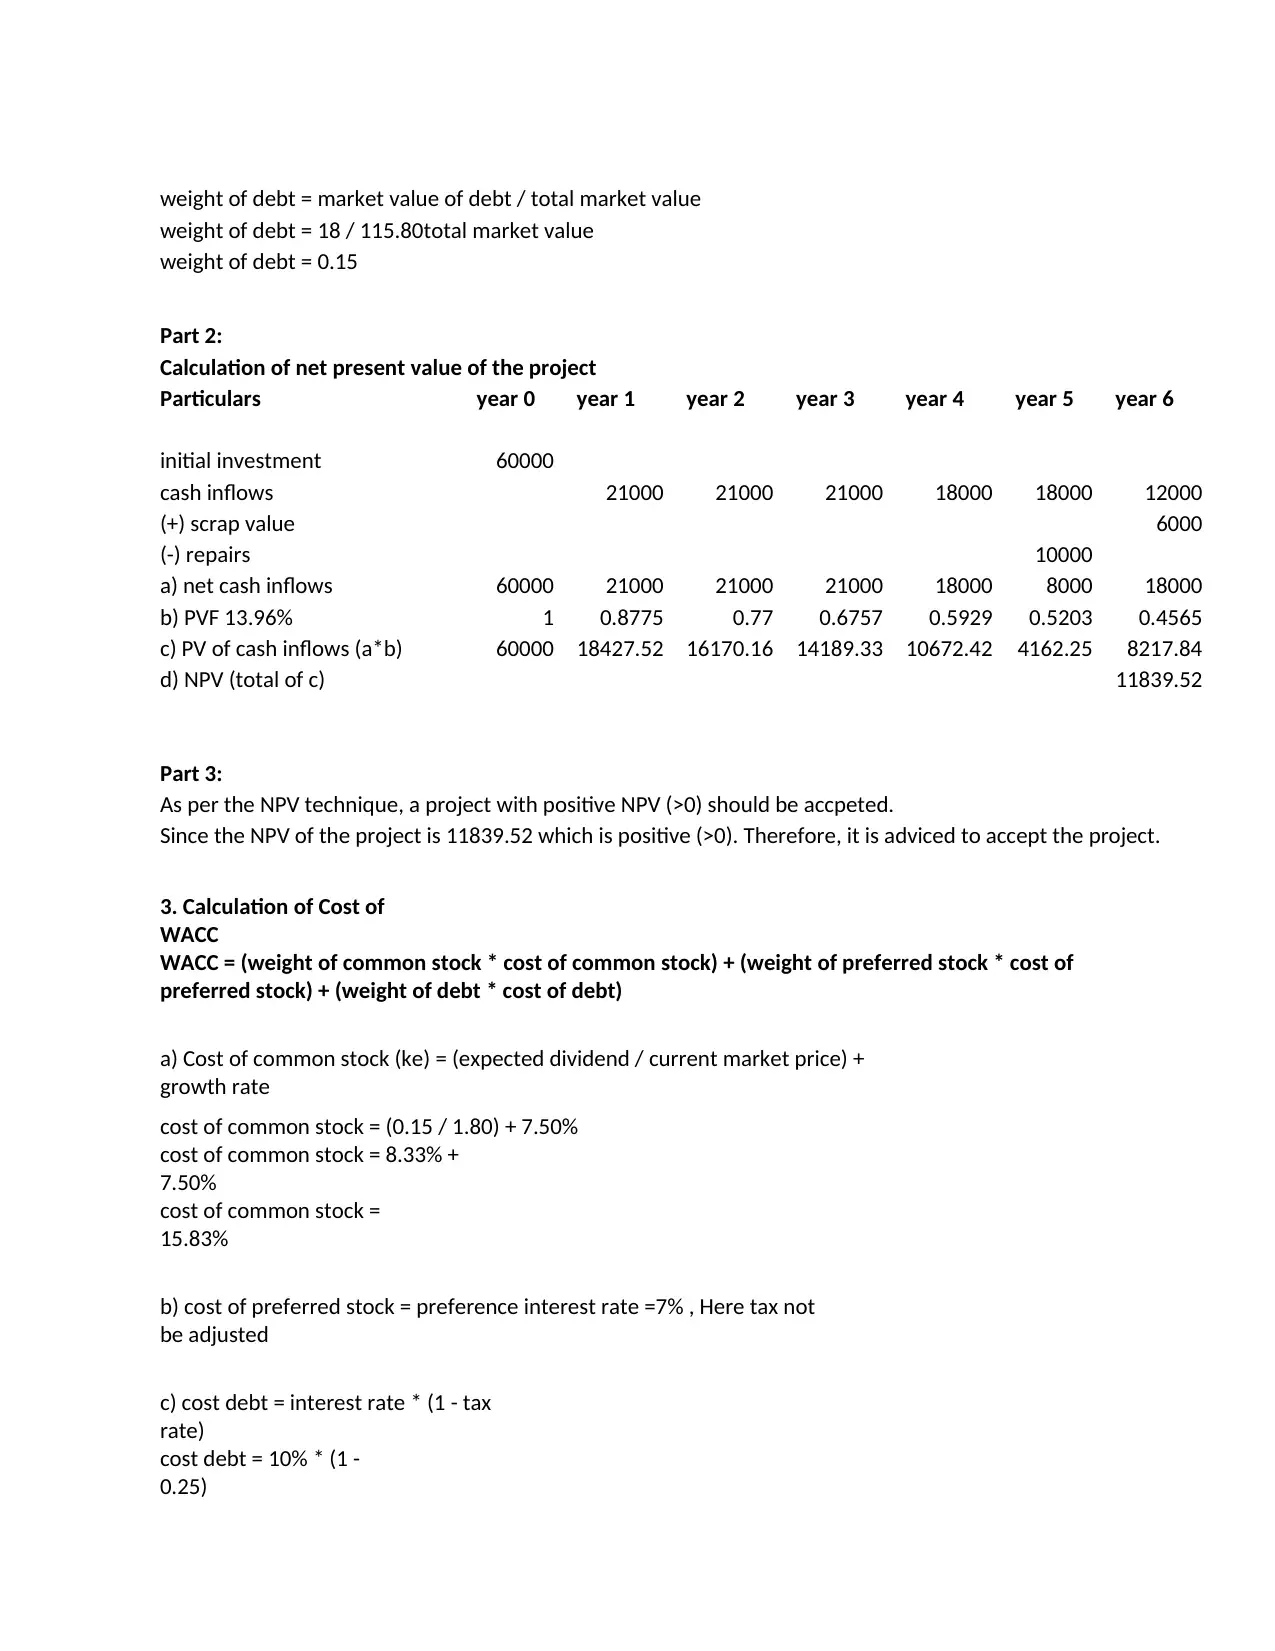
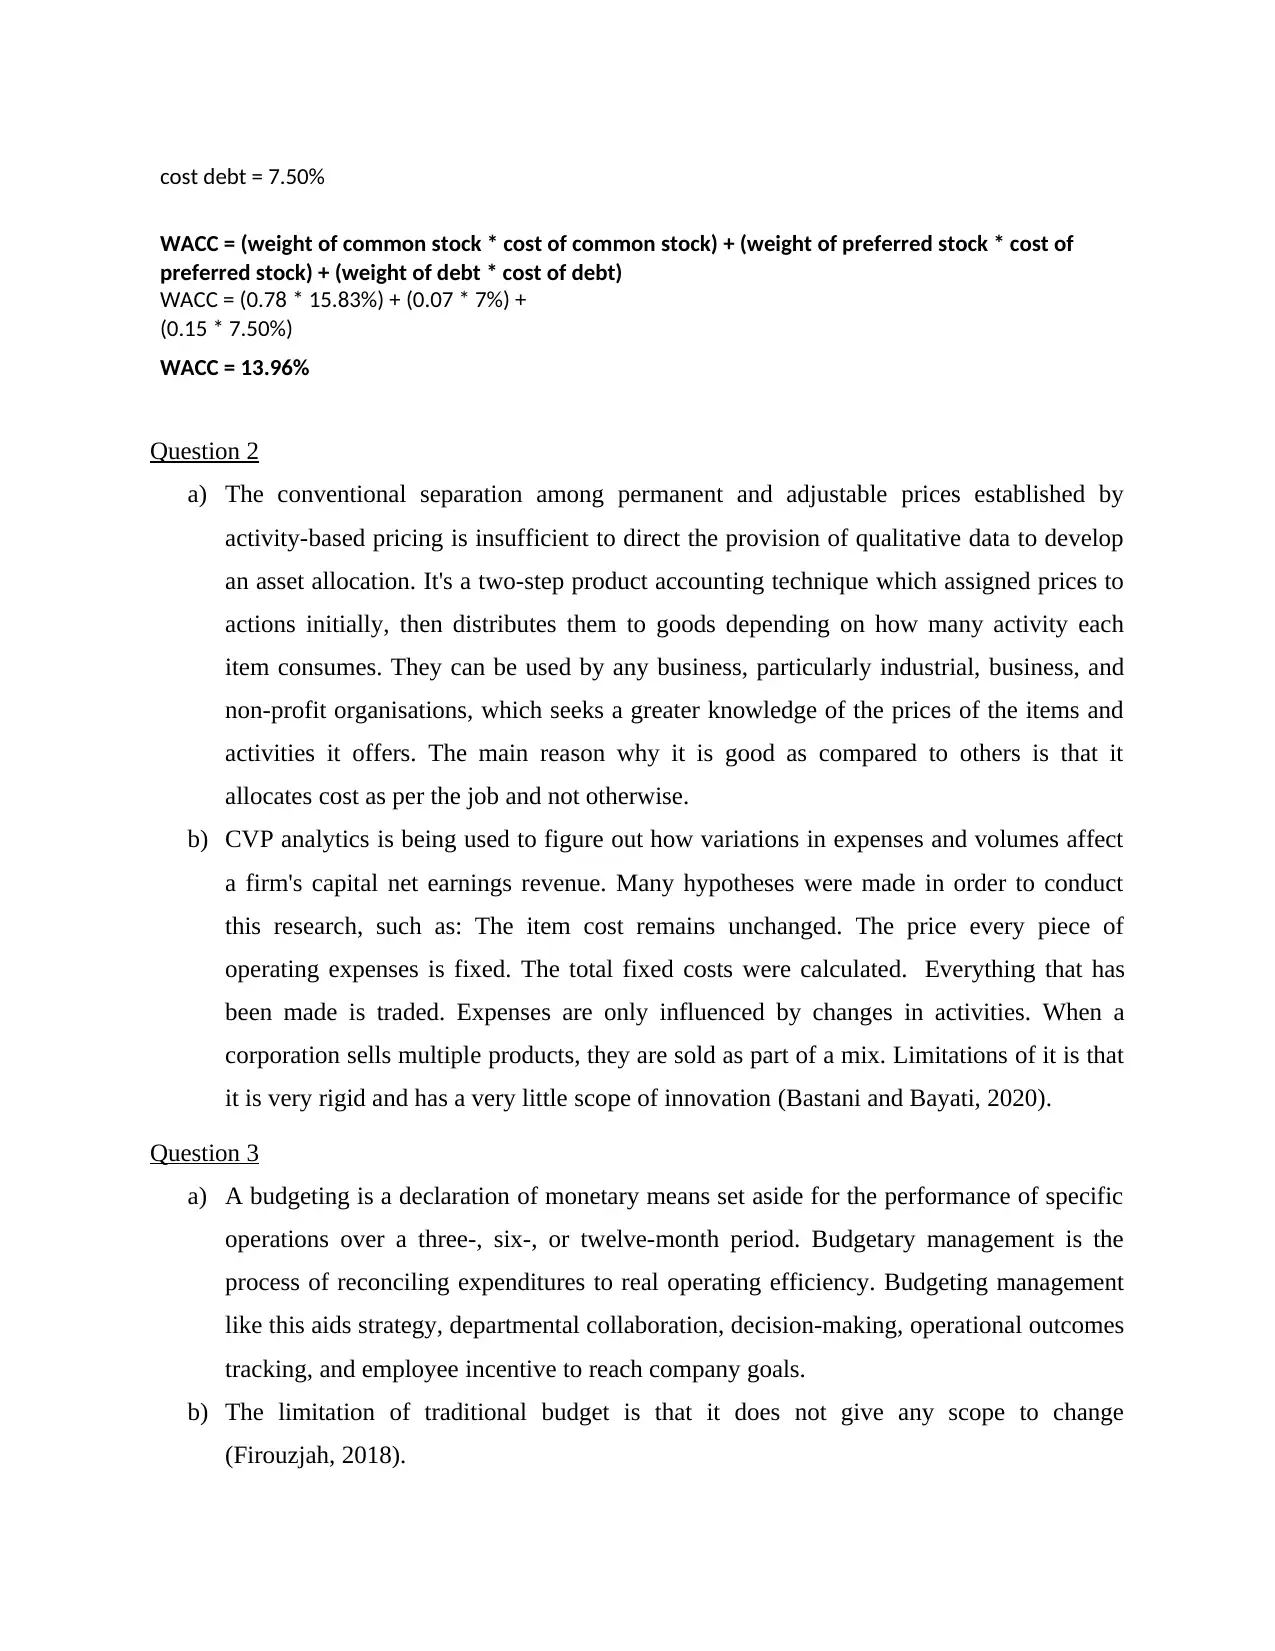
This report provides a comprehensive analysis of financial management and decision-making, focusing on key areas such as investment analysis, cost of capital, budgeting, and stakeholder approaches. It includes calculations of market values, weights, and net present value (NPV) for a project, along with an assessment of weighted average cost of capital (WACC). The report also discusses activity-based pricing, cost-volume-profit (CVP) analysis, and various funding options for firms, emphasizing the importance of considering market situations and stakeholder interests for long-term growth and development. This document is useful for students looking for solved assignments.

1 out of 7
Related Documents


Your All-in-One AI-Powered Toolkit for Academic Success.
+13062052269
info@desklib.com
Available 24*7 on WhatsApp / Email
![[object Object]](/_next/static/media/star-bottom.7253800d.svg)
Copyright © 2020–2025 A2Z Services. All Rights Reserved. Developed and managed by ZUCOL.