Financial Management Project: Analyzing Unilever Group Plc's Finances
VerifiedAdded on 2023/01/13
|16
|2636
|55
Project
AI Summary
This project delves into the financial management of Unilever Group Plc, employing a comprehensive financial model to assess its performance. It begins with an introduction to financial management and its significance, followed by the construction of a detailed financial model incorporating pro forma financial statements (income statement, balance sheet, and cash flow statement) from 2017 to 2019. The model includes various inputs and assumptions, such as sales growth, interest rates, and payout ratios. The project then calculates amortization, projects cash flows, analyzes debt structures, and considers different scenarios to evaluate the company's financial health. Key financial management concepts, including the weighted average cost of capital (WACC), net present value (NPV), internal rate of return (IRR), and payback period are applied to assess investment viability. The analysis also includes the valuation of the company using the Free Cash Flow to Equity (FCFE) model and a discussion of financial analysis techniques. The project concludes with an overview of the findings and their implications for Unilever's financial strategy.

FINANCIAL MANAGEMENT
Paraphrase This Document
Need a fresh take? Get an instant paraphrase of this document with our AI Paraphraser
TABLE OF CONTENTS
INTRODUCTION...........................................................................................................................1
FINANCIAL MODEL.....................................................................................................................1
Proforma......................................................................................................................................1
Inputs............................................................................................................................................4
Amortisation................................................................................................................................5
Projection of Cash Flows.............................................................................................................5
Debt..............................................................................................................................................6
Cash Flows ..................................................................................................................................7
Scenarios......................................................................................................................................9
Financial Management...............................................................................................................11
CONCLUSION..............................................................................................................................14
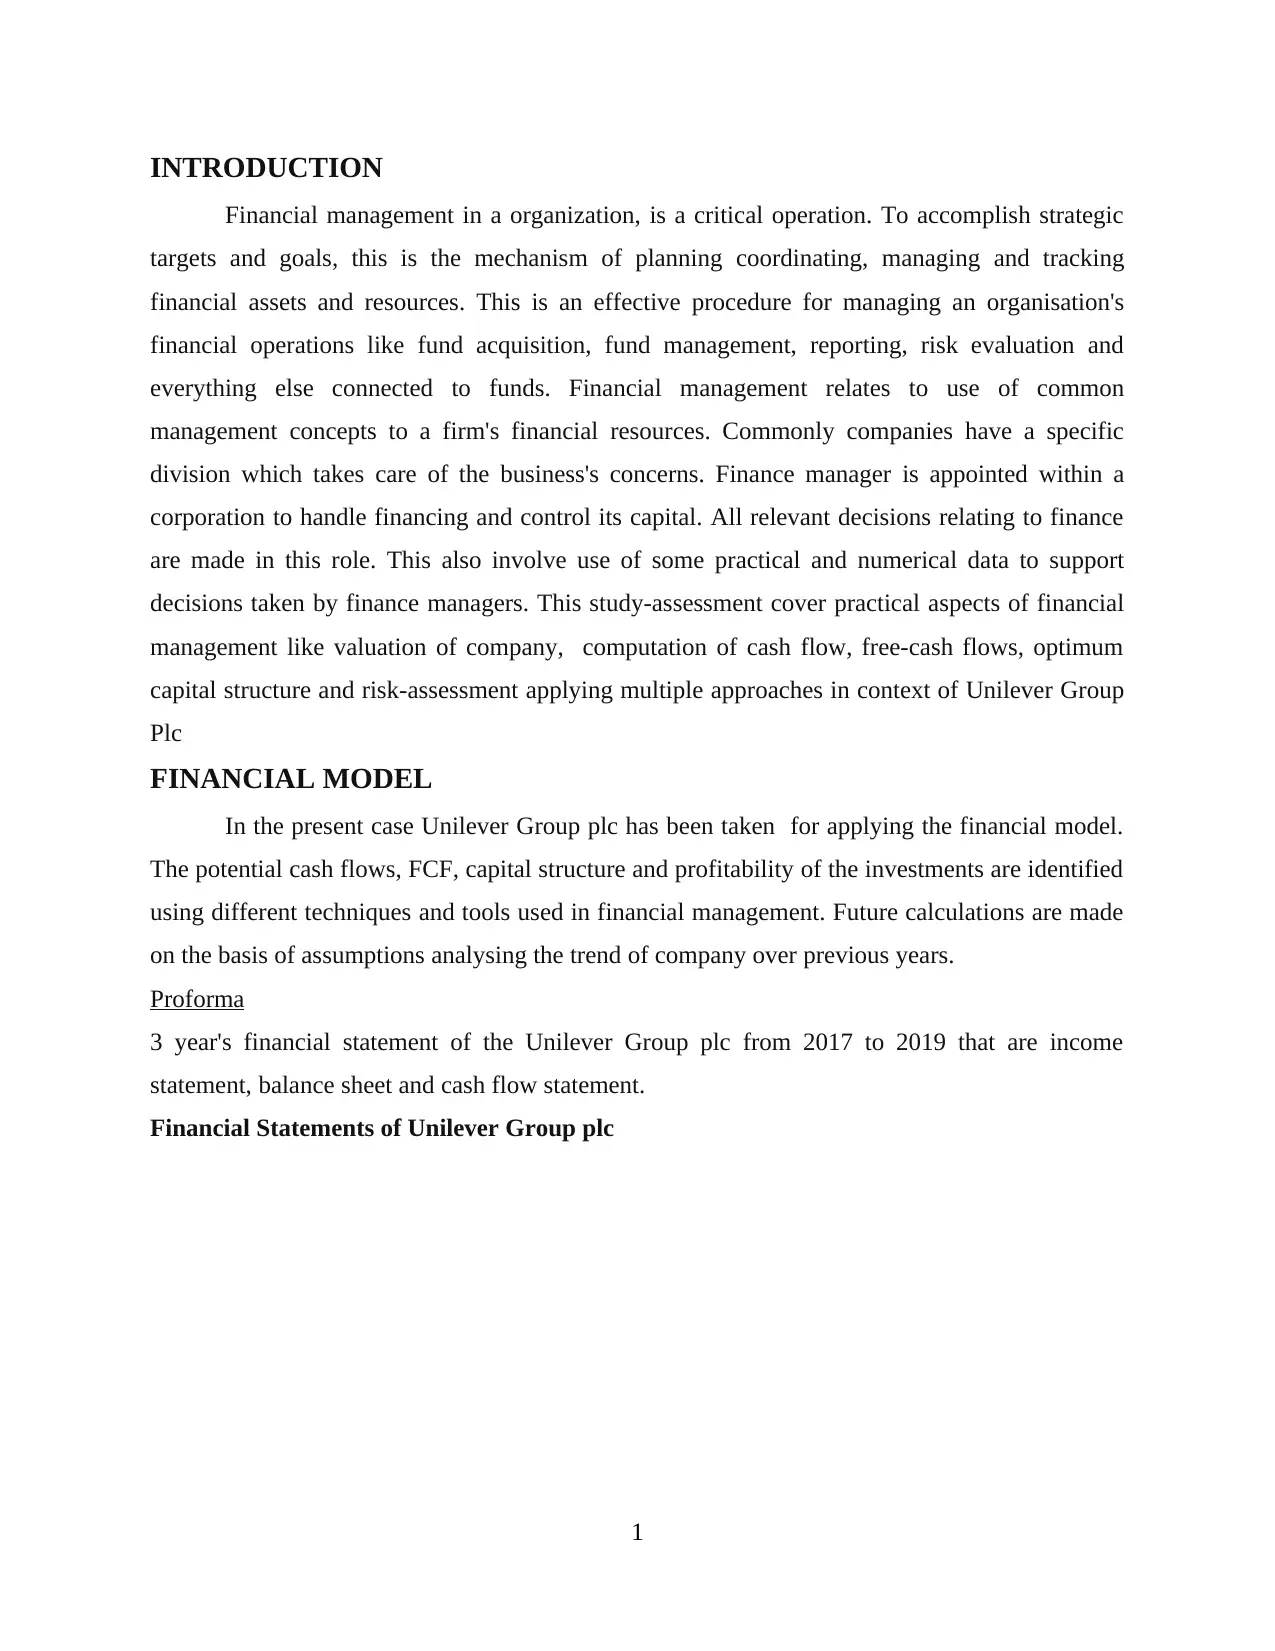
INTRODUCTION
Financial management in a organization, is a critical operation. To accomplish strategic
targets and goals, this is the mechanism of planning coordinating, managing and tracking
financial assets and resources. This is an effective procedure for managing an organisation's
financial operations like fund acquisition, fund management, reporting, risk evaluation and
everything else connected to funds. Financial management relates to use of common
management concepts to a firm's financial resources. Commonly companies have a specific
division which takes care of the business's concerns. Finance manager is appointed within a
corporation to handle financing and control its capital. All relevant decisions relating to finance
are made in this role. This also involve use of some practical and numerical data to support
decisions taken by finance managers. This study-assessment cover practical aspects of financial
management like valuation of company, computation of cash flow, free-cash flows, optimum
capital structure and risk-assessment applying multiple approaches in context of Unilever Group
Plc
FINANCIAL MODEL
In the present case Unilever Group plc has been taken for applying the financial model.
The potential cash flows, FCF, capital structure and profitability of the investments are identified
using different techniques and tools used in financial management. Future calculations are made
on the basis of assumptions analysing the trend of company over previous years.
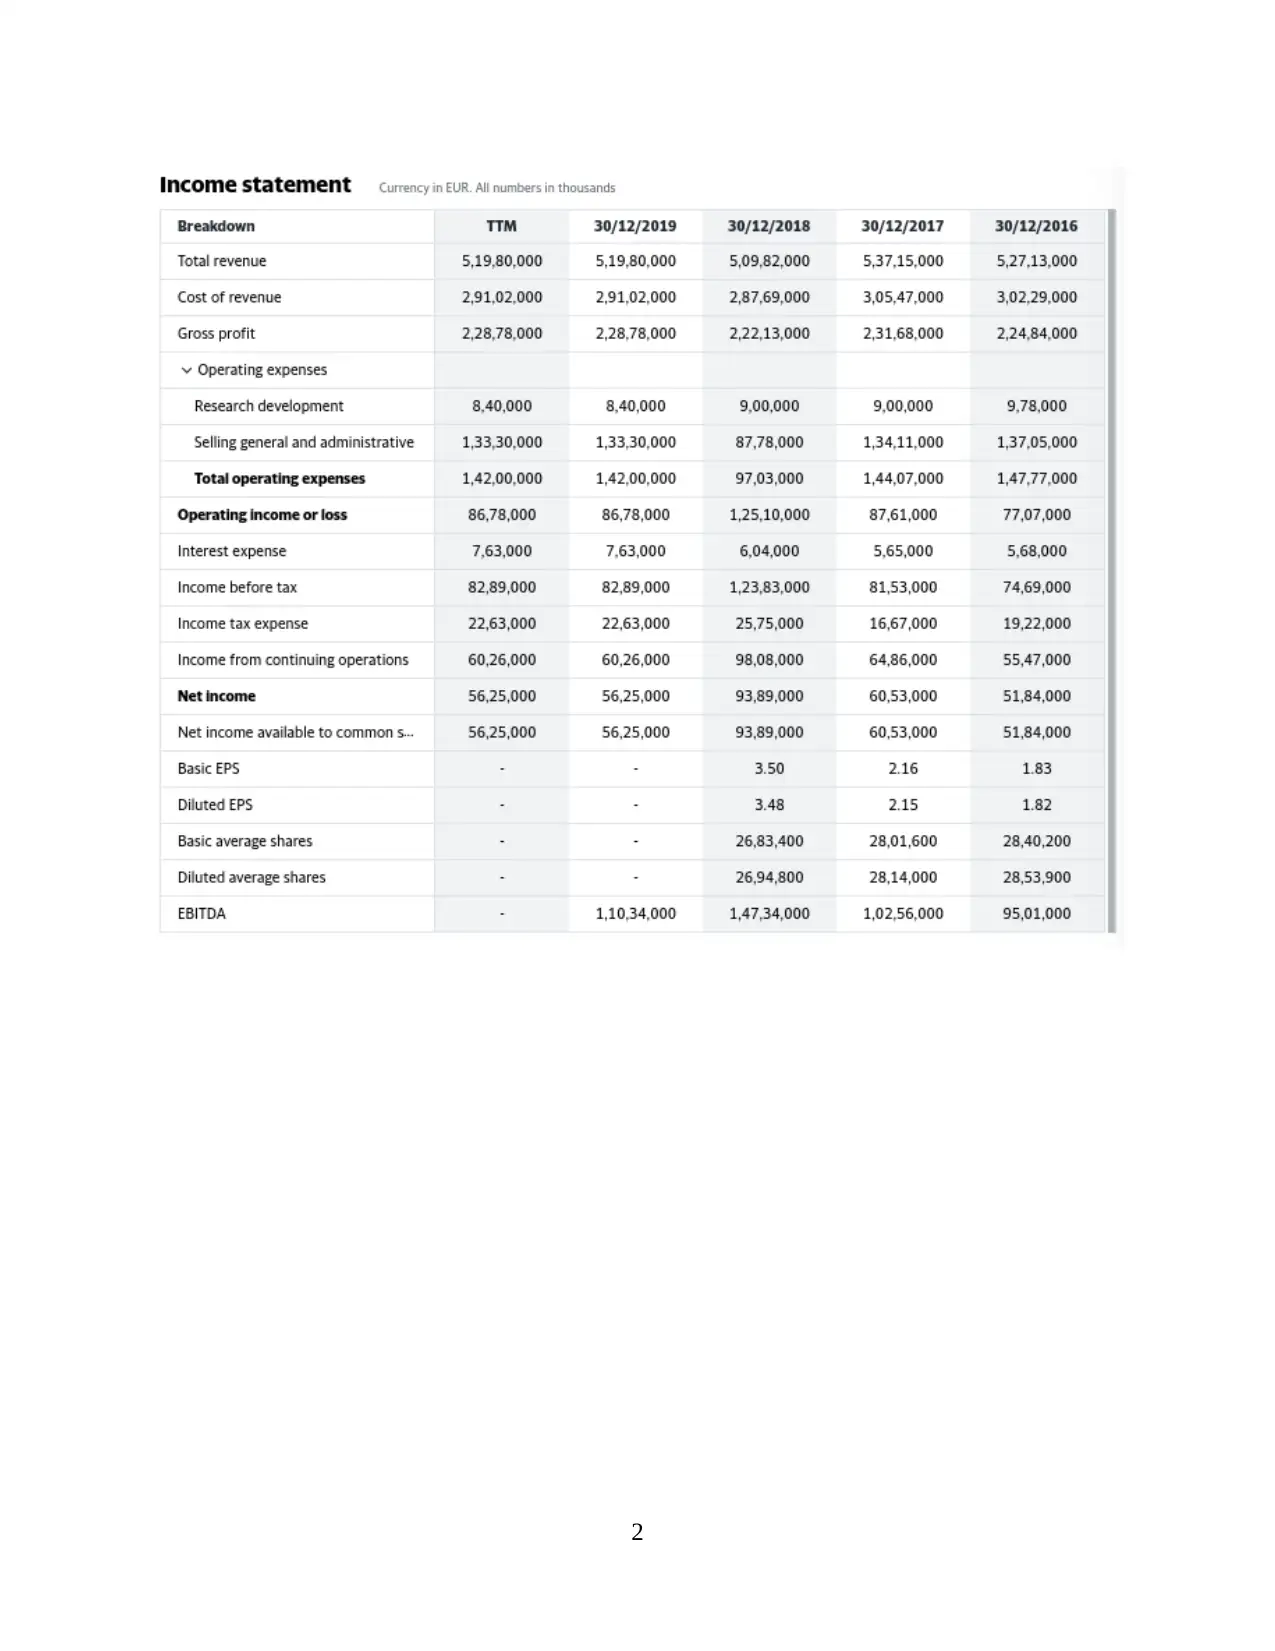
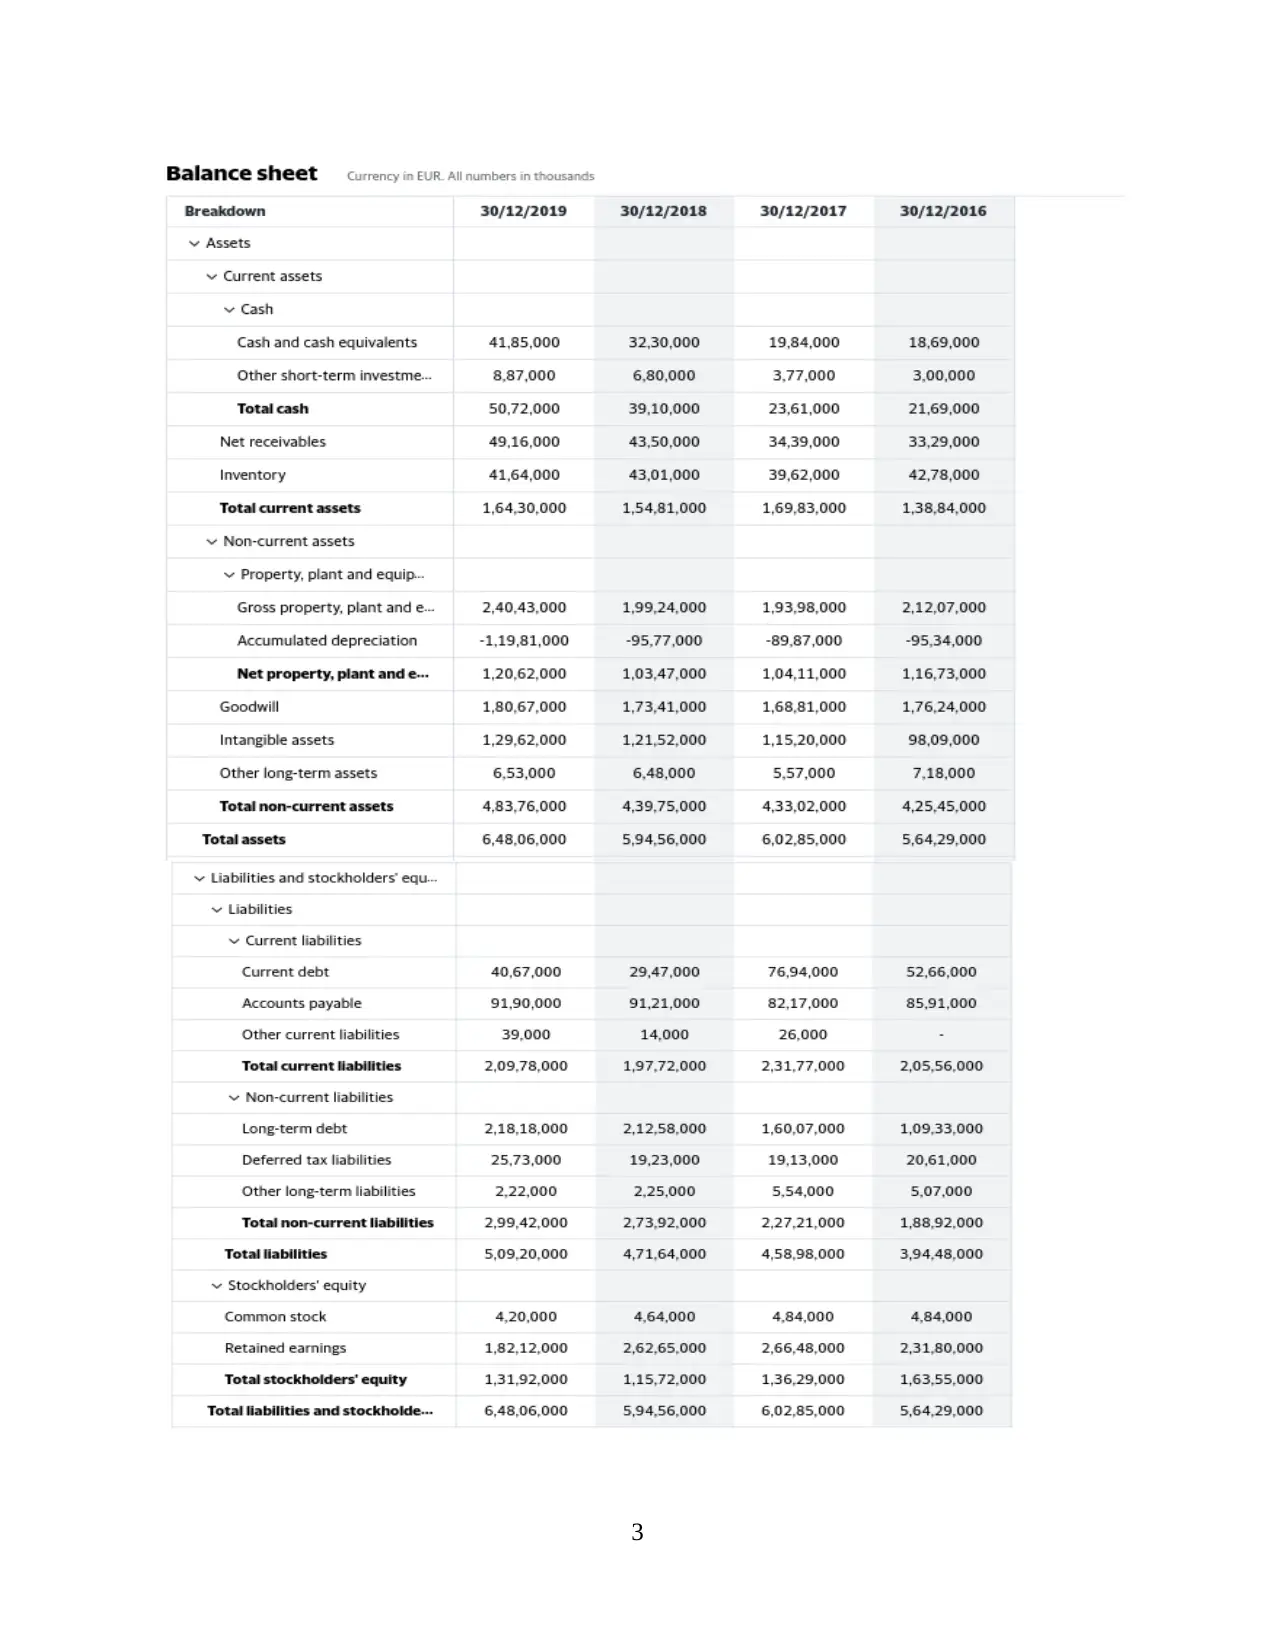
Proforma
3 year's financial statement of the Unilever Group plc from 2017 to 2019 that are income
statement, balance sheet and cash flow statement.
Financial Statements of Unilever Group plc
1
Financial management in a organization, is a critical operation. To accomplish strategic
targets and goals, this is the mechanism of planning coordinating, managing and tracking
financial assets and resources. This is an effective procedure for managing an organisation's
financial operations like fund acquisition, fund management, reporting, risk evaluation and
everything else connected to funds. Financial management relates to use of common
management concepts to a firm's financial resources. Commonly companies have a specific
division which takes care of the business's concerns. Finance manager is appointed within a
corporation to handle financing and control its capital. All relevant decisions relating to finance
are made in this role. This also involve use of some practical and numerical data to support
decisions taken by finance managers. This study-assessment cover practical aspects of financial
management like valuation of company, computation of cash flow, free-cash flows, optimum
capital structure and risk-assessment applying multiple approaches in context of Unilever Group
Plc
FINANCIAL MODEL
In the present case Unilever Group plc has been taken for applying the financial model.
The potential cash flows, FCF, capital structure and profitability of the investments are identified
using different techniques and tools used in financial management. Future calculations are made
on the basis of assumptions analysing the trend of company over previous years.
Proforma
3 year's financial statement of the Unilever Group plc from 2017 to 2019 that are income
statement, balance sheet and cash flow statement.
Financial Statements of Unilever Group plc
1
⊘ This is a preview!⊘
Do you want full access?
Subscribe today to unlock all pages.
Trusted by 1+ million students worldwide
2
Paraphrase This Document
Need a fresh take? Get an instant paraphrase of this document with our AI Paraphraser
3
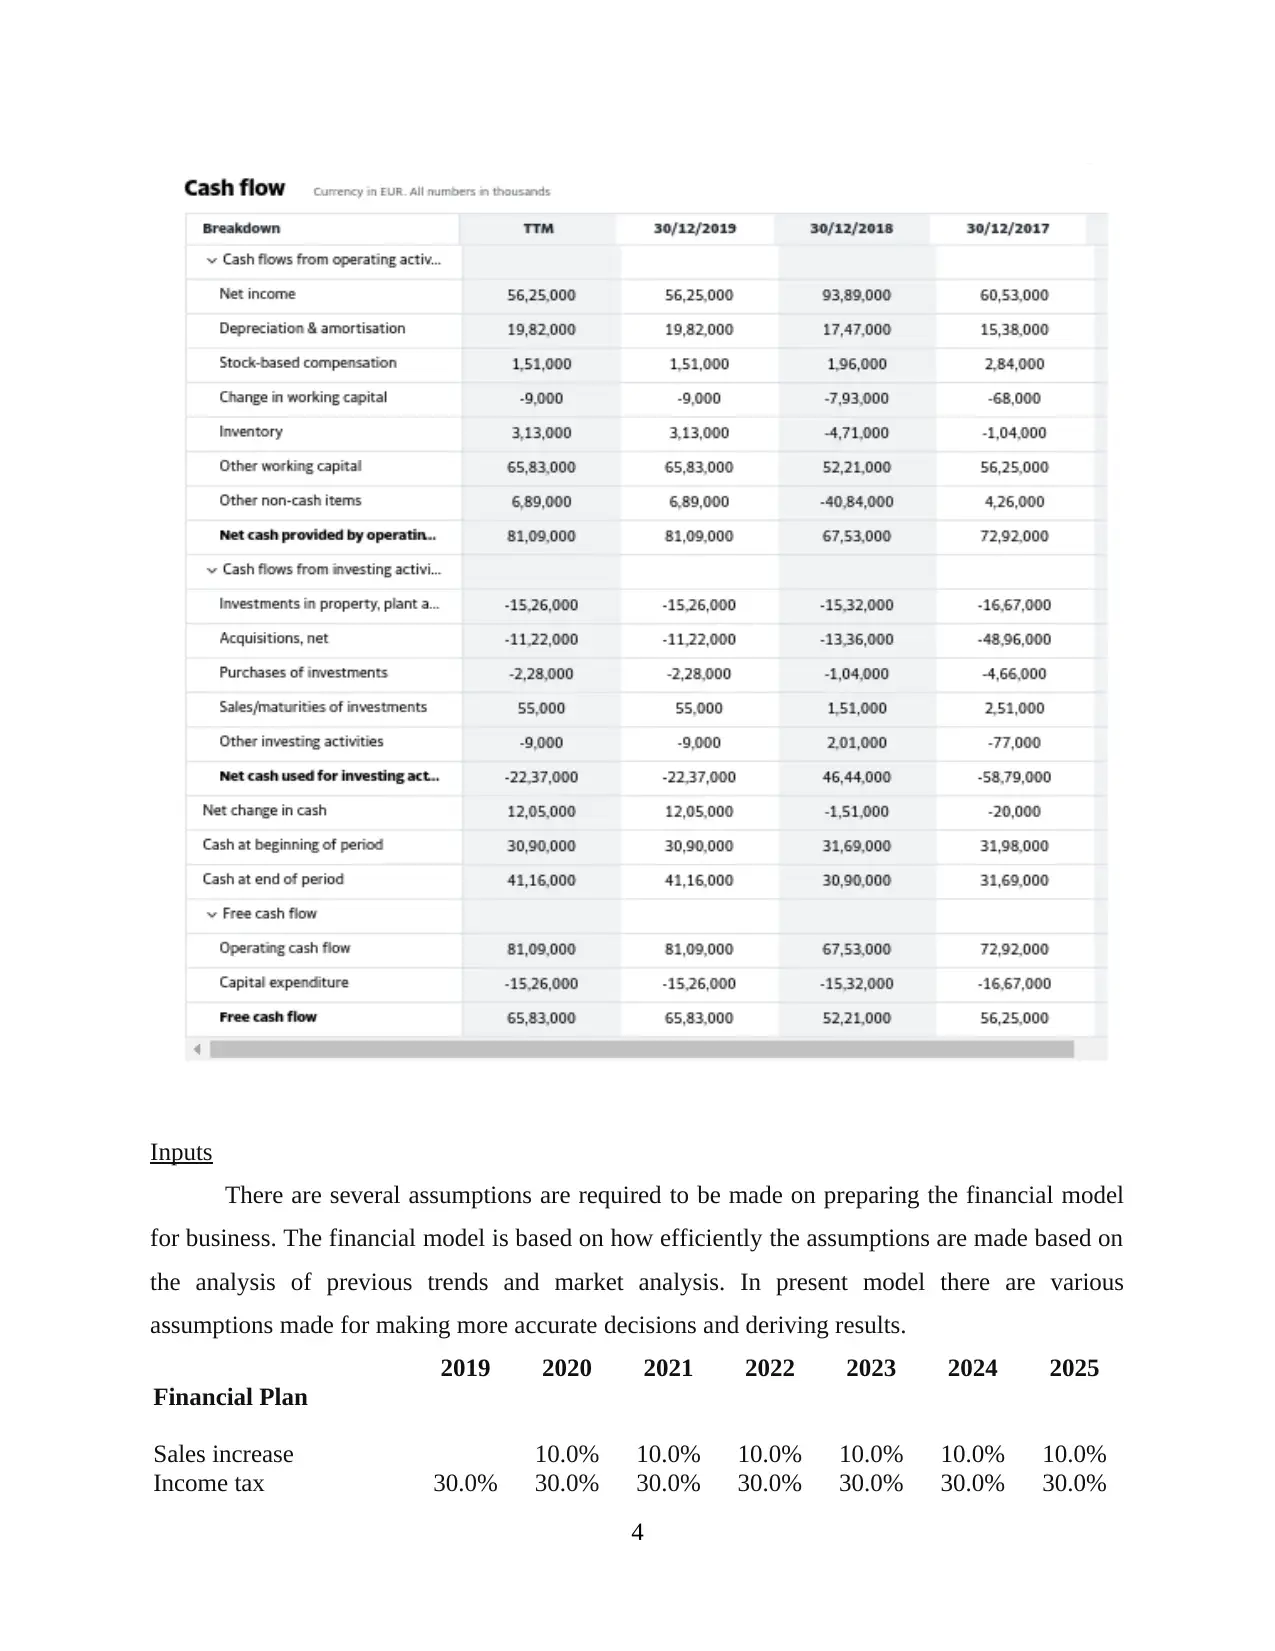
Inputs
There are several assumptions are required to be made on preparing the financial model
for business. The financial model is based on how efficiently the assumptions are made based on
the analysis of previous trends and market analysis. In present model there are various
assumptions made for making more accurate decisions and deriving results.
2019 2020 2021 2022 2023 2024 2025
Financial Plan
Sales increase 10.0% 10.0% 10.0% 10.0% 10.0% 10.0%
Income tax 30.0% 30.0% 30.0% 30.0% 30.0% 30.0% 30.0%
4
⊘ This is a preview!⊘
Do you want full access?
Subscribe today to unlock all pages.
Trusted by 1+ million students worldwide
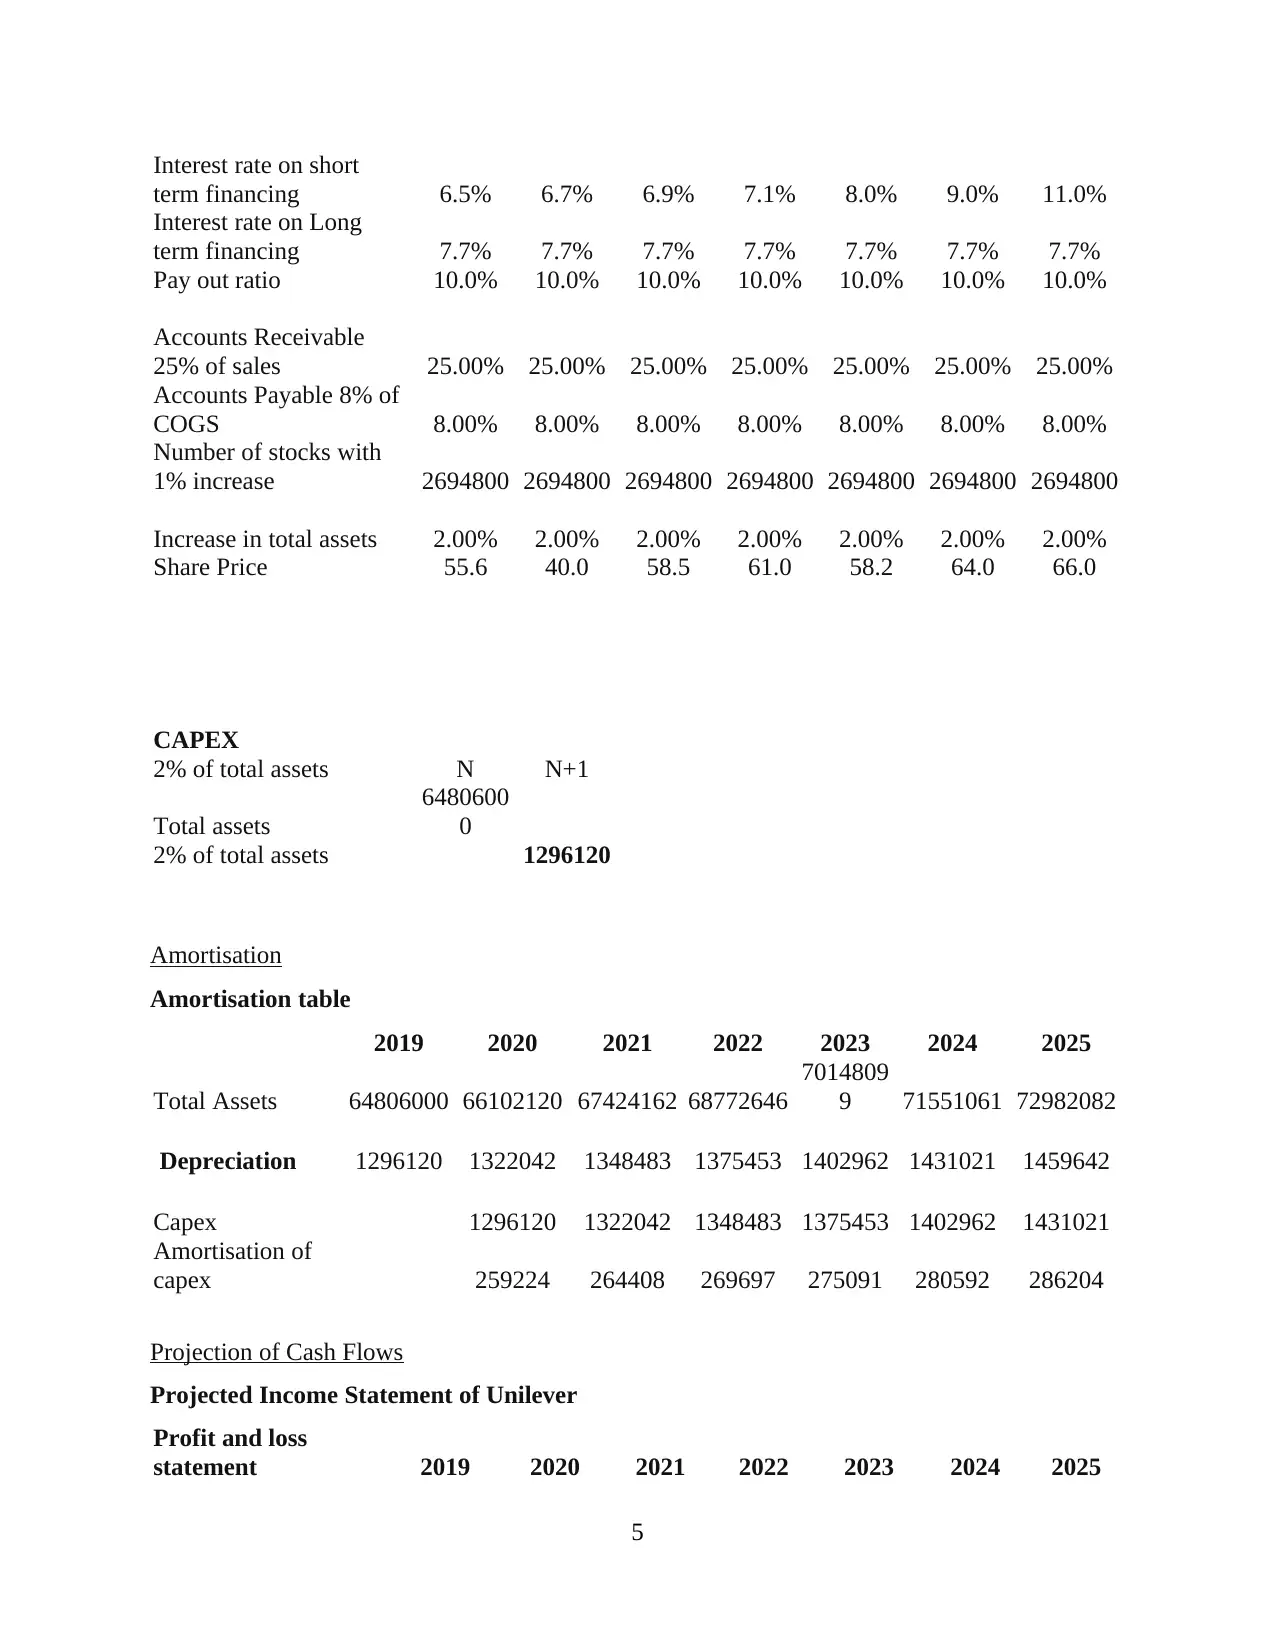
Interest rate on short
term financing 6.5% 6.7% 6.9% 7.1% 8.0% 9.0% 11.0%
Interest rate on Long
term financing 7.7% 7.7% 7.7% 7.7% 7.7% 7.7% 7.7%
Pay out ratio 10.0% 10.0% 10.0% 10.0% 10.0% 10.0% 10.0%
Accounts Receivable
25% of sales 25.00% 25.00% 25.00% 25.00% 25.00% 25.00% 25.00%
Accounts Payable 8% of
COGS 8.00% 8.00% 8.00% 8.00% 8.00% 8.00% 8.00%
Number of stocks with
1% increase 2694800 2694800 2694800 2694800 2694800 2694800 2694800
Increase in total assets 2.00% 2.00% 2.00% 2.00% 2.00% 2.00% 2.00%
Share Price 55.6 40.0 58.5 61.0 58.2 64.0 66.0
CAPEX
2% of total assets N N+1
Total assets
6480600
0
2% of total assets 1296120
Amortisation
Amortisation table
2019 2020 2021 2022 2023 2024 2025
Total Assets 64806000 66102120 67424162 68772646
7014809
9 71551061 72982082
Depreciation 1296120 1322042 1348483 1375453 1402962 1431021 1459642
Capex 1296120 1322042 1348483 1375453 1402962 1431021
Amortisation of
capex 259224 264408 269697 275091 280592 286204
Projection of Cash Flows
Projected Income Statement of Unilever
Profit and loss
statement 2019 2020 2021 2022 2023 2024 2025
5
Paraphrase This Document
Need a fresh take? Get an instant paraphrase of this document with our AI Paraphraser
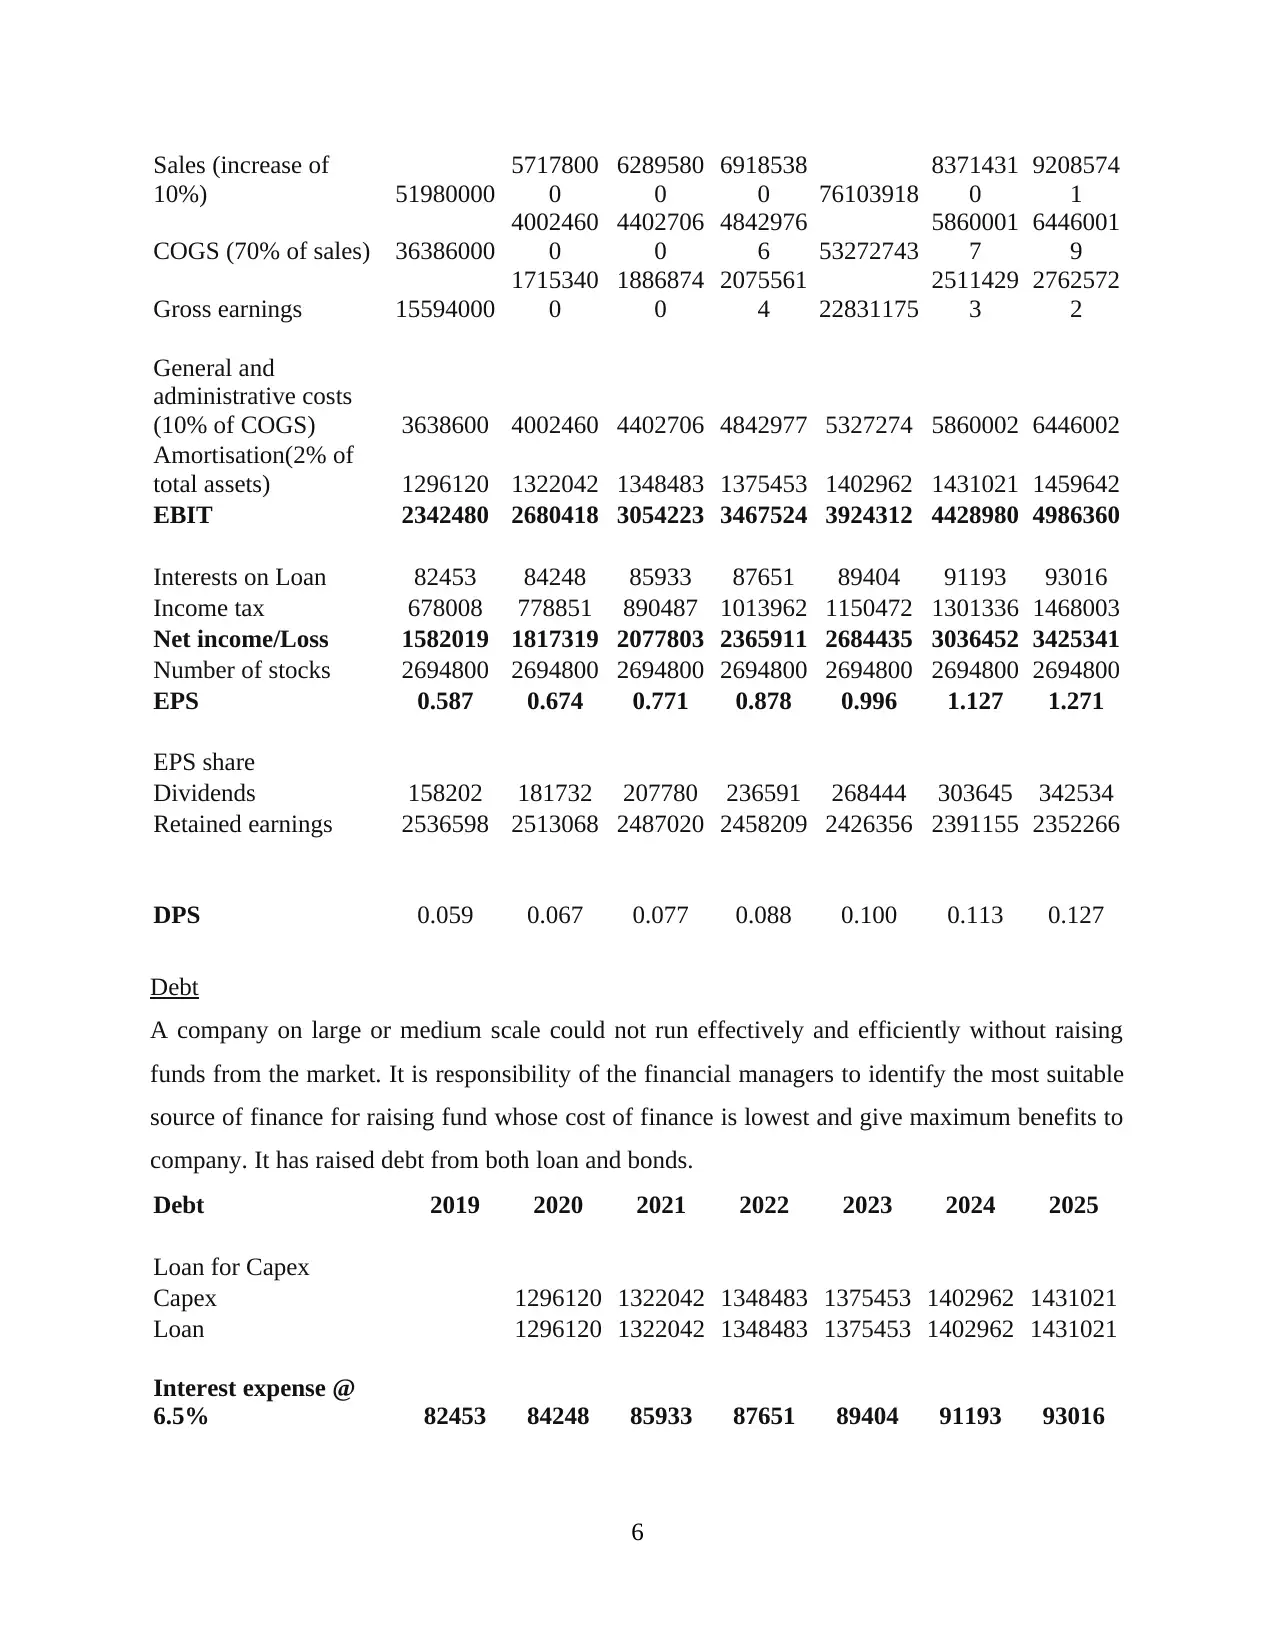
Sales (increase of
10%) 51980000
5717800
0
6289580
0
6918538
0 76103918
8371431
0
9208574
1
COGS (70% of sales) 36386000
4002460
0
4402706
0
4842976
6 53272743
5860001
7
6446001
9
Gross earnings 15594000
1715340
0
1886874
0
2075561
4 22831175
2511429
3
2762572
2
General and
administrative costs
(10% of COGS) 3638600 4002460 4402706 4842977 5327274 5860002 6446002
Amortisation(2% of
total assets) 1296120 1322042 1348483 1375453 1402962 1431021 1459642
EBIT 2342480 2680418 3054223 3467524 3924312 4428980 4986360
Interests on Loan 82453 84248 85933 87651 89404 91193 93016
Income tax 678008 778851 890487 1013962 1150472 1301336 1468003
Net income/Loss 1582019 1817319 2077803 2365911 2684435 3036452 3425341
Number of stocks 2694800 2694800 2694800 2694800 2694800 2694800 2694800
EPS 0.587 0.674 0.771 0.878 0.996 1.127 1.271
EPS share
Dividends 158202 181732 207780 236591 268444 303645 342534
Retained earnings 2536598 2513068 2487020 2458209 2426356 2391155 2352266
DPS 0.059 0.067 0.077 0.088 0.100 0.113 0.127
Debt
A company on large or medium scale could not run effectively and efficiently without raising
funds from the market. It is responsibility of the financial managers to identify the most suitable
source of finance for raising fund whose cost of finance is lowest and give maximum benefits to
company. It has raised debt from both loan and bonds.
Debt 2019 2020 2021 2022 2023 2024 2025
Loan for Capex
Capex 1296120 1322042 1348483 1375453 1402962 1431021
Loan 1296120 1322042 1348483 1375453 1402962 1431021
Interest expense @
6.5% 82453 84248 85933 87651 89404 91193 93016
6
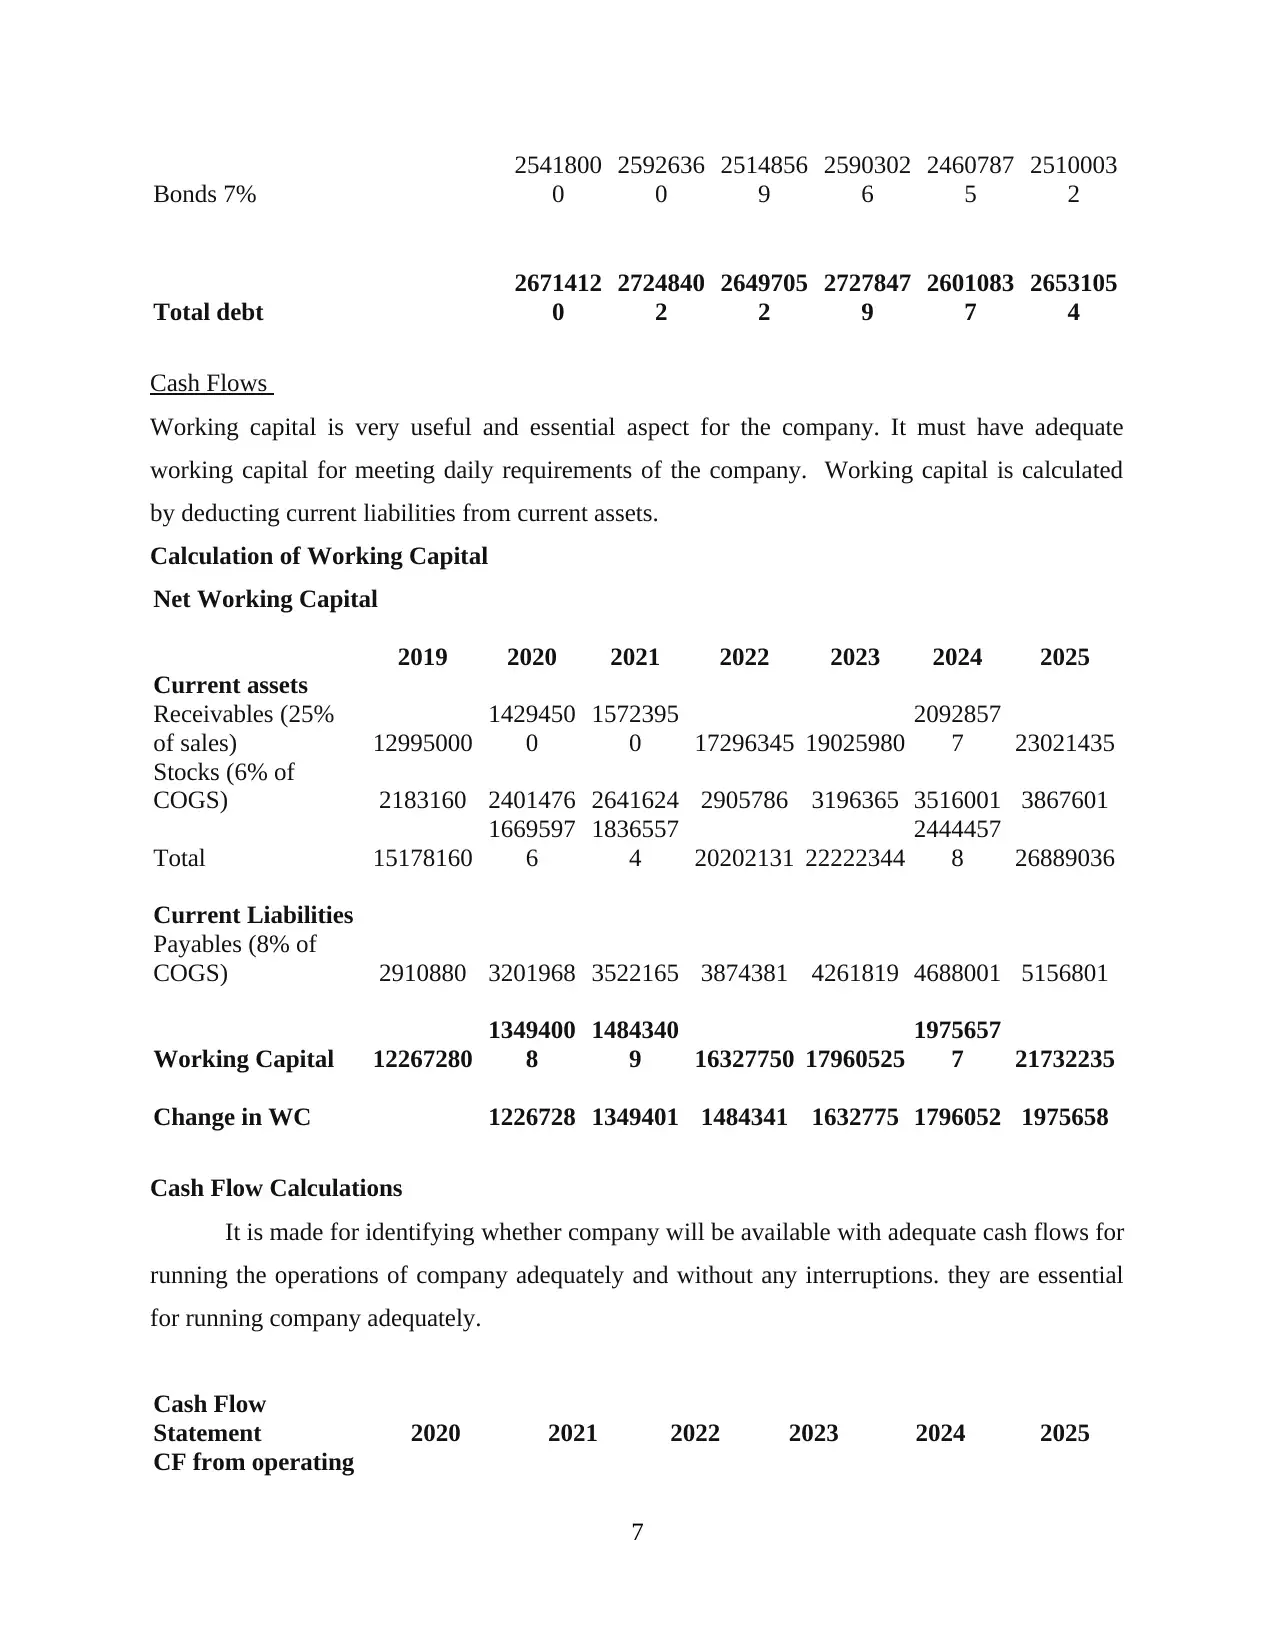
Bonds 7%
2541800
0
2592636
0
2514856
9
2590302
6
2460787
5
2510003
2
Total debt
2671412
0
2724840
2
2649705
2
2727847
9
2601083
7
2653105
4
Cash Flows
Working capital is very useful and essential aspect for the company. It must have adequate
working capital for meeting daily requirements of the company. Working capital is calculated
by deducting current liabilities from current assets.
Calculation of Working Capital
Net Working Capital
2019 2020 2021 2022 2023 2024 2025
Current assets
Receivables (25%
of sales) 12995000
1429450
0
1572395
0 17296345 19025980
2092857
7 23021435
Stocks (6% of
COGS) 2183160 2401476 2641624 2905786 3196365 3516001 3867601
Total 15178160
1669597
6
1836557
4 20202131 22222344
2444457
8 26889036
Current Liabilities
Payables (8% of
COGS) 2910880 3201968 3522165 3874381 4261819 4688001 5156801
Working Capital 12267280
1349400
8
1484340
9 16327750 17960525
1975657
7 21732235
Change in WC 1226728 1349401 1484341 1632775 1796052 1975658
Cash Flow Calculations
It is made for identifying whether company will be available with adequate cash flows for
running the operations of company adequately and without any interruptions. they are essential
for running company adequately.
Cash Flow
Statement 2020 2021 2022 2023 2024 2025
CF from operating
7
⊘ This is a preview!⊘
Do you want full access?
Subscribe today to unlock all pages.
Trusted by 1+ million students worldwide
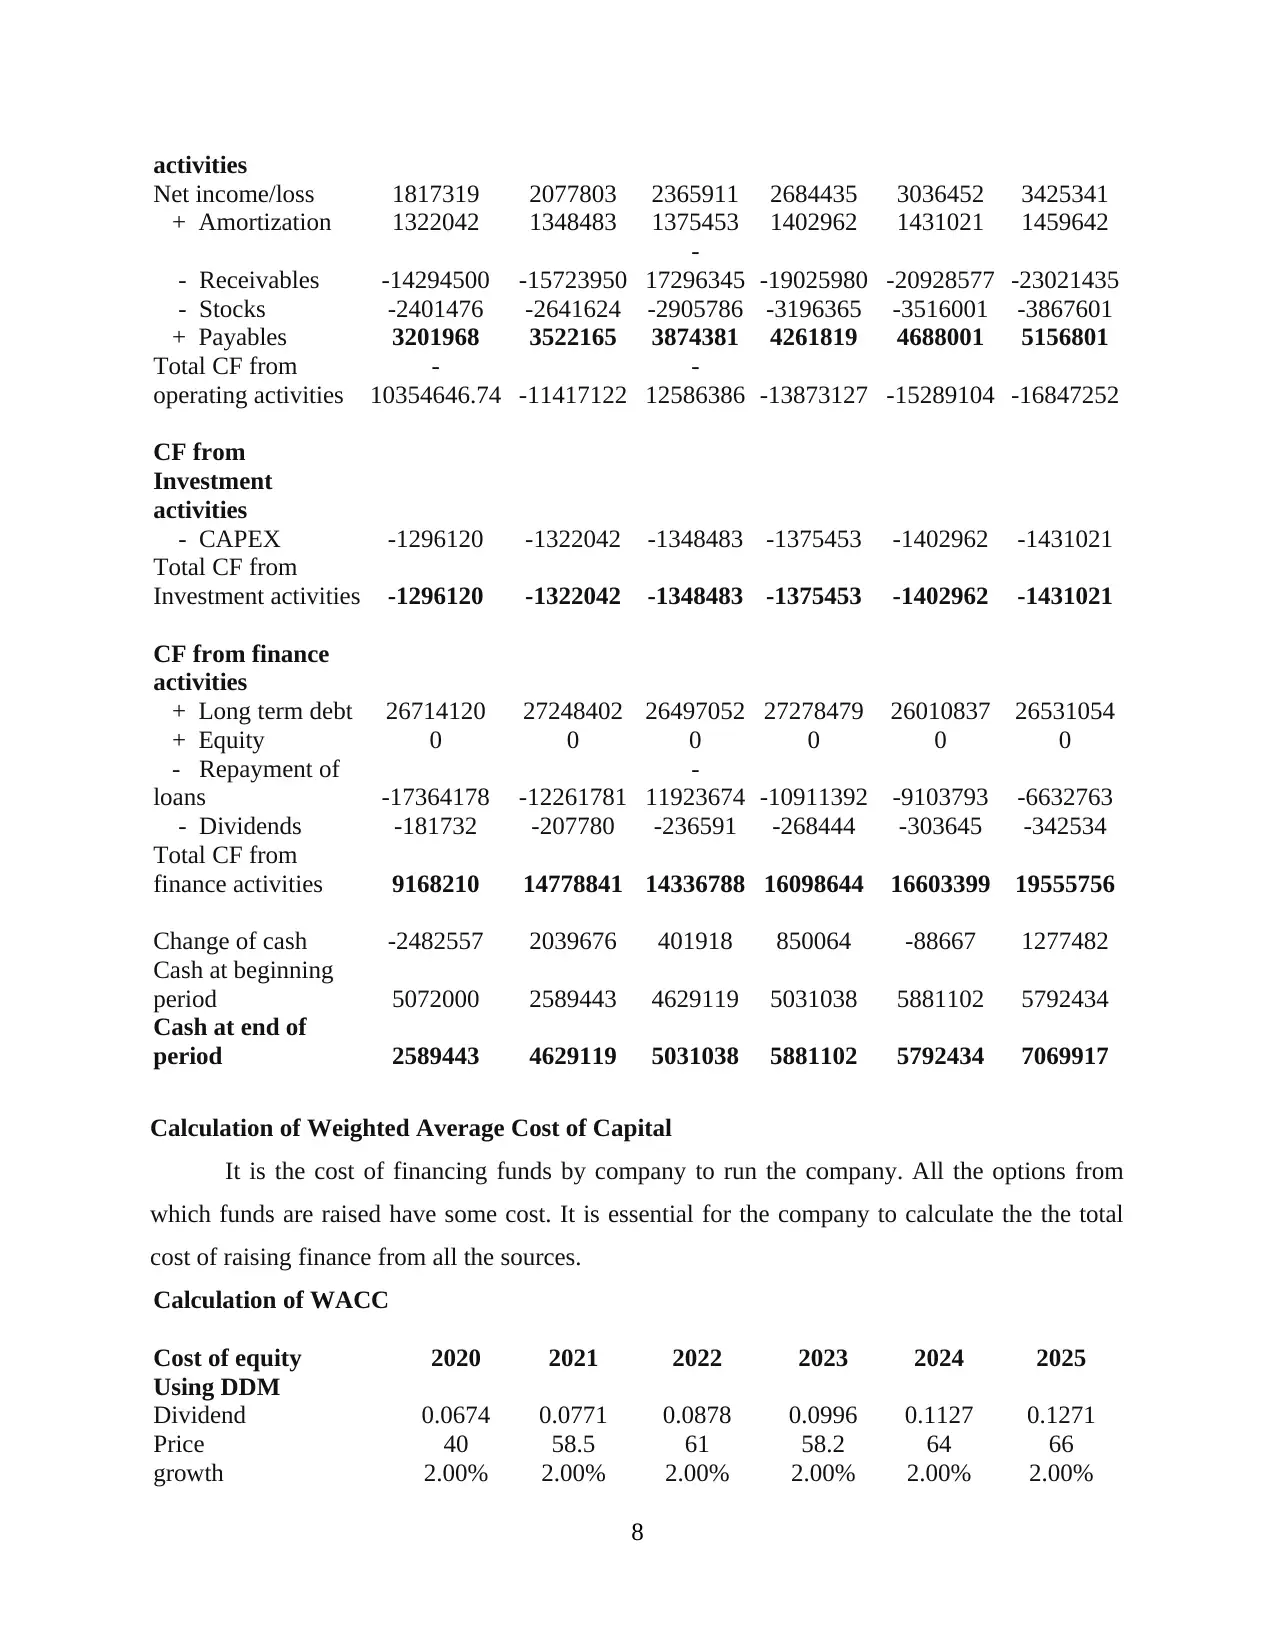
activities
Net income/loss 1817319 2077803 2365911 2684435 3036452 3425341
+ Amortization 1322042 1348483 1375453 1402962 1431021 1459642
- Receivables -14294500 -15723950
-
17296345 -19025980 -20928577 -23021435
- Stocks -2401476 -2641624 -2905786 -3196365 -3516001 -3867601
+ Payables 3201968 3522165 3874381 4261819 4688001 5156801
Total CF from
operating activities
-
10354646.74 -11417122
-
12586386 -13873127 -15289104 -16847252
CF from
Investment
activities
- CAPEX -1296120 -1322042 -1348483 -1375453 -1402962 -1431021
Total CF from
Investment activities -1296120 -1322042 -1348483 -1375453 -1402962 -1431021
CF from finance
activities
+ Long term debt 26714120 27248402 26497052 27278479 26010837 26531054
+ Equity 0 0 0 0 0 0
- Repayment of
loans -17364178 -12261781
-
11923674 -10911392 -9103793 -6632763
- Dividends -181732 -207780 -236591 -268444 -303645 -342534
Total CF from
finance activities 9168210 14778841 14336788 16098644 16603399 19555756
Change of cash -2482557 2039676 401918 850064 -88667 1277482
Cash at beginning
period 5072000 2589443 4629119 5031038 5881102 5792434
Cash at end of
period 2589443 4629119 5031038 5881102 5792434 7069917
Calculation of Weighted Average Cost of Capital
It is the cost of financing funds by company to run the company. All the options from
which funds are raised have some cost. It is essential for the company to calculate the the total
cost of raising finance from all the sources.
Calculation of WACC
Cost of equity 2020 2021 2022 2023 2024 2025
Using DDM
Dividend 0.0674 0.0771 0.0878 0.0996 0.1127 0.1271
Price 40 58.5 61 58.2 64 66
growth 2.00% 2.00% 2.00% 2.00% 2.00% 2.00%
8
Paraphrase This Document
Need a fresh take? Get an instant paraphrase of this document with our AI Paraphraser
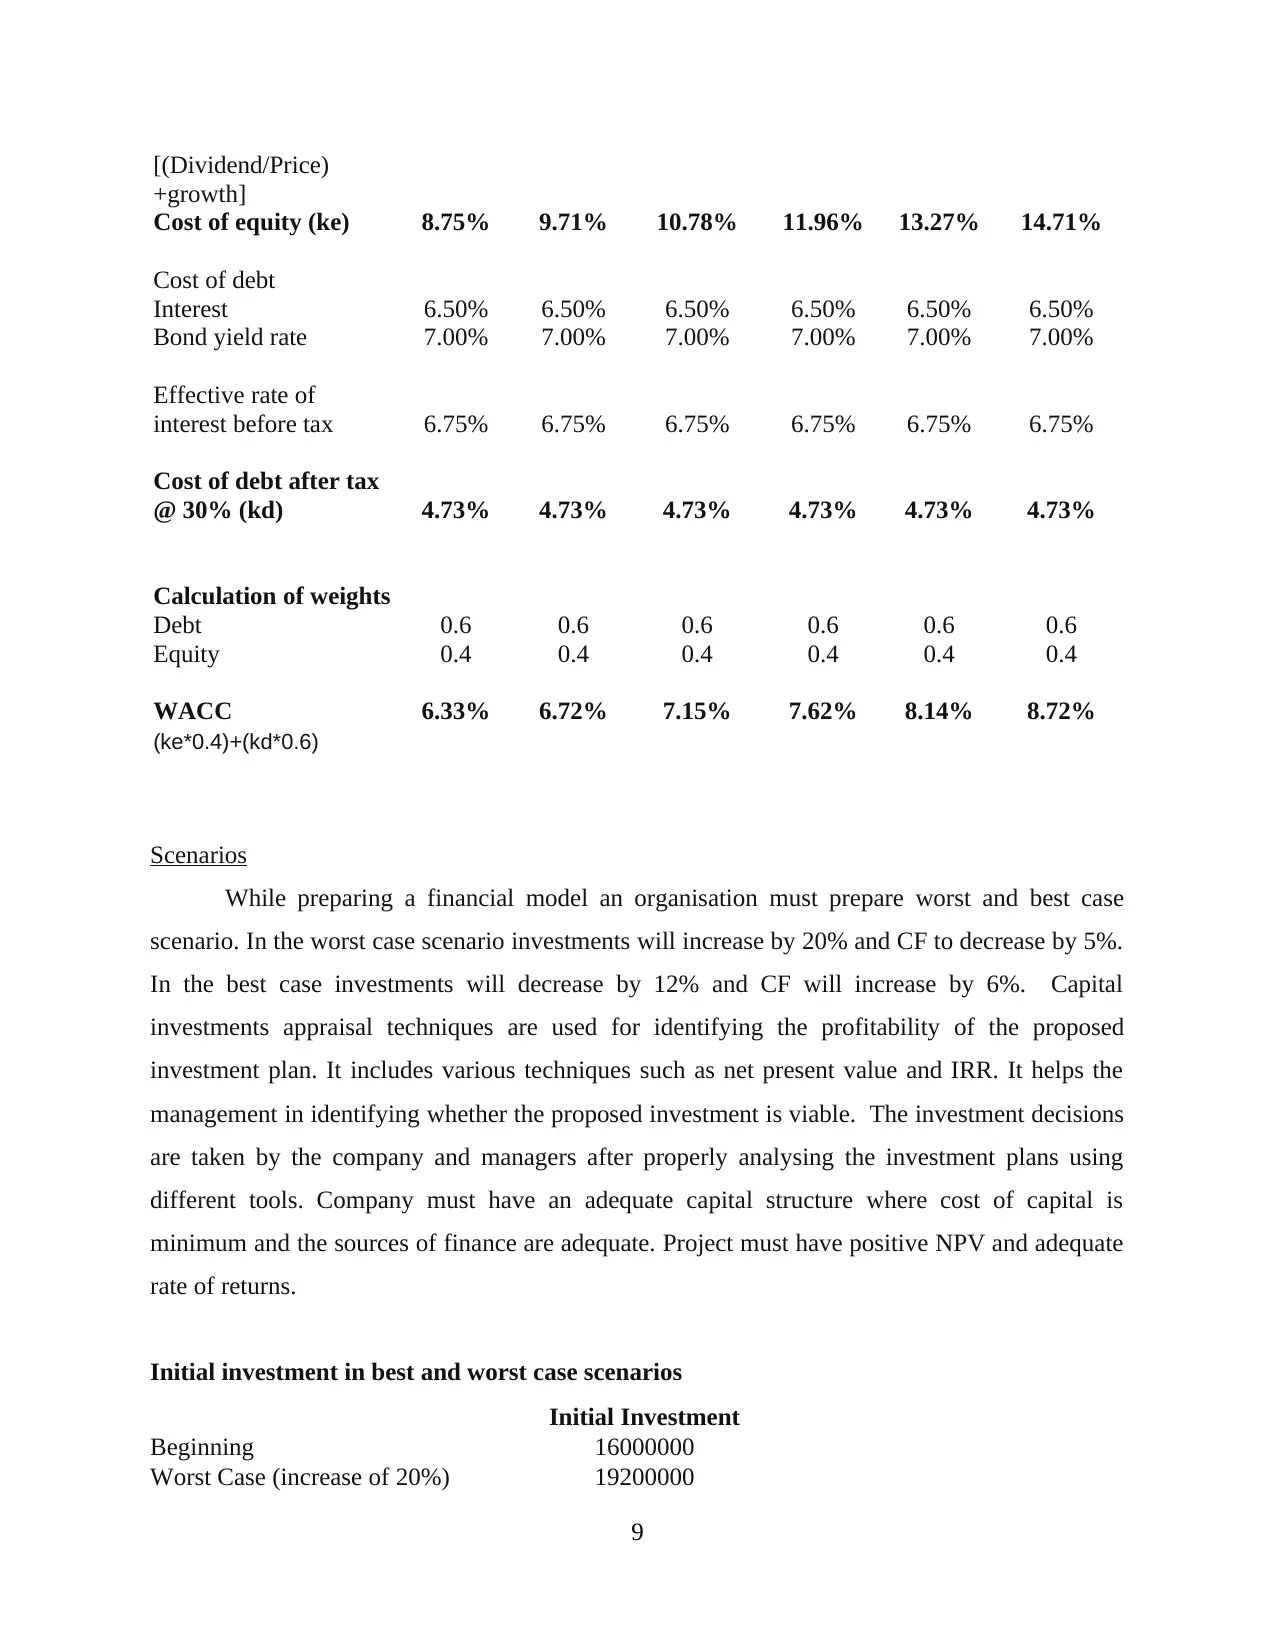
[(Dividend/Price)
+growth]
Cost of equity (ke) 8.75% 9.71% 10.78% 11.96% 13.27% 14.71%
Cost of debt
Interest 6.50% 6.50% 6.50% 6.50% 6.50% 6.50%
Bond yield rate 7.00% 7.00% 7.00% 7.00% 7.00% 7.00%
Effective rate of
interest before tax 6.75% 6.75% 6.75% 6.75% 6.75% 6.75%
Cost of debt after tax
@ 30% (kd) 4.73% 4.73% 4.73% 4.73% 4.73% 4.73%
Calculation of weights
Debt 0.6 0.6 0.6 0.6 0.6 0.6
Equity 0.4 0.4 0.4 0.4 0.4 0.4
WACC 6.33% 6.72% 7.15% 7.62% 8.14% 8.72%
(ke*0.4)+(kd*0.6)
Scenarios
While preparing a financial model an organisation must prepare worst and best case
scenario. In the worst case scenario investments will increase by 20% and CF to decrease by 5%.
In the best case investments will decrease by 12% and CF will increase by 6%. Capital
investments appraisal techniques are used for identifying the profitability of the proposed
investment plan. It includes various techniques such as net present value and IRR. It helps the
management in identifying whether the proposed investment is viable. The investment decisions
are taken by the company and managers after properly analysing the investment plans using
different tools. Company must have an adequate capital structure where cost of capital is
minimum and the sources of finance are adequate. Project must have positive NPV and adequate
rate of returns.
Initial investment in best and worst case scenarios
Initial Investment
Beginning 16000000
Worst Case (increase of 20%) 19200000
9
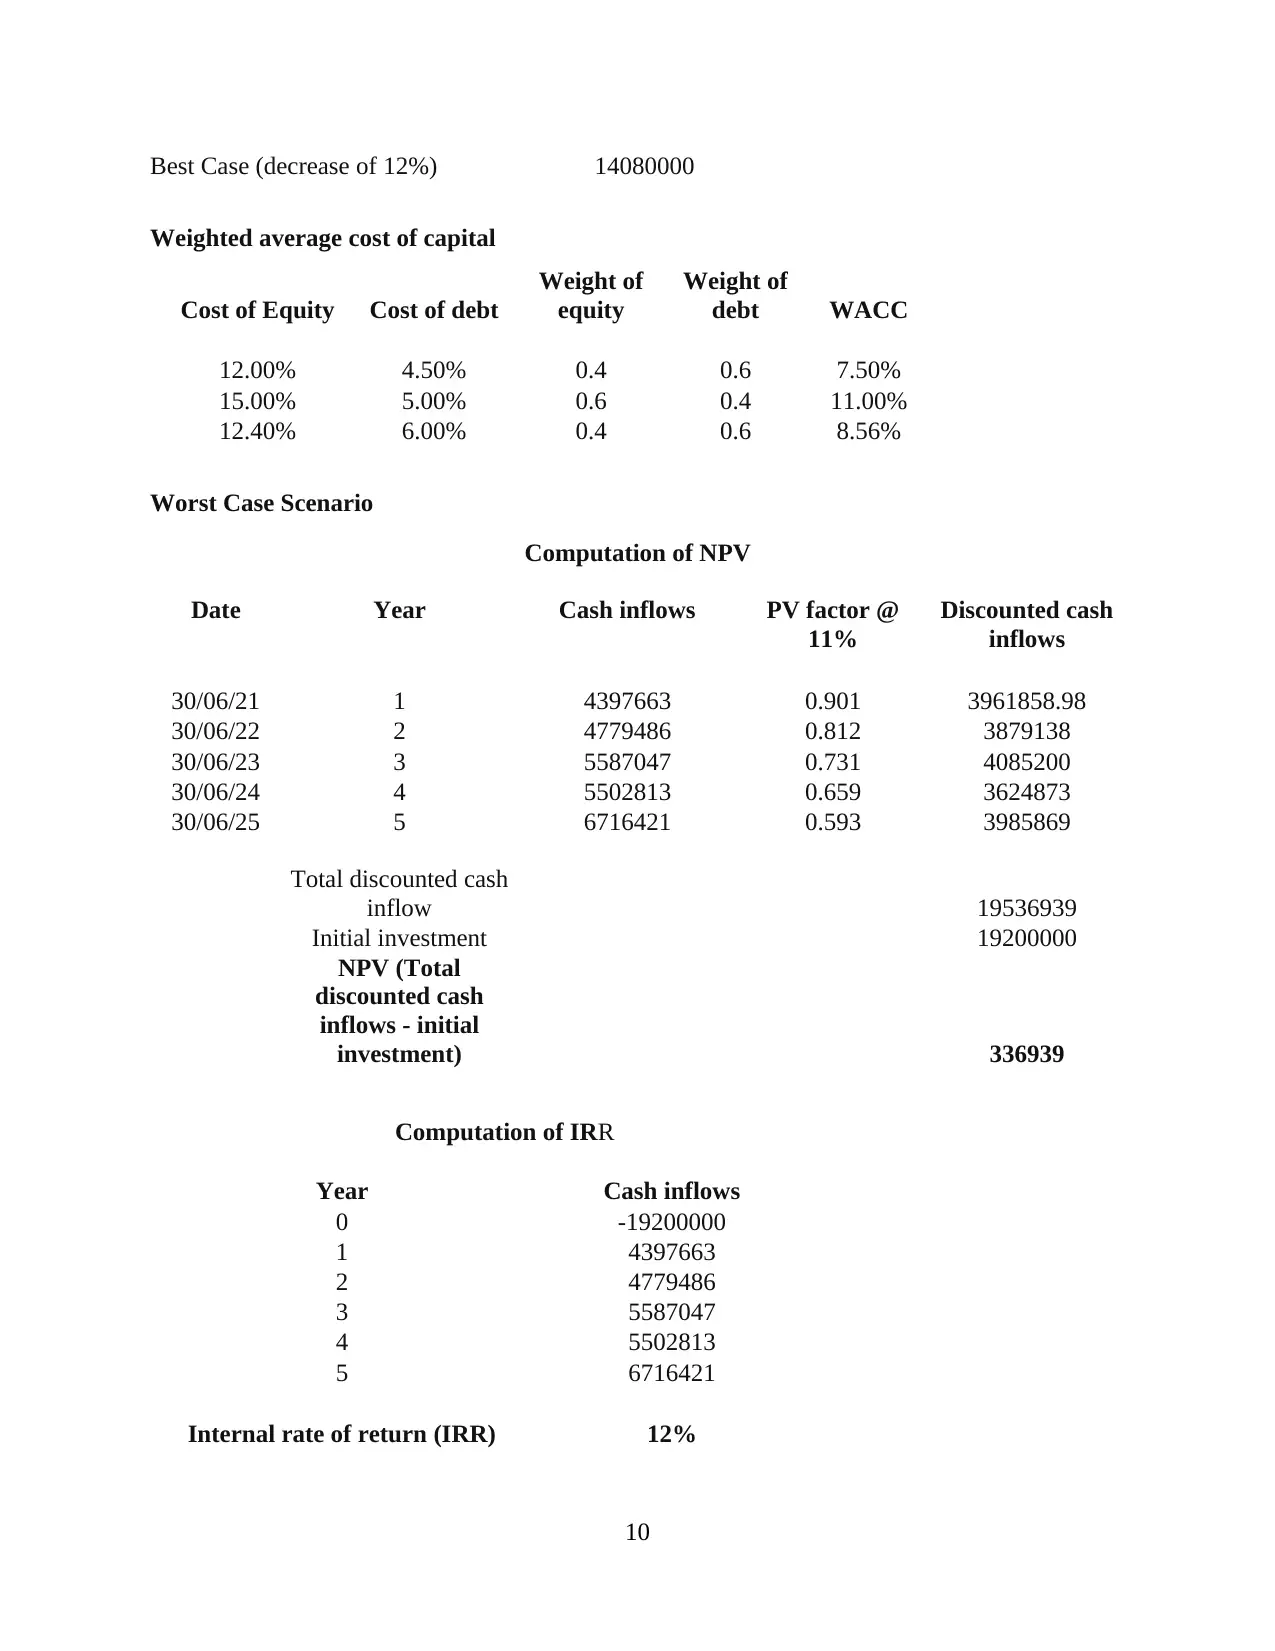
Best Case (decrease of 12%) 14080000
Weighted average cost of capital
Cost of Equity Cost of debt
Weight of
equity
Weight of
debt WACC
12.00% 4.50% 0.4 0.6 7.50%
15.00% 5.00% 0.6 0.4 11.00%
12.40% 6.00% 0.4 0.6 8.56%
Worst Case Scenario
Computation of NPV
Date Year Cash inflows PV factor @
11%
Discounted cash
inflows
30/06/21 1 4397663 0.901 3961858.98
30/06/22 2 4779486 0.812 3879138
30/06/23 3 5587047 0.731 4085200
30/06/24 4 5502813 0.659 3624873
30/06/25 5 6716421 0.593 3985869
Total discounted cash
inflow 19536939
Initial investment 19200000
NPV (Total
discounted cash
inflows - initial
investment) 336939
Computation of IRR
Year Cash inflows
0 -19200000
1 4397663
2 4779486
3 5587047
4 5502813
5 6716421
Internal rate of return (IRR) 12%
10
⊘ This is a preview!⊘
Do you want full access?
Subscribe today to unlock all pages.
Trusted by 1+ million students worldwide
1 out of 16

Your All-in-One AI-Powered Toolkit for Academic Success.
+13062052269
info@desklib.com
Available 24*7 on WhatsApp / Email
![[object Object]](/_next/static/media/star-bottom.7253800d.svg)
Unlock your academic potential
Copyright © 2020–2026 A2Z Services. All Rights Reserved. Developed and managed by ZUCOL.