Financial Analysis of Agthia in 2012
VerifiedAdded on 2020/05/28
|13
|1896
|103
AI Summary
This assignment delves into the financial health of Agthia in 2012 through a detailed analysis of its key financial ratios. It examines both leverage ratios (Debt Ratio, Equity Ratio, Debt Equity Ratio, Times Interest Earned) and turnover ratios (Accounts Receivable Turnover, Fixed Asset Turnover Ratio, Sales to Inventory Turnover, Accounts Payable to Sales Turnover). The analysis utilizes tables and figures to present the data clearly and concisely, highlighting trends and providing insights into Agthia's financial performance during that year.
Contribute Materials
Your contribution can guide someone’s learning journey. Share your
documents today.
Running head: FINANCIAL MANAGEMENT
Financial Management
Name of the Student
Name of the University
Authors Note
Course ID
Financial Management
Name of the Student
Name of the University
Authors Note
Course ID
Secure Best Marks with AI Grader
Need help grading? Try our AI Grader for instant feedback on your assignments.
1FINANCIAL MANAGEMENT
Table of Contents
Brief Profile of the firm:............................................................................................................2
Common Size Analysis Income Statement:...............................................................................2
Common size Analysis Balance Sheet:......................................................................................3
Common size Analysis Cash Flow Statement:..........................................................................4
Profitability Ratios:....................................................................................................................5
Liquidity Ratios:.........................................................................................................................7
Leverage ratio:...........................................................................................................................8
Turnover Ratio...........................................................................................................................9
Reference List:.........................................................................................................................12
2FINANCIAL MANAGEMENT
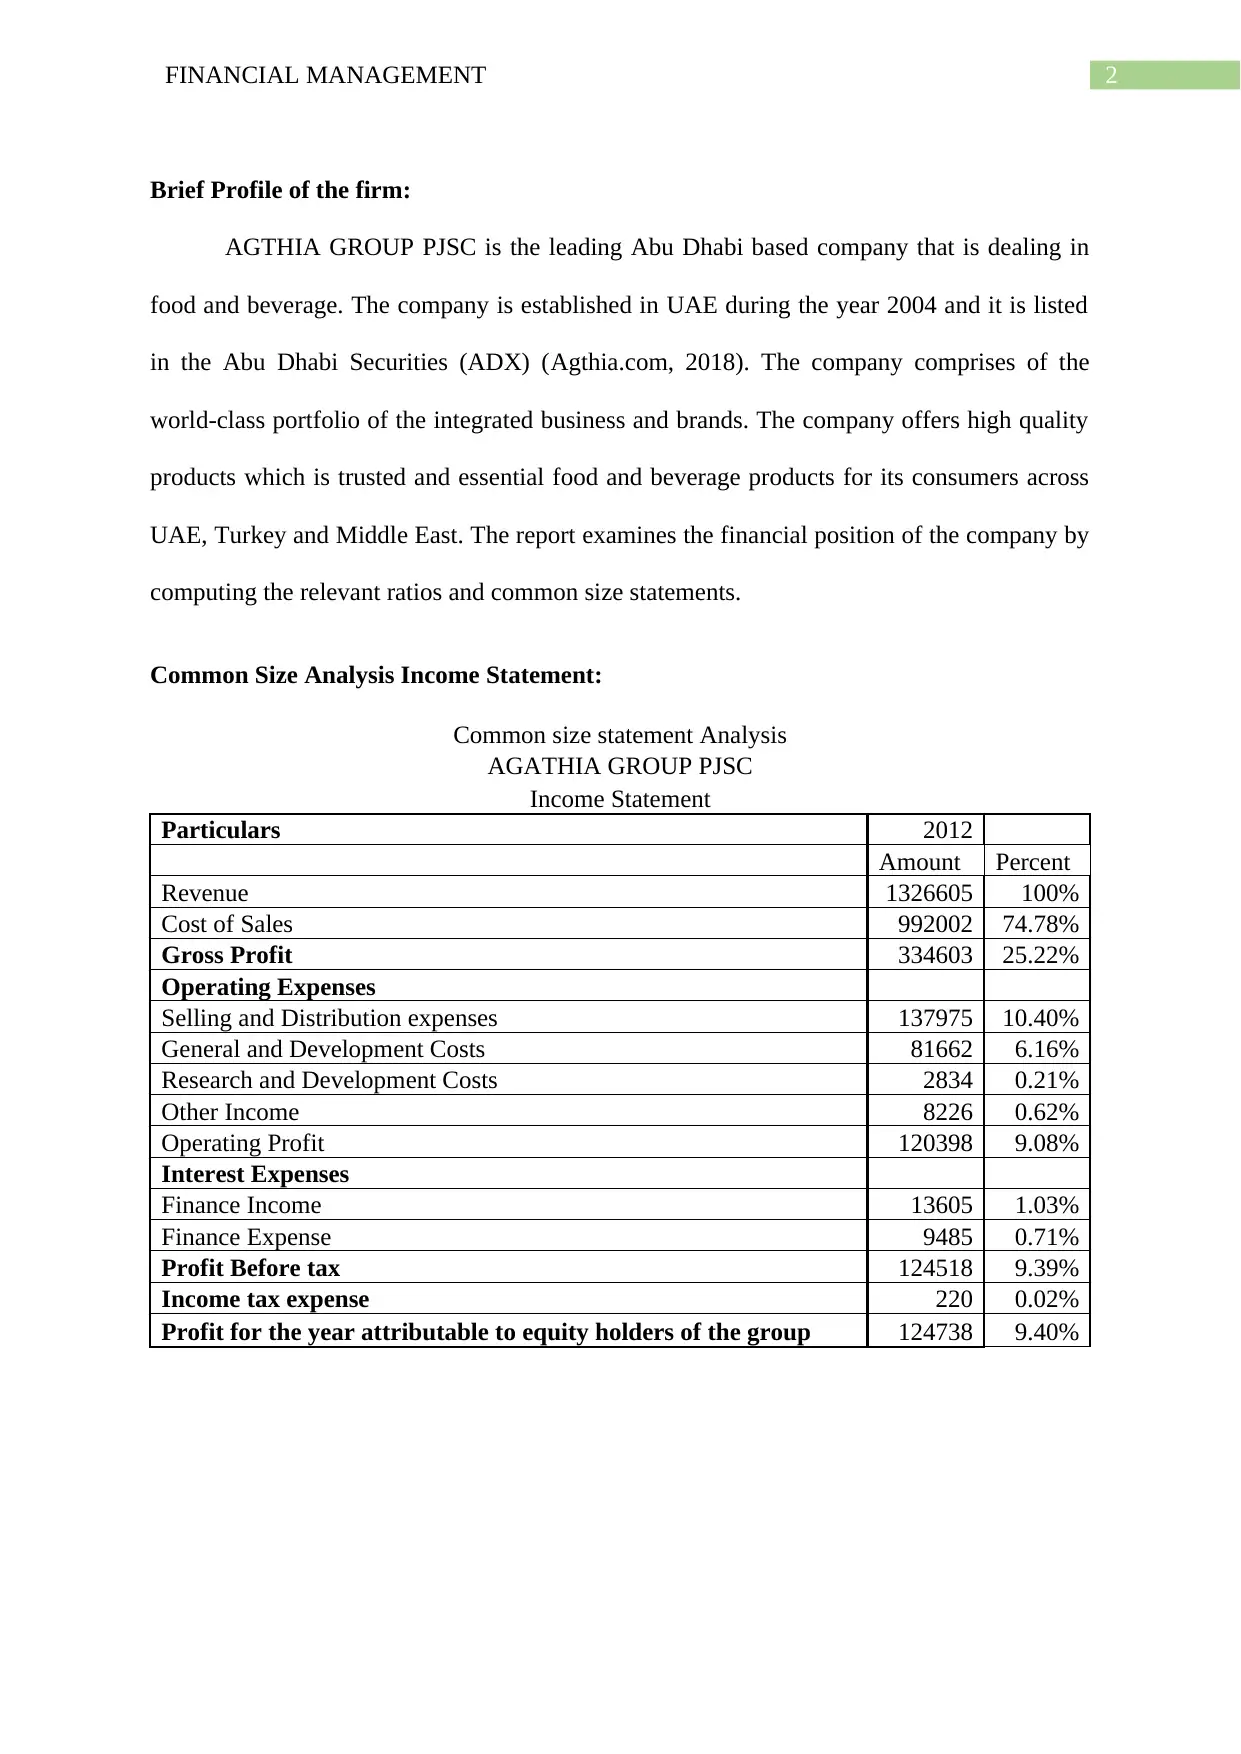
Brief Profile of the firm:
AGTHIA GROUP PJSC is the leading Abu Dhabi based company that is dealing in
food and beverage. The company is established in UAE during the year 2004 and it is listed
in the Abu Dhabi Securities (ADX) (Agthia.com, 2018). The company comprises of the
world-class portfolio of the integrated business and brands. The company offers high quality
products which is trusted and essential food and beverage products for its consumers across
UAE, Turkey and Middle East. The report examines the financial position of the company by
computing the relevant ratios and common size statements.
Common Size Analysis Income Statement:
Common size statement Analysis
AGATHIA GROUP PJSC
Income Statement
Particulars 2012
Amount Percent
Revenue 1326605 100%
Cost of Sales 992002 74.78%
Gross Profit 334603 25.22%
Operating Expenses
Selling and Distribution expenses 137975 10.40%
General and Development Costs 81662 6.16%
Research and Development Costs 2834 0.21%
Other Income 8226 0.62%
Operating Profit 120398 9.08%
Interest Expenses
Finance Income 13605 1.03%
Finance Expense 9485 0.71%
Profit Before tax 124518 9.39%
Income tax expense 220 0.02%
Profit for the year attributable to equity holders of the group 124738 9.40%
3FINANCIAL MANAGEMENT
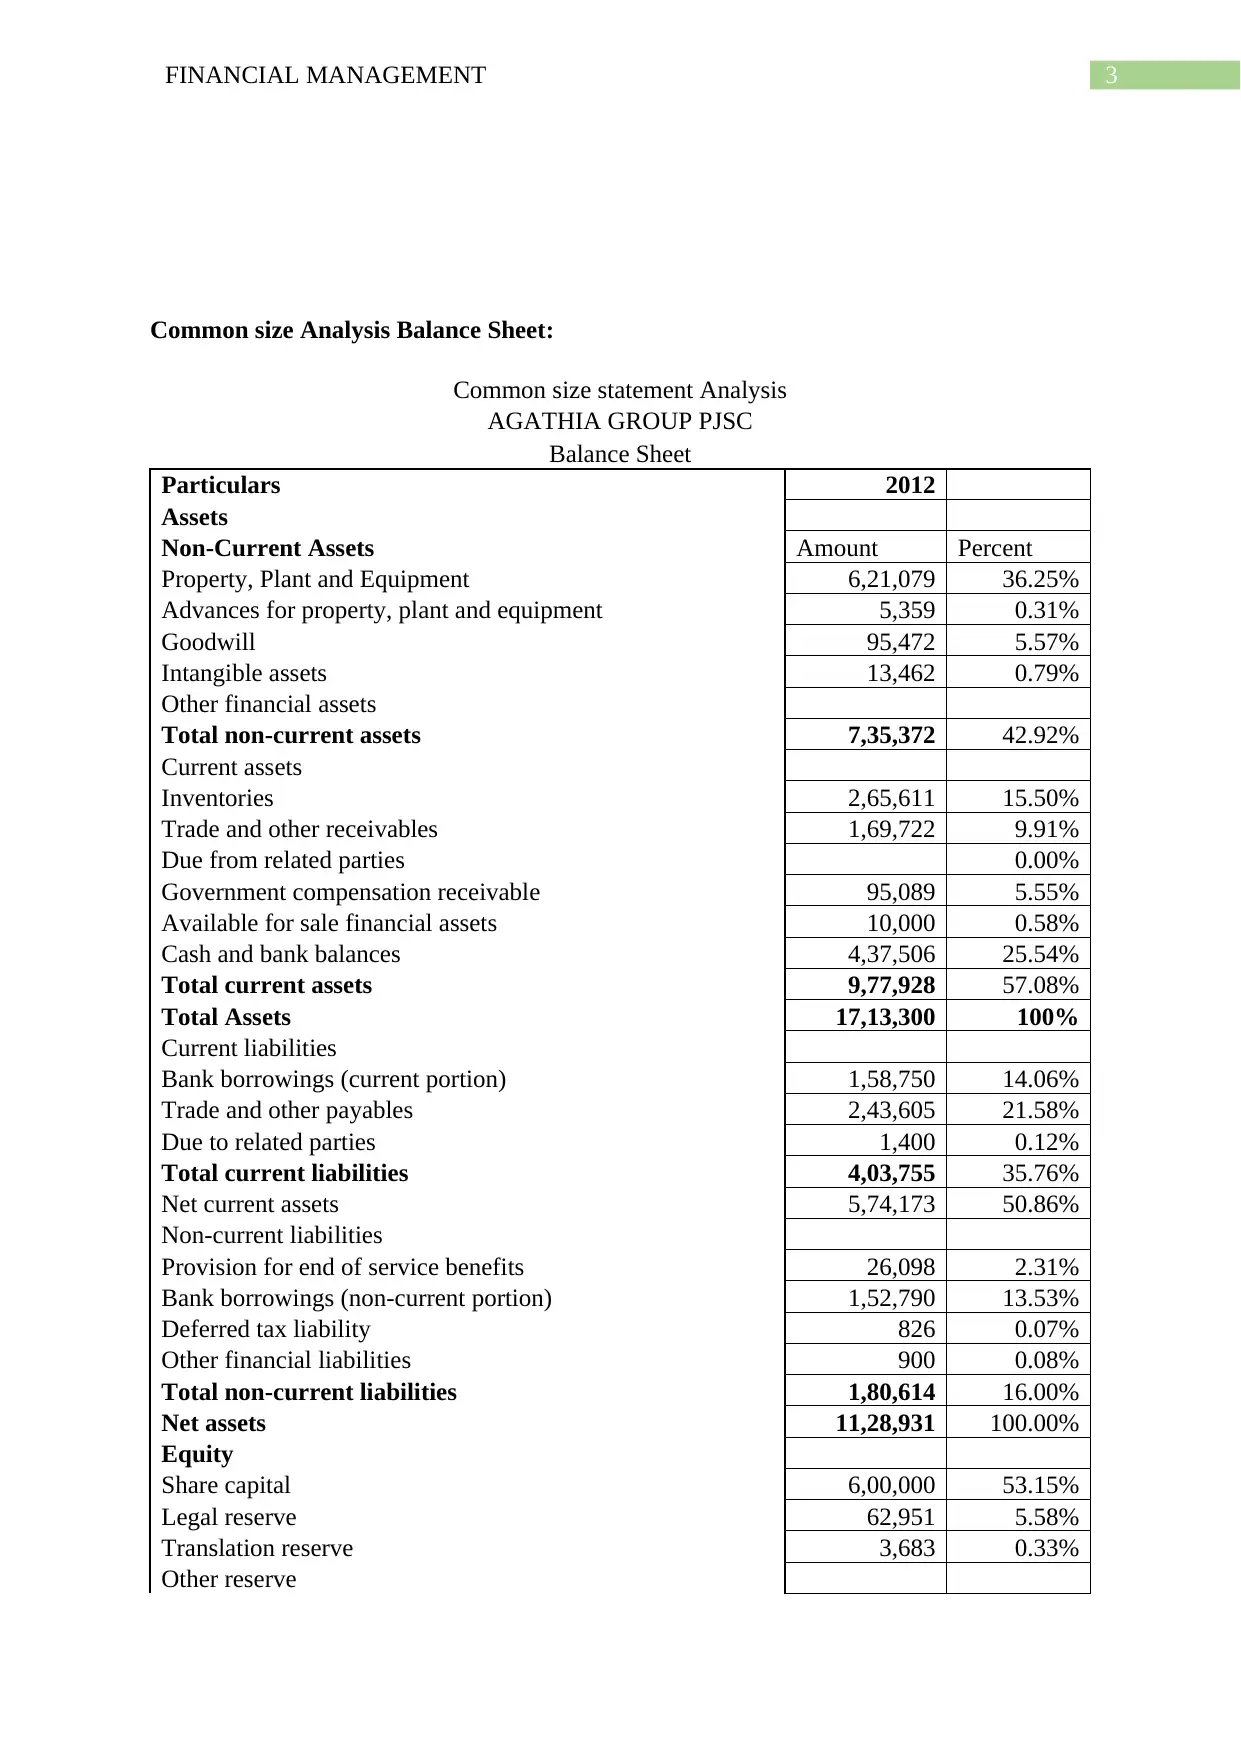
Common size Analysis Balance Sheet:
Common size statement Analysis
AGATHIA GROUP PJSC
Balance Sheet
Particulars 2012
Assets
Non-Current Assets Amount Percent
Property, Plant and Equipment 6,21,079 36.25%
Advances for property, plant and equipment 5,359 0.31%
Goodwill 95,472 5.57%
Intangible assets 13,462 0.79%
Other financial assets
Total non-current assets 7,35,372 42.92%
Current assets
Inventories 2,65,611 15.50%
Trade and other receivables 1,69,722 9.91%
Due from related parties 0.00%
Government compensation receivable 95,089 5.55%
Available for sale financial assets 10,000 0.58%
Cash and bank balances 4,37,506 25.54%
Total current assets 9,77,928 57.08%
Total Assets 17,13,300 100%
Current liabilities
Bank borrowings (current portion) 1,58,750 14.06%
Trade and other payables 2,43,605 21.58%
Due to related parties 1,400 0.12%
Total current liabilities 4,03,755 35.76%
Net current assets 5,74,173 50.86%
Non-current liabilities
Provision for end of service benefits 26,098 2.31%
Bank borrowings (non-current portion) 1,52,790 13.53%
Deferred tax liability 826 0.07%
Other financial liabilities 900 0.08%
Total non-current liabilities 1,80,614 16.00%
Net assets 11,28,931 100.00%
Equity
Share capital 6,00,000 53.15%
Legal reserve 62,951 5.58%
Translation reserve 3,683 0.33%
Other reserve
Secure Best Marks with AI Grader
Need help grading? Try our AI Grader for instant feedback on your assignments.
4FINANCIAL MANAGEMENT
Retained earnings 4,69,663 41.60%
Total equity 11,28,931 100%
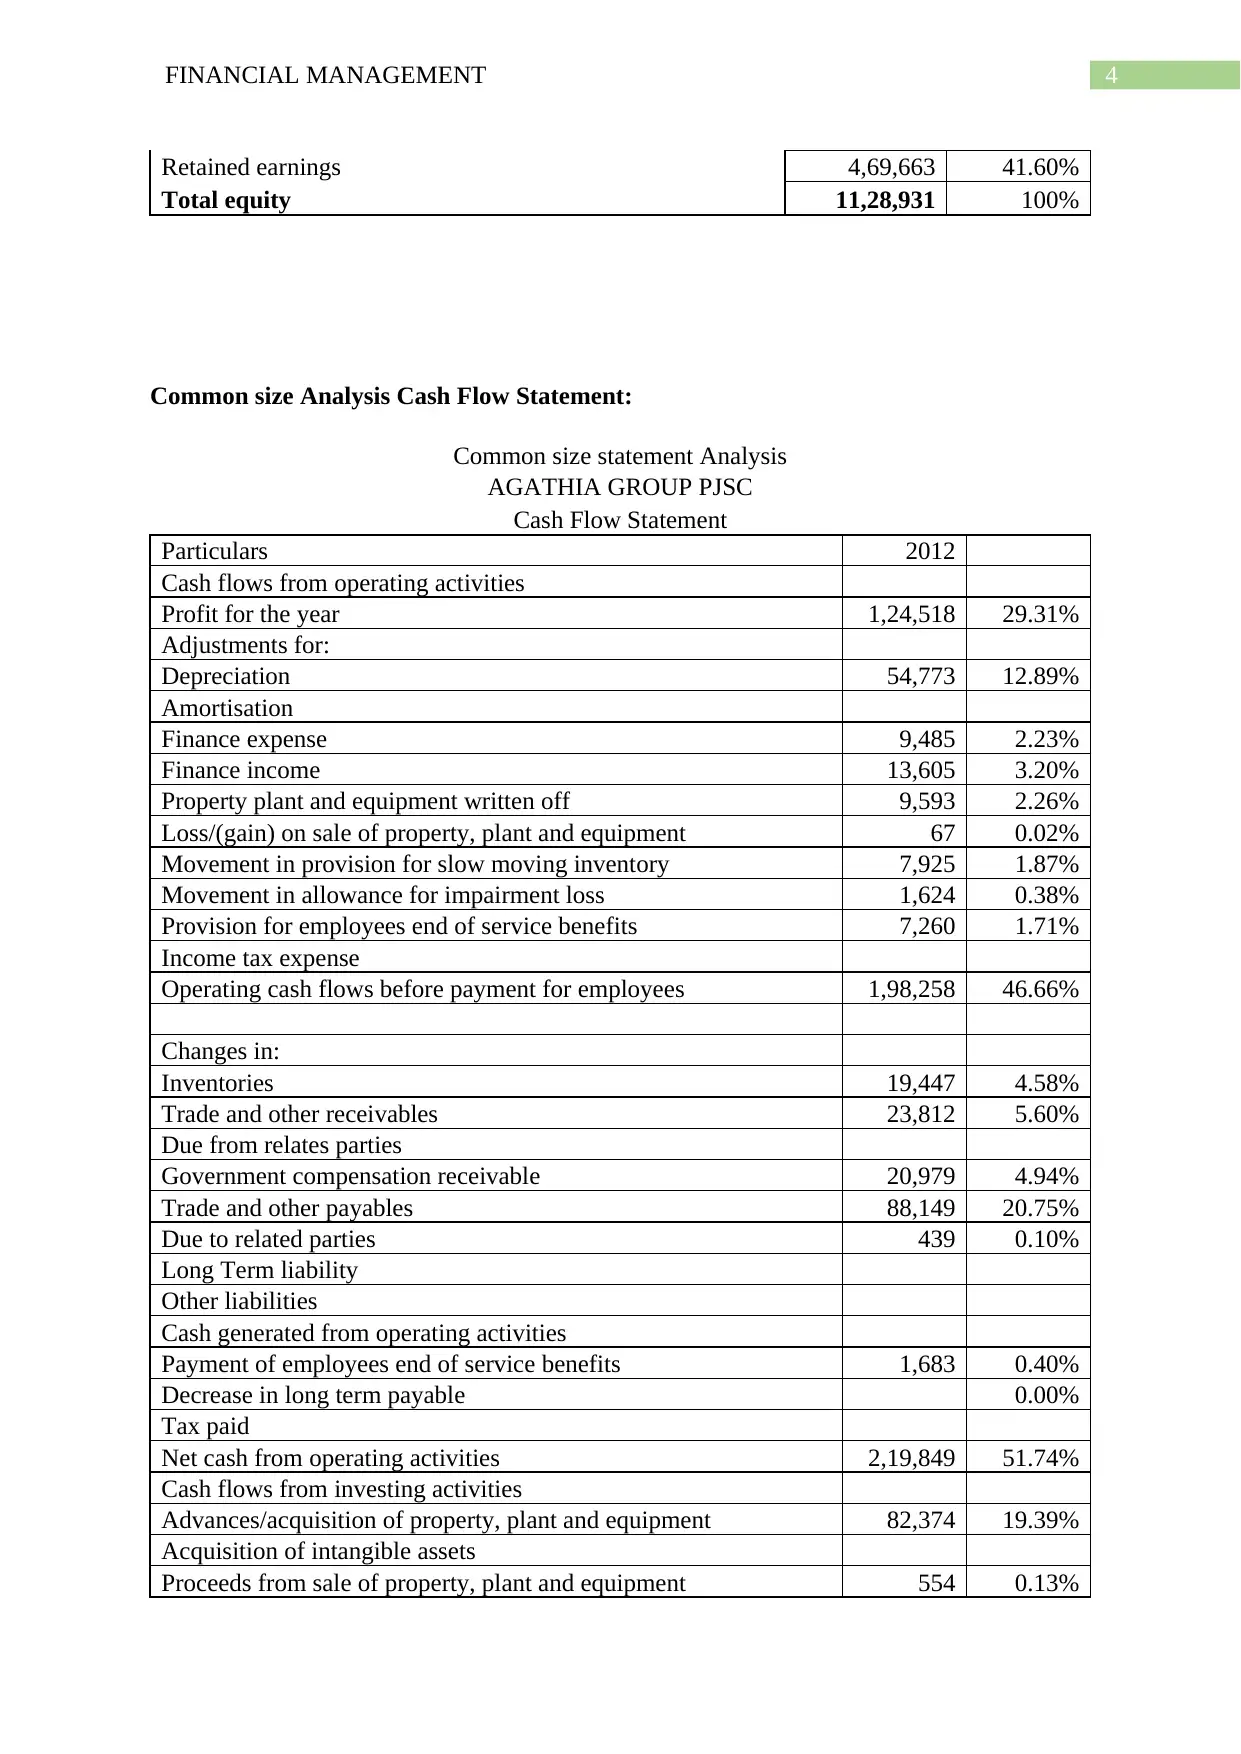
Common size Analysis Cash Flow Statement:
Common size statement Analysis
AGATHIA GROUP PJSC
Cash Flow Statement
Particulars 2012
Cash flows from operating activities
Profit for the year 1,24,518 29.31%
Adjustments for:
Depreciation 54,773 12.89%
Amortisation
Finance expense 9,485 2.23%
Finance income 13,605 3.20%
Property plant and equipment written off 9,593 2.26%
Loss/(gain) on sale of property, plant and equipment 67 0.02%
Movement in provision for slow moving inventory 7,925 1.87%
Movement in allowance for impairment loss 1,624 0.38%
Provision for employees end of service benefits 7,260 1.71%
Income tax expense
Operating cash flows before payment for employees 1,98,258 46.66%
Changes in:
Inventories 19,447 4.58%
Trade and other receivables 23,812 5.60%
Due from relates parties
Government compensation receivable 20,979 4.94%
Trade and other payables 88,149 20.75%
Due to related parties 439 0.10%
Long Term liability
Other liabilities
Cash generated from operating activities
Payment of employees end of service benefits 1,683 0.40%
Decrease in long term payable 0.00%
Tax paid
Net cash from operating activities 2,19,849 51.74%
Cash flows from investing activities
Advances/acquisition of property, plant and equipment 82,374 19.39%
Acquisition of intangible assets
Proceeds from sale of property, plant and equipment 554 0.13%
Retained earnings 4,69,663 41.60%
Total equity 11,28,931 100%
Common size Analysis Cash Flow Statement:
Common size statement Analysis
AGATHIA GROUP PJSC
Cash Flow Statement
Particulars 2012
Cash flows from operating activities
Profit for the year 1,24,518 29.31%
Adjustments for:
Depreciation 54,773 12.89%
Amortisation
Finance expense 9,485 2.23%
Finance income 13,605 3.20%
Property plant and equipment written off 9,593 2.26%
Loss/(gain) on sale of property, plant and equipment 67 0.02%
Movement in provision for slow moving inventory 7,925 1.87%
Movement in allowance for impairment loss 1,624 0.38%
Provision for employees end of service benefits 7,260 1.71%
Income tax expense
Operating cash flows before payment for employees 1,98,258 46.66%
Changes in:
Inventories 19,447 4.58%
Trade and other receivables 23,812 5.60%
Due from relates parties
Government compensation receivable 20,979 4.94%
Trade and other payables 88,149 20.75%
Due to related parties 439 0.10%
Long Term liability
Other liabilities
Cash generated from operating activities
Payment of employees end of service benefits 1,683 0.40%
Decrease in long term payable 0.00%
Tax paid
Net cash from operating activities 2,19,849 51.74%
Cash flows from investing activities
Advances/acquisition of property, plant and equipment 82,374 19.39%
Acquisition of intangible assets
Proceeds from sale of property, plant and equipment 554 0.13%
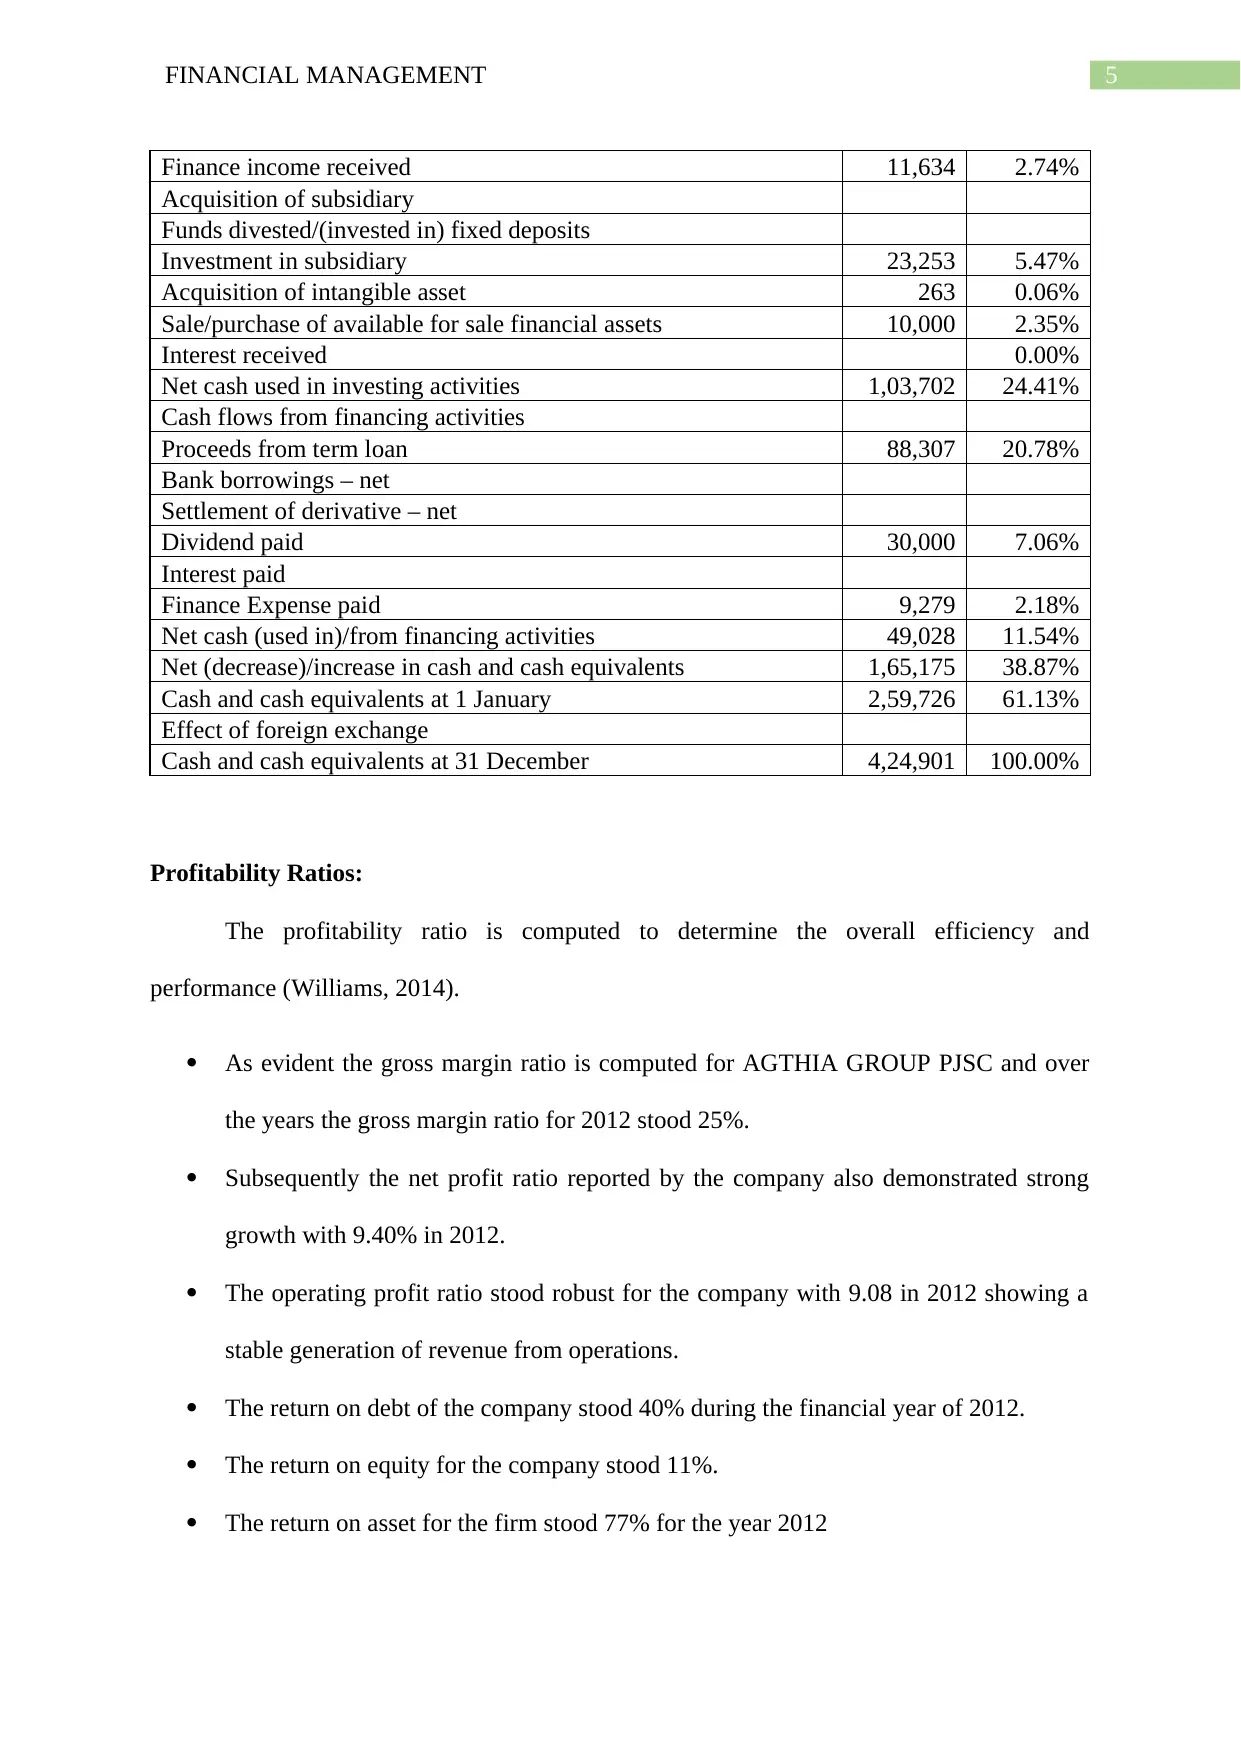
5FINANCIAL MANAGEMENT
Finance income received 11,634 2.74%
Acquisition of subsidiary
Funds divested/(invested in) fixed deposits
Investment in subsidiary 23,253 5.47%
Acquisition of intangible asset 263 0.06%
Sale/purchase of available for sale financial assets 10,000 2.35%
Interest received 0.00%
Net cash used in investing activities 1,03,702 24.41%
Cash flows from financing activities
Proceeds from term loan 88,307 20.78%
Bank borrowings – net
Settlement of derivative – net
Dividend paid 30,000 7.06%
Interest paid
Finance Expense paid 9,279 2.18%
Net cash (used in)/from financing activities 49,028 11.54%
Net (decrease)/increase in cash and cash equivalents 1,65,175 38.87%
Cash and cash equivalents at 1 January 2,59,726 61.13%
Effect of foreign exchange
Cash and cash equivalents at 31 December 4,24,901 100.00%
Profitability Ratios:
The profitability ratio is computed to determine the overall efficiency and
performance (Williams, 2014).
As evident the gross margin ratio is computed for AGTHIA GROUP PJSC and over
the years the gross margin ratio for 2012 stood 25%.
Subsequently the net profit ratio reported by the company also demonstrated strong
growth with 9.40% in 2012.
The operating profit ratio stood robust for the company with 9.08 in 2012 showing a
stable generation of revenue from operations.
The return on debt of the company stood 40% during the financial year of 2012.
The return on equity for the company stood 11%.
The return on asset for the firm stood 77% for the year 2012
6FINANCIAL MANAGEMENT
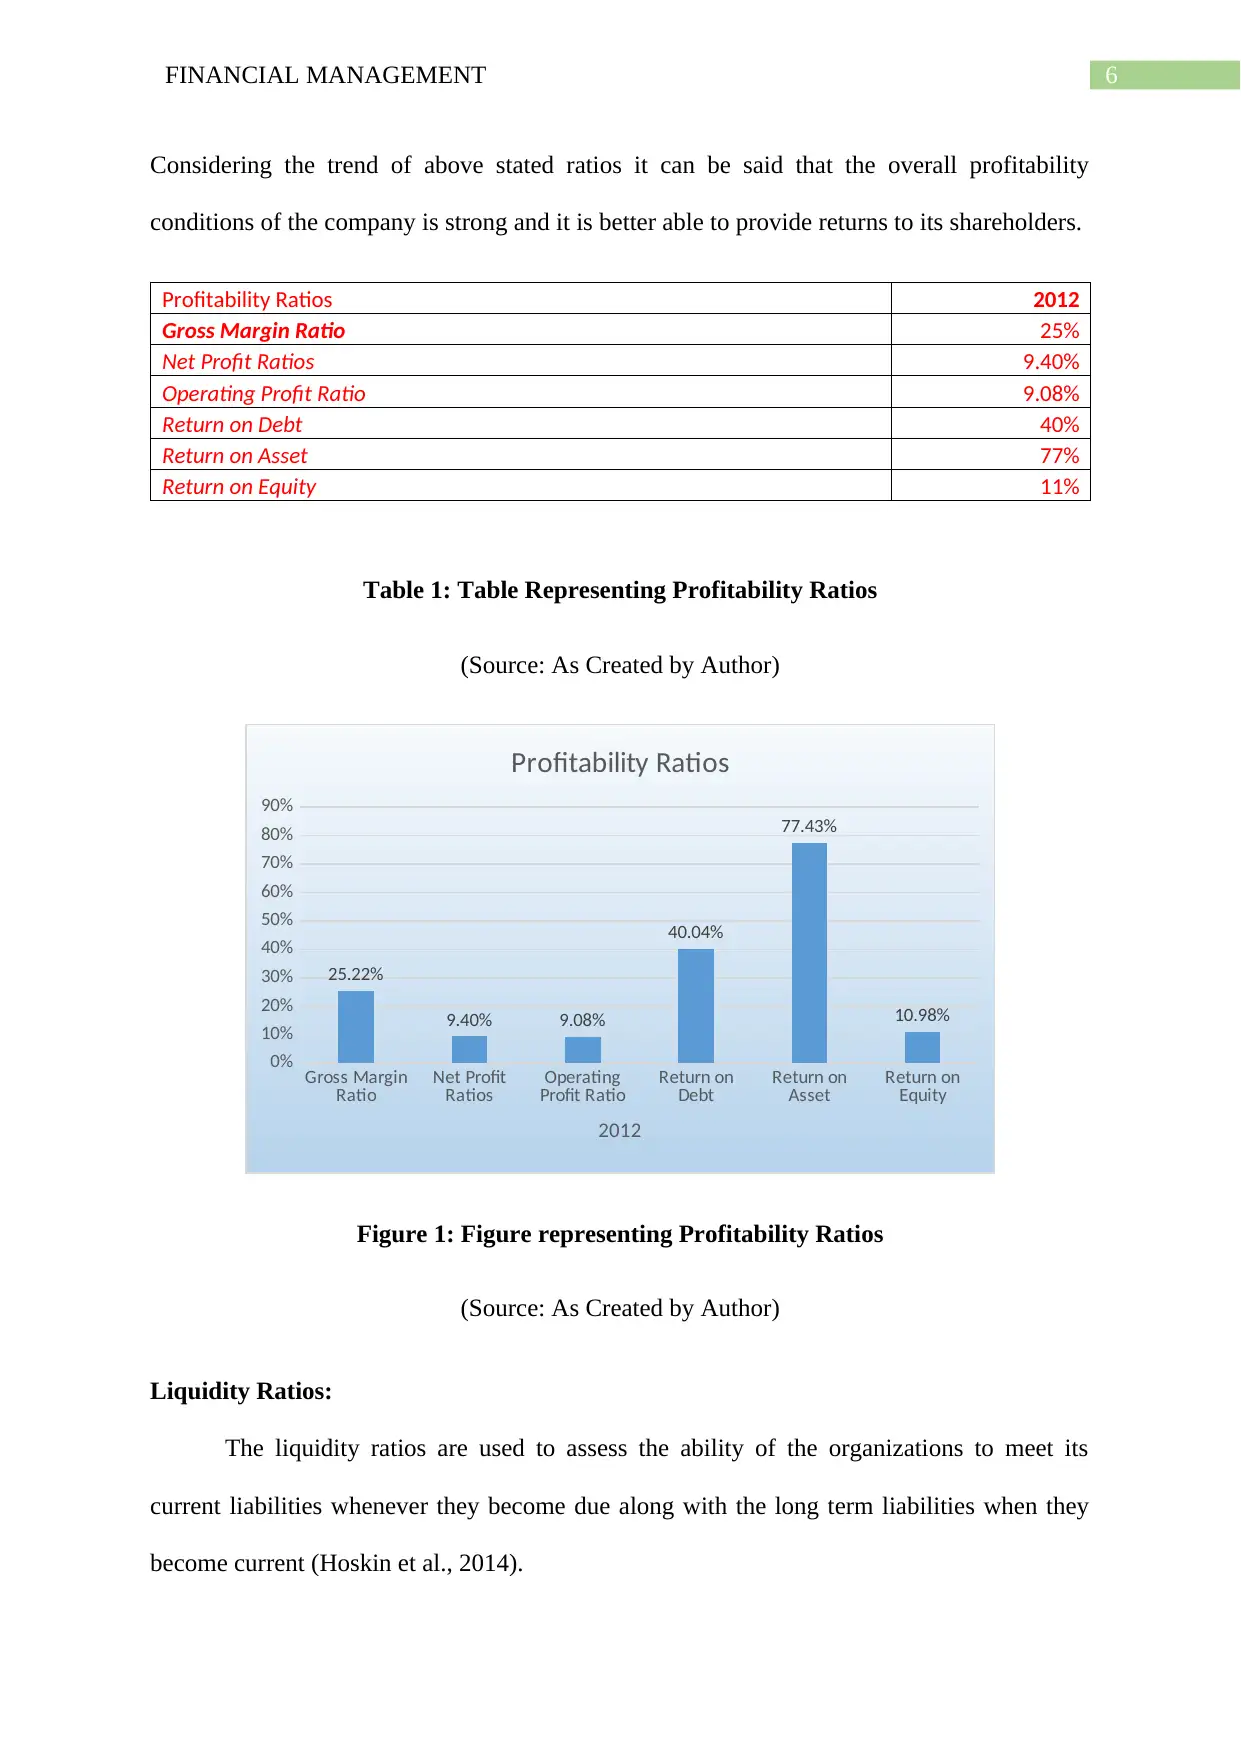
Considering the trend of above stated ratios it can be said that the overall profitability
conditions of the company is strong and it is better able to provide returns to its shareholders.
Profitability Ratios 2012
Gross Margin Ratio 25%
Net Profit Ratios 9.40%
Operating Profit Ratio 9.08%
Return on Debt 40%
Return on Asset 77%
Return on Equity 11%
Table 1: Table Representing Profitability Ratios
(Source: As Created by Author)
Gross Margin
Ratio Net Profit
Ratios Operating
Profit Ratio Return on
Debt Return on
Asset Return on
Equity
0%
10%
20%
30%
40%
50%
60%
70%
80%
90%
25.22%
9.40% 9.08%
40.04%
77.43%
10.98%
Profitability Ratios
2012
Figure 1: Figure representing Profitability Ratios
(Source: As Created by Author)
Liquidity Ratios:
The liquidity ratios are used to assess the ability of the organizations to meet its
current liabilities whenever they become due along with the long term liabilities when they
become current (Hoskin et al., 2014).
Paraphrase This Document
Need a fresh take? Get an instant paraphrase of this document with our AI Paraphraser
7FINANCIAL MANAGEMENT
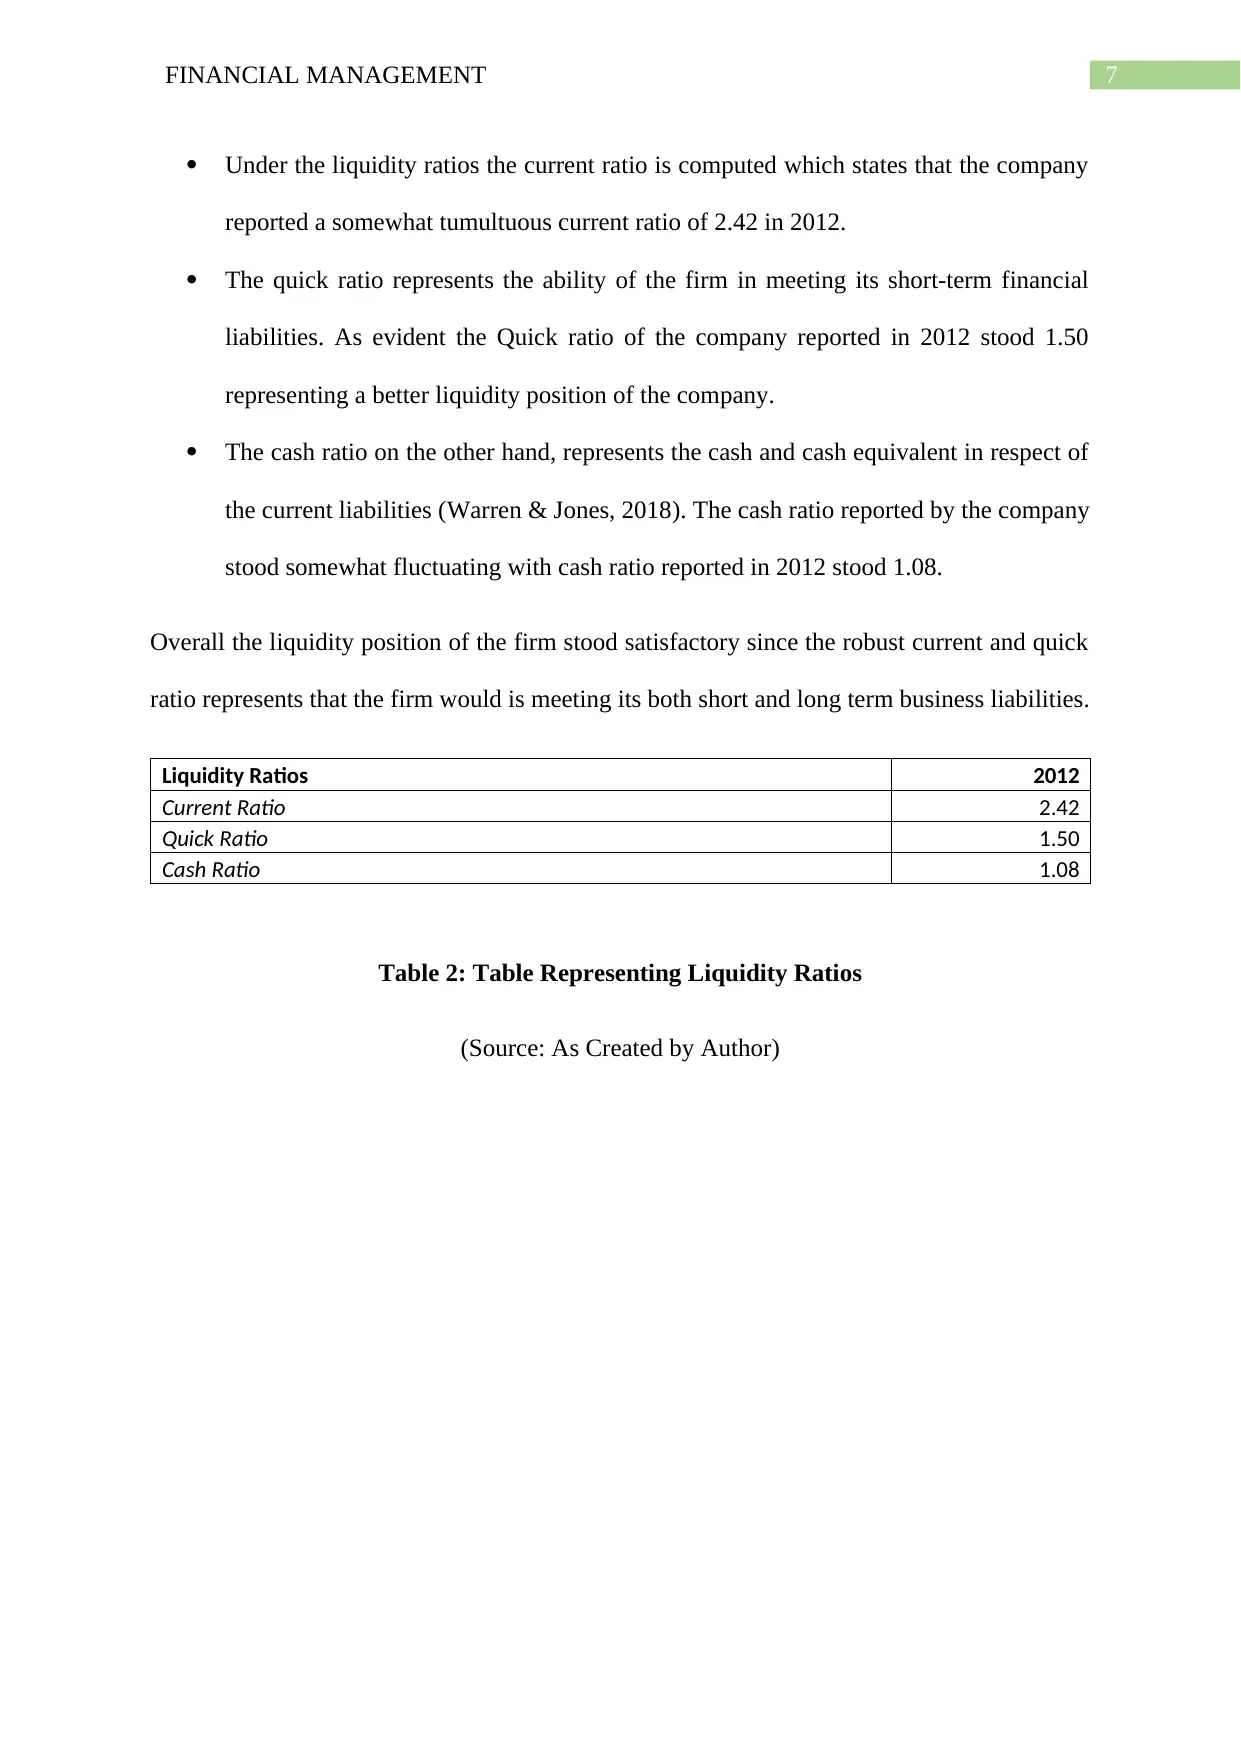
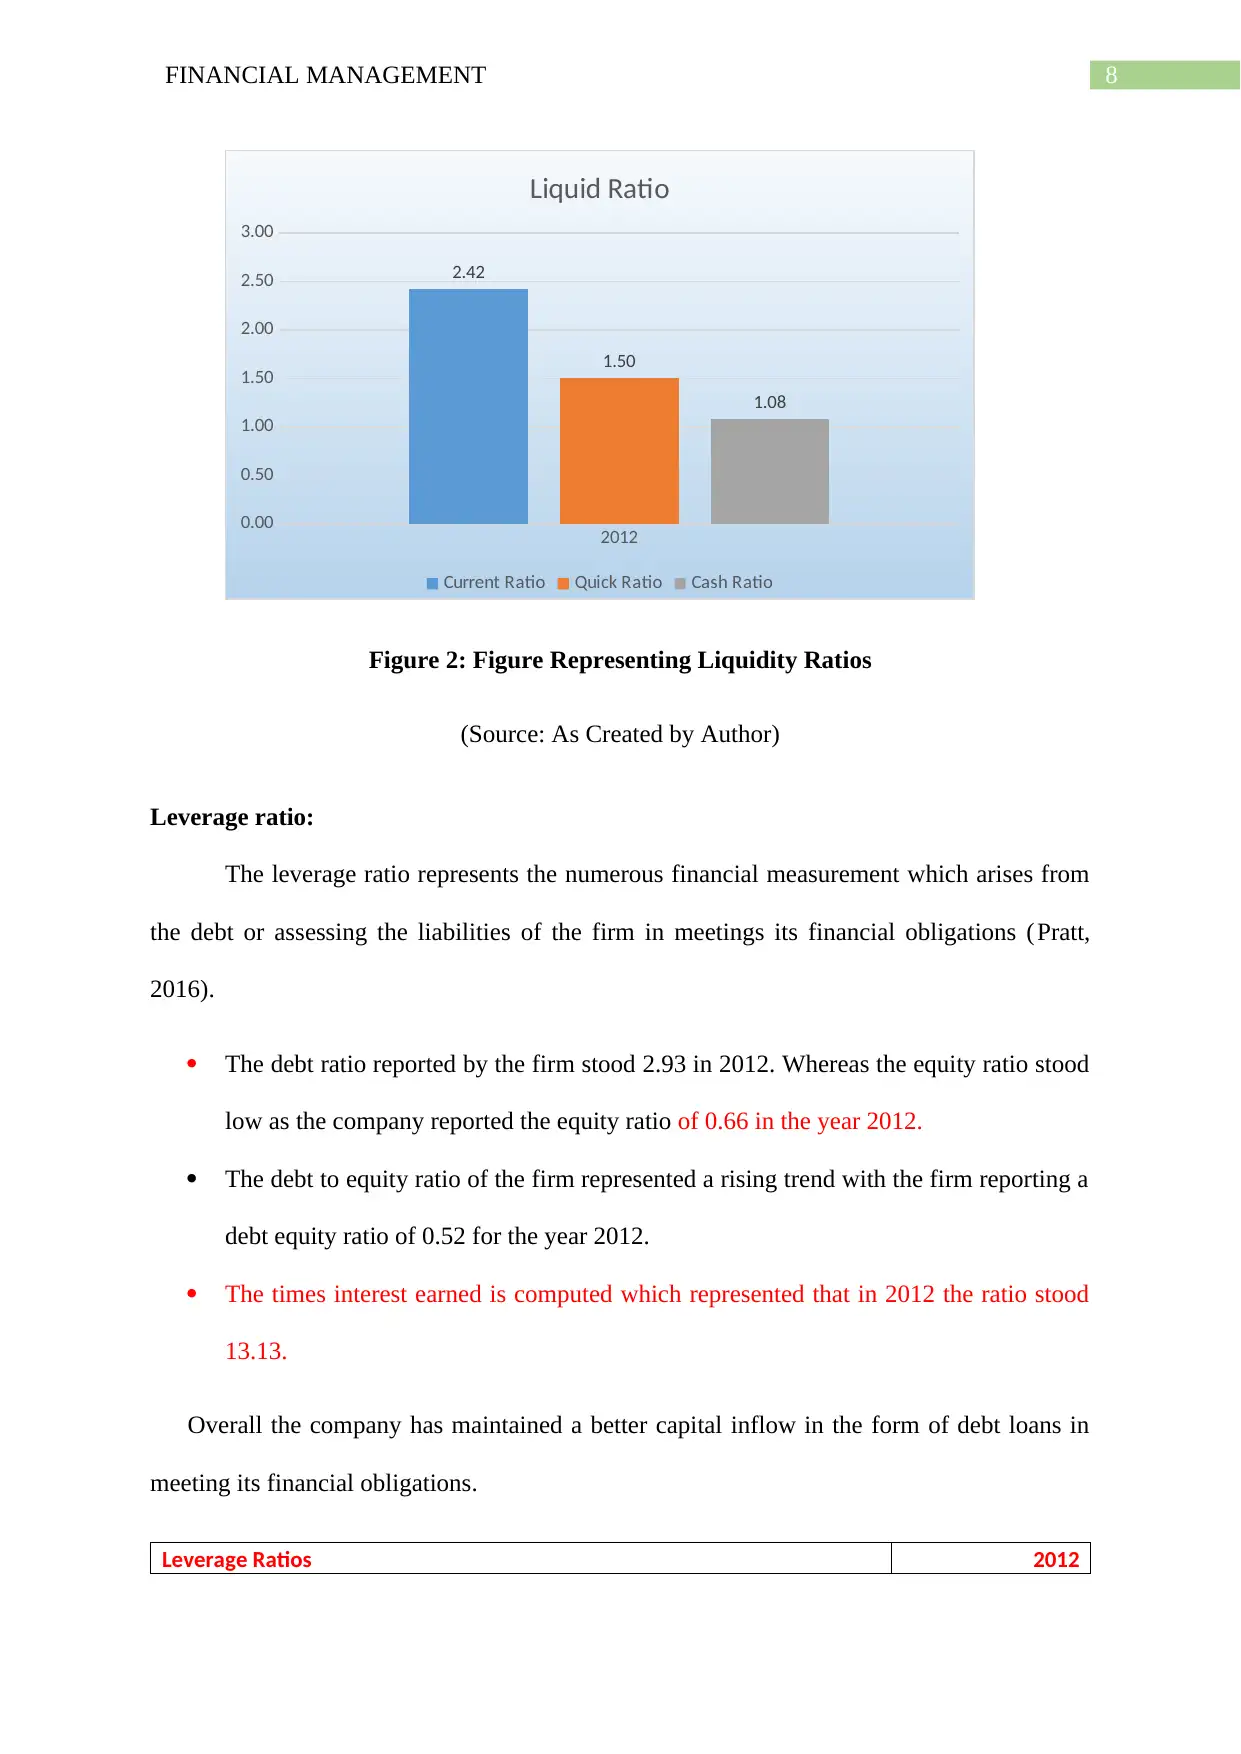
Under the liquidity ratios the current ratio is computed which states that the company
reported a somewhat tumultuous current ratio of 2.42 in 2012.
The quick ratio represents the ability of the firm in meeting its short-term financial
liabilities. As evident the Quick ratio of the company reported in 2012 stood 1.50
representing a better liquidity position of the company.
The cash ratio on the other hand, represents the cash and cash equivalent in respect of
the current liabilities (Warren & Jones, 2018). The cash ratio reported by the company
stood somewhat fluctuating with cash ratio reported in 2012 stood 1.08.
Overall the liquidity position of the firm stood satisfactory since the robust current and quick
ratio represents that the firm would is meeting its both short and long term business liabilities.
Liquidity Ratios 2012
Current Ratio 2.42
Quick Ratio 1.50
Cash Ratio 1.08
Table 2: Table Representing Liquidity Ratios
(Source: As Created by Author)
8FINANCIAL MANAGEMENT
2012
0.00
0.50
1.00
1.50
2.00
2.50
3.00
2.42
1.50
1.08
Liquid Ratio
Current Ratio Quick Ratio Cash Ratio
Figure 2: Figure Representing Liquidity Ratios
(Source: As Created by Author)
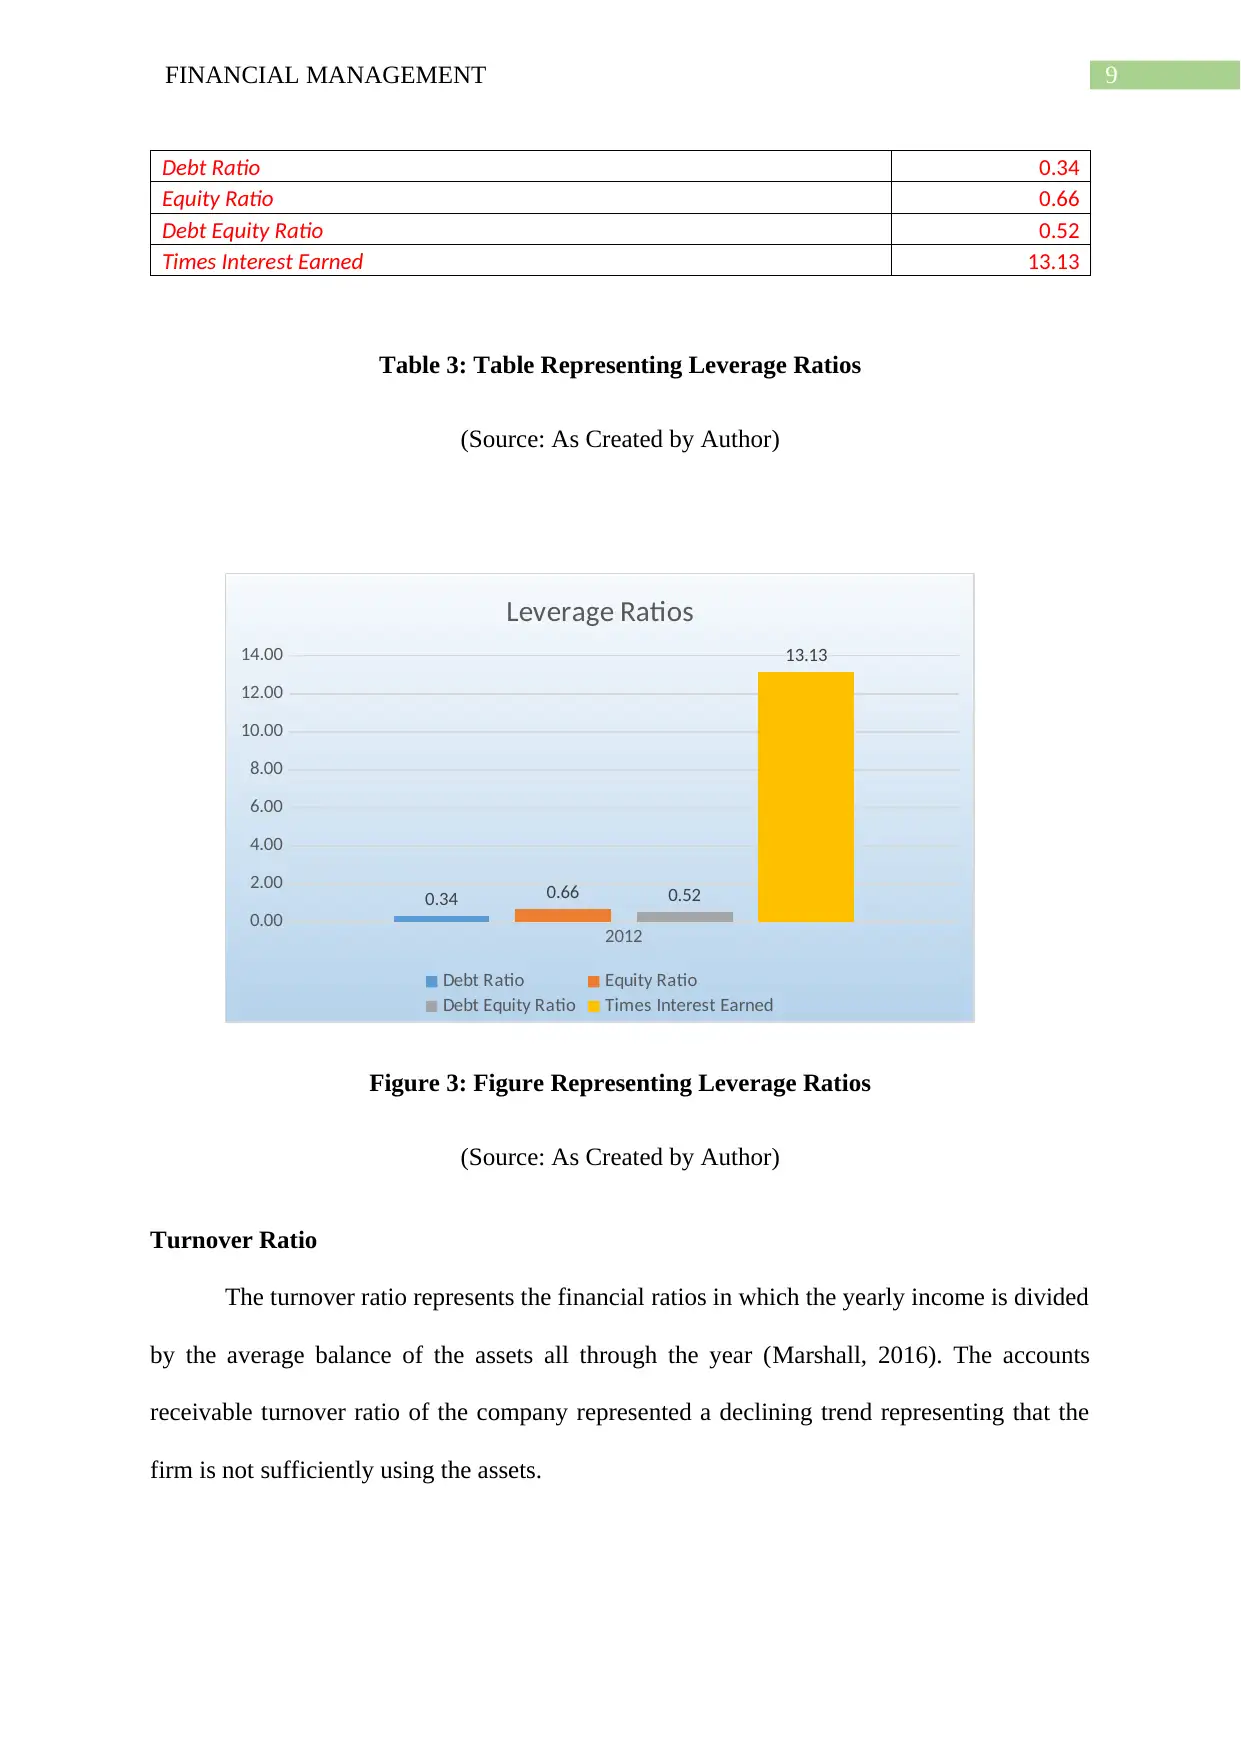
Leverage ratio:
The leverage ratio represents the numerous financial measurement which arises from
the debt or assessing the liabilities of the firm in meetings its financial obligations (Pratt,
2016).
The debt ratio reported by the firm stood 2.93 in 2012. Whereas the equity ratio stood
low as the company reported the equity ratio of 0.66 in the year 2012.
The debt to equity ratio of the firm represented a rising trend with the firm reporting a
debt equity ratio of 0.52 for the year 2012.
The times interest earned is computed which represented that in 2012 the ratio stood
13.13.
Overall the company has maintained a better capital inflow in the form of debt loans in
meeting its financial obligations.
Leverage Ratios 2012
2012
0.00
0.50
1.00
1.50
2.00
2.50
3.00
2.42
1.50
1.08
Liquid Ratio
Current Ratio Quick Ratio Cash Ratio
Figure 2: Figure Representing Liquidity Ratios
(Source: As Created by Author)
Leverage ratio:
The leverage ratio represents the numerous financial measurement which arises from
the debt or assessing the liabilities of the firm in meetings its financial obligations (Pratt,
2016).
The debt ratio reported by the firm stood 2.93 in 2012. Whereas the equity ratio stood
low as the company reported the equity ratio of 0.66 in the year 2012.
The debt to equity ratio of the firm represented a rising trend with the firm reporting a
debt equity ratio of 0.52 for the year 2012.
The times interest earned is computed which represented that in 2012 the ratio stood
13.13.
Overall the company has maintained a better capital inflow in the form of debt loans in
meeting its financial obligations.
Leverage Ratios 2012
9FINANCIAL MANAGEMENT
Debt Ratio 0.34
Equity Ratio 0.66
Debt Equity Ratio 0.52
Times Interest Earned 13.13
Table 3: Table Representing Leverage Ratios
(Source: As Created by Author)
2012
0.00
2.00
4.00
6.00
8.00
10.00
12.00
14.00
0.34 0.66 0.52
13.13
Leverage Ratios
Debt Ratio Equity Ratio
Debt Equity Ratio Times Interest Earned
Figure 3: Figure Representing Leverage Ratios
(Source: As Created by Author)
Turnover Ratio
The turnover ratio represents the financial ratios in which the yearly income is divided
by the average balance of the assets all through the year (Marshall, 2016). The accounts
receivable turnover ratio of the company represented a declining trend representing that the
firm is not sufficiently using the assets.
Secure Best Marks with AI Grader
Need help grading? Try our AI Grader for instant feedback on your assignments.
10FINANCIAL MANAGEMENT
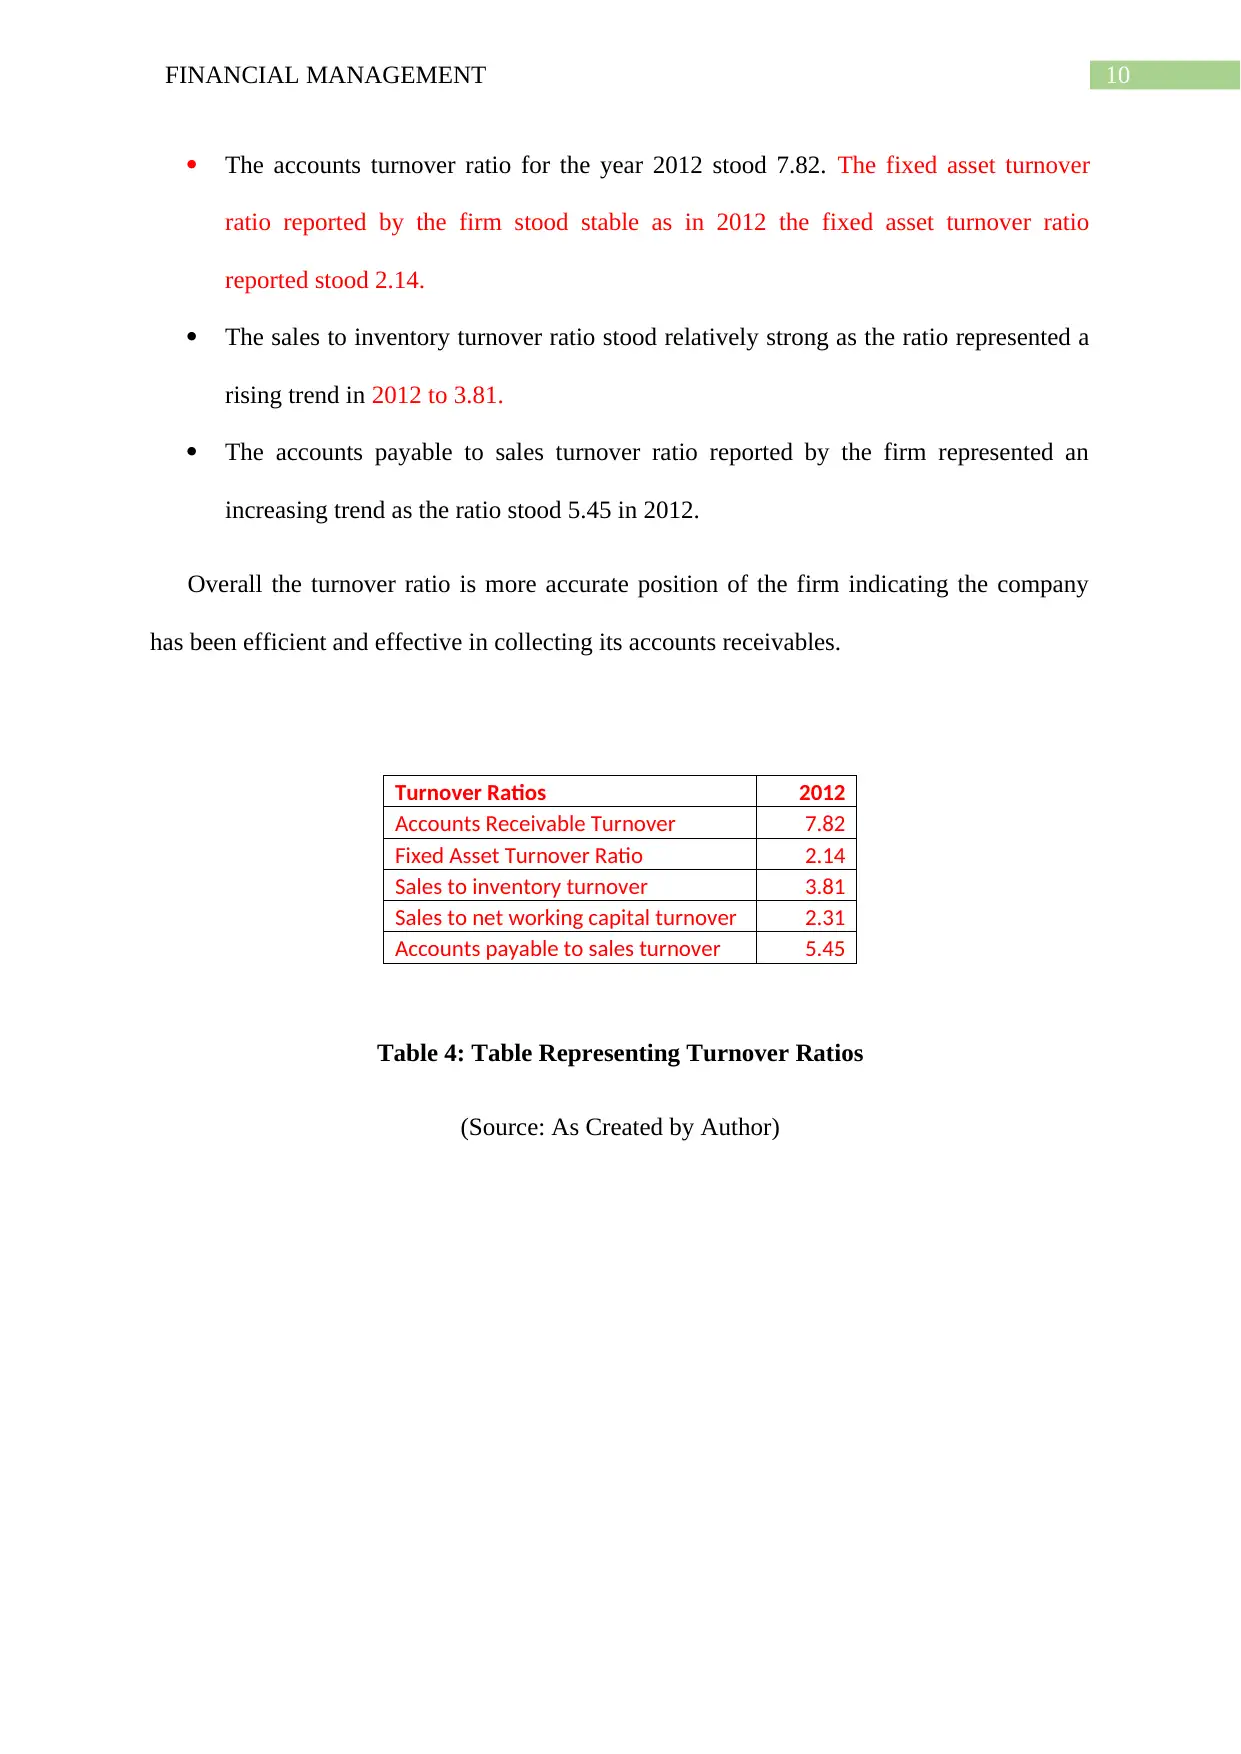
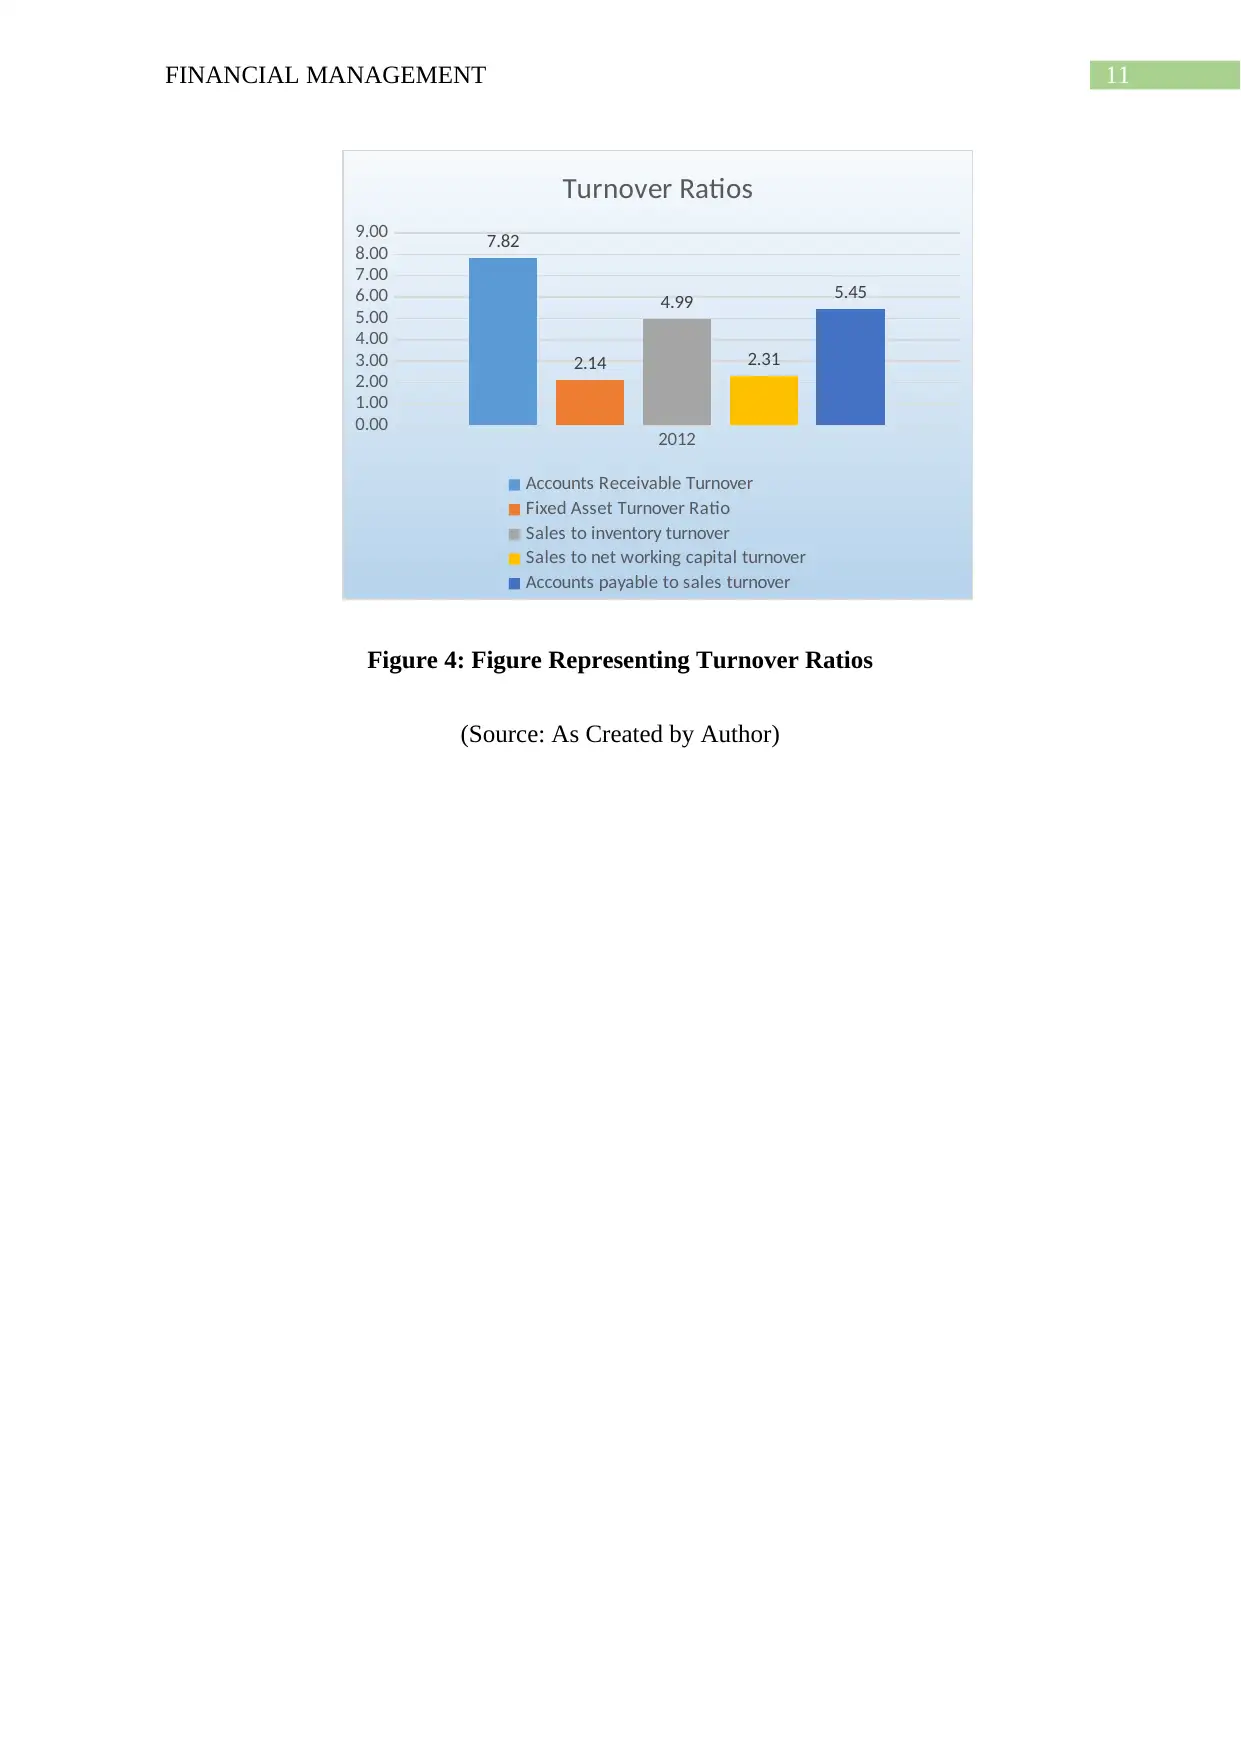
The accounts turnover ratio for the year 2012 stood 7.82. The fixed asset turnover
ratio reported by the firm stood stable as in 2012 the fixed asset turnover ratio
reported stood 2.14.
The sales to inventory turnover ratio stood relatively strong as the ratio represented a
rising trend in 2012 to 3.81.
The accounts payable to sales turnover ratio reported by the firm represented an
increasing trend as the ratio stood 5.45 in 2012.
Overall the turnover ratio is more accurate position of the firm indicating the company
has been efficient and effective in collecting its accounts receivables.
Turnover Ratios 2012
Accounts Receivable Turnover 7.82
Fixed Asset Turnover Ratio 2.14
Sales to inventory turnover 3.81
Sales to net working capital turnover 2.31
Accounts payable to sales turnover 5.45
Table 4: Table Representing Turnover Ratios
(Source: As Created by Author)
11FINANCIAL MANAGEMENT
2012
0.00
1.00
2.00
3.00
4.00
5.00
6.00
7.00
8.00
9.00 7.82
2.14
4.99
2.31
5.45
Turnover Ratios
Accounts Receivable Turnover
Fixed Asset Turnover Ratio
Sales to inventory turnover
Sales to net working capital turnover
Accounts payable to sales turnover
Figure 4: Figure Representing Turnover Ratios
(Source: As Created by Author)
12FINANCIAL MANAGEMENT
Reference List:
Agthia > Home. (2018). Agthia.com. Retrieved 4 January 2018, from http://agthia.com/en-us/
Agthia > Investors > Results & Presentations > Results Call Materials. (2018). Agthia.com.
Retrieved 4 January 2018, from http://agthia.com/en-us/Investors/Results-
Presentations/Results-Call-Materials
Hoskin, R. E., Fizzell, M. R., & Cherry, D. C. (2014). Financial Accounting: a user
perspective. Wiley Global Education.
Marshall, D. (2016). Accounting: What the numbers mean. McGraw-Hill Higher Education.
Pratt, J. (2016). Financial accounting in an economic context. John Wiley & Sons.
PricewaterhouseCoopers, L. L. P., & Accounting, F. (2015). Mary Brooke Billings. The
Accounting Review, 83(3), 665-704.
Warren, C. S., & Jones, J. (2018). Corporate financial accounting. Cengage Learning.
Williams, J. (2014). Financial accounting. McGraw-Hill Higher Education.
1 out of 13
Related Documents


Your All-in-One AI-Powered Toolkit for Academic Success.
+13062052269
info@desklib.com
Available 24*7 on WhatsApp / Email
![[object Object]](/_next/static/media/star-bottom.7253800d.svg)
Unlock your academic potential
© 2024 | Zucol Services PVT LTD | All rights reserved.