Financial Management: Financial Ratio Analysis of Wizard Industries

Verified

Added on  2021/09/16

|8
|1703
|119
Report
AI Summary
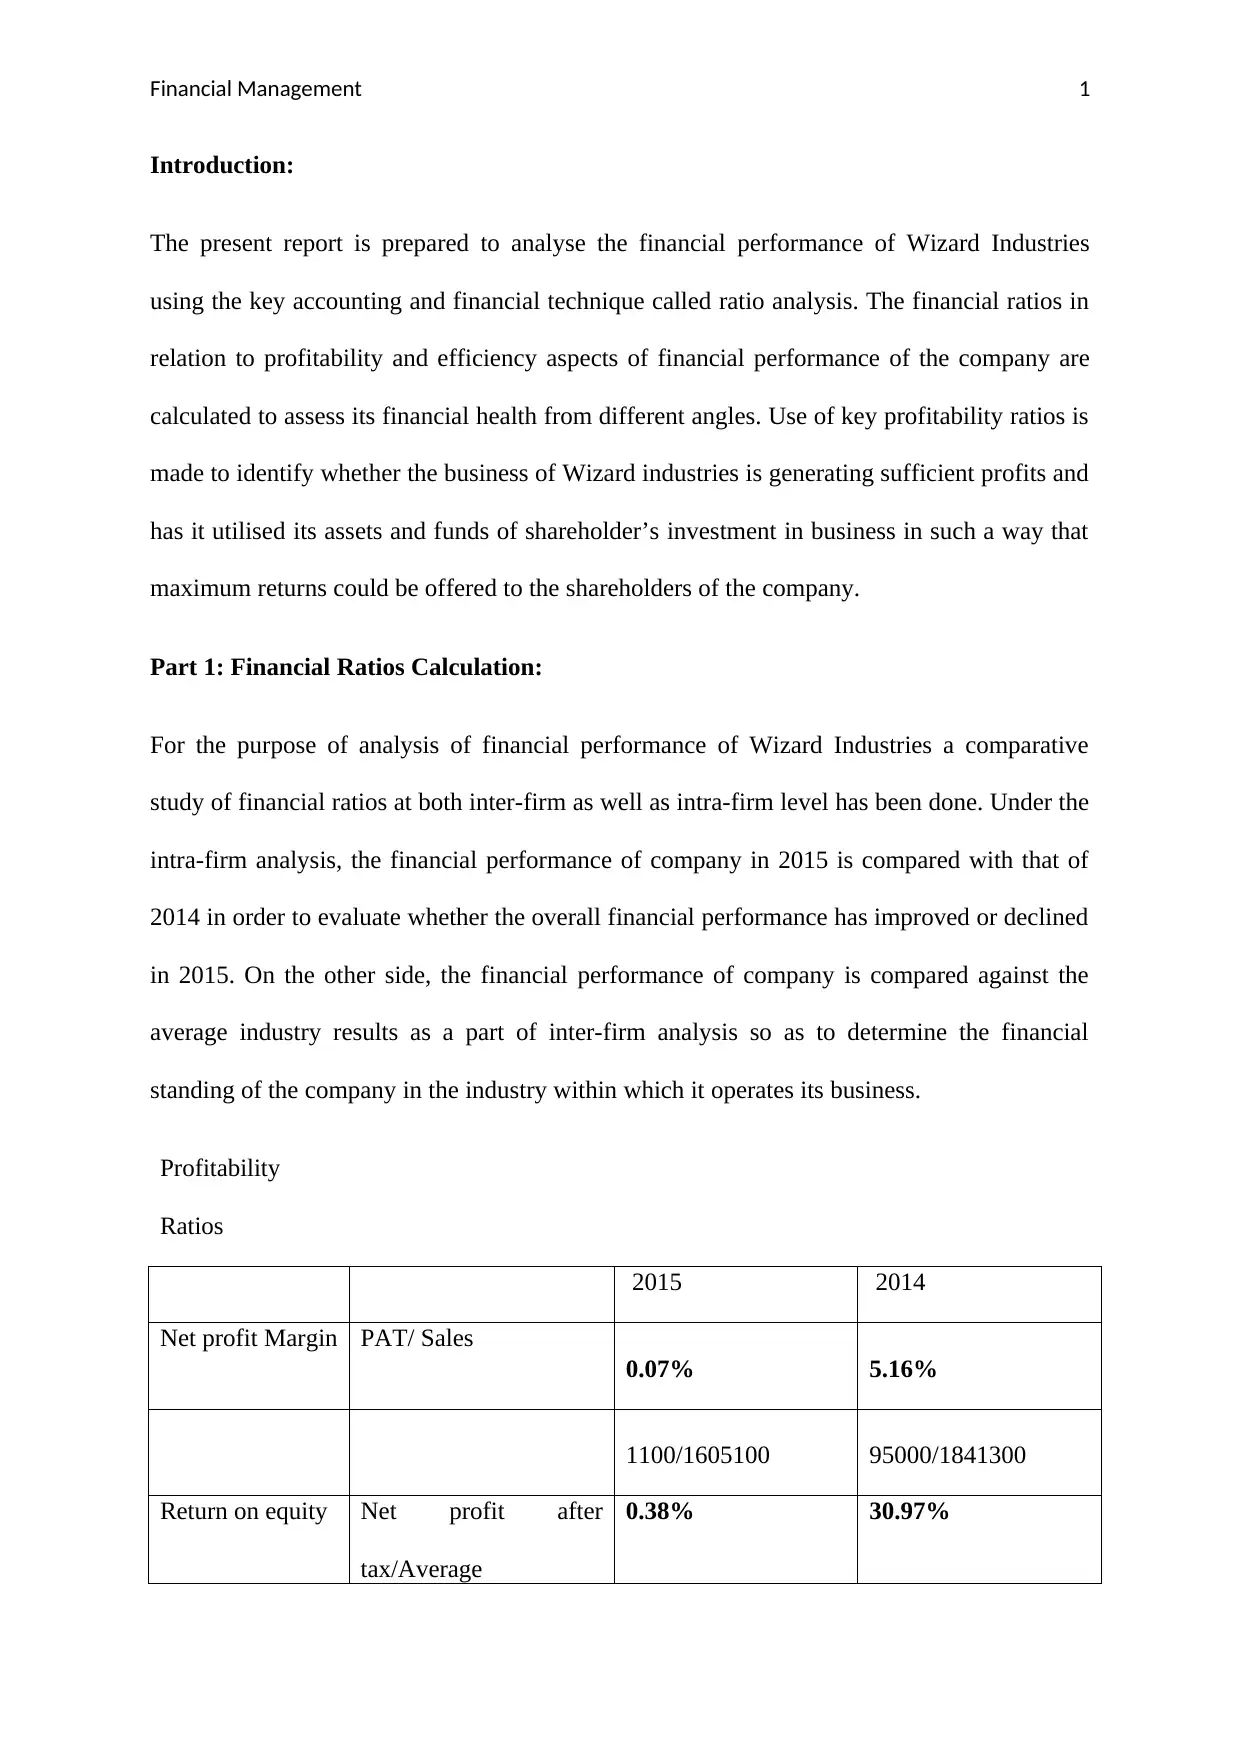
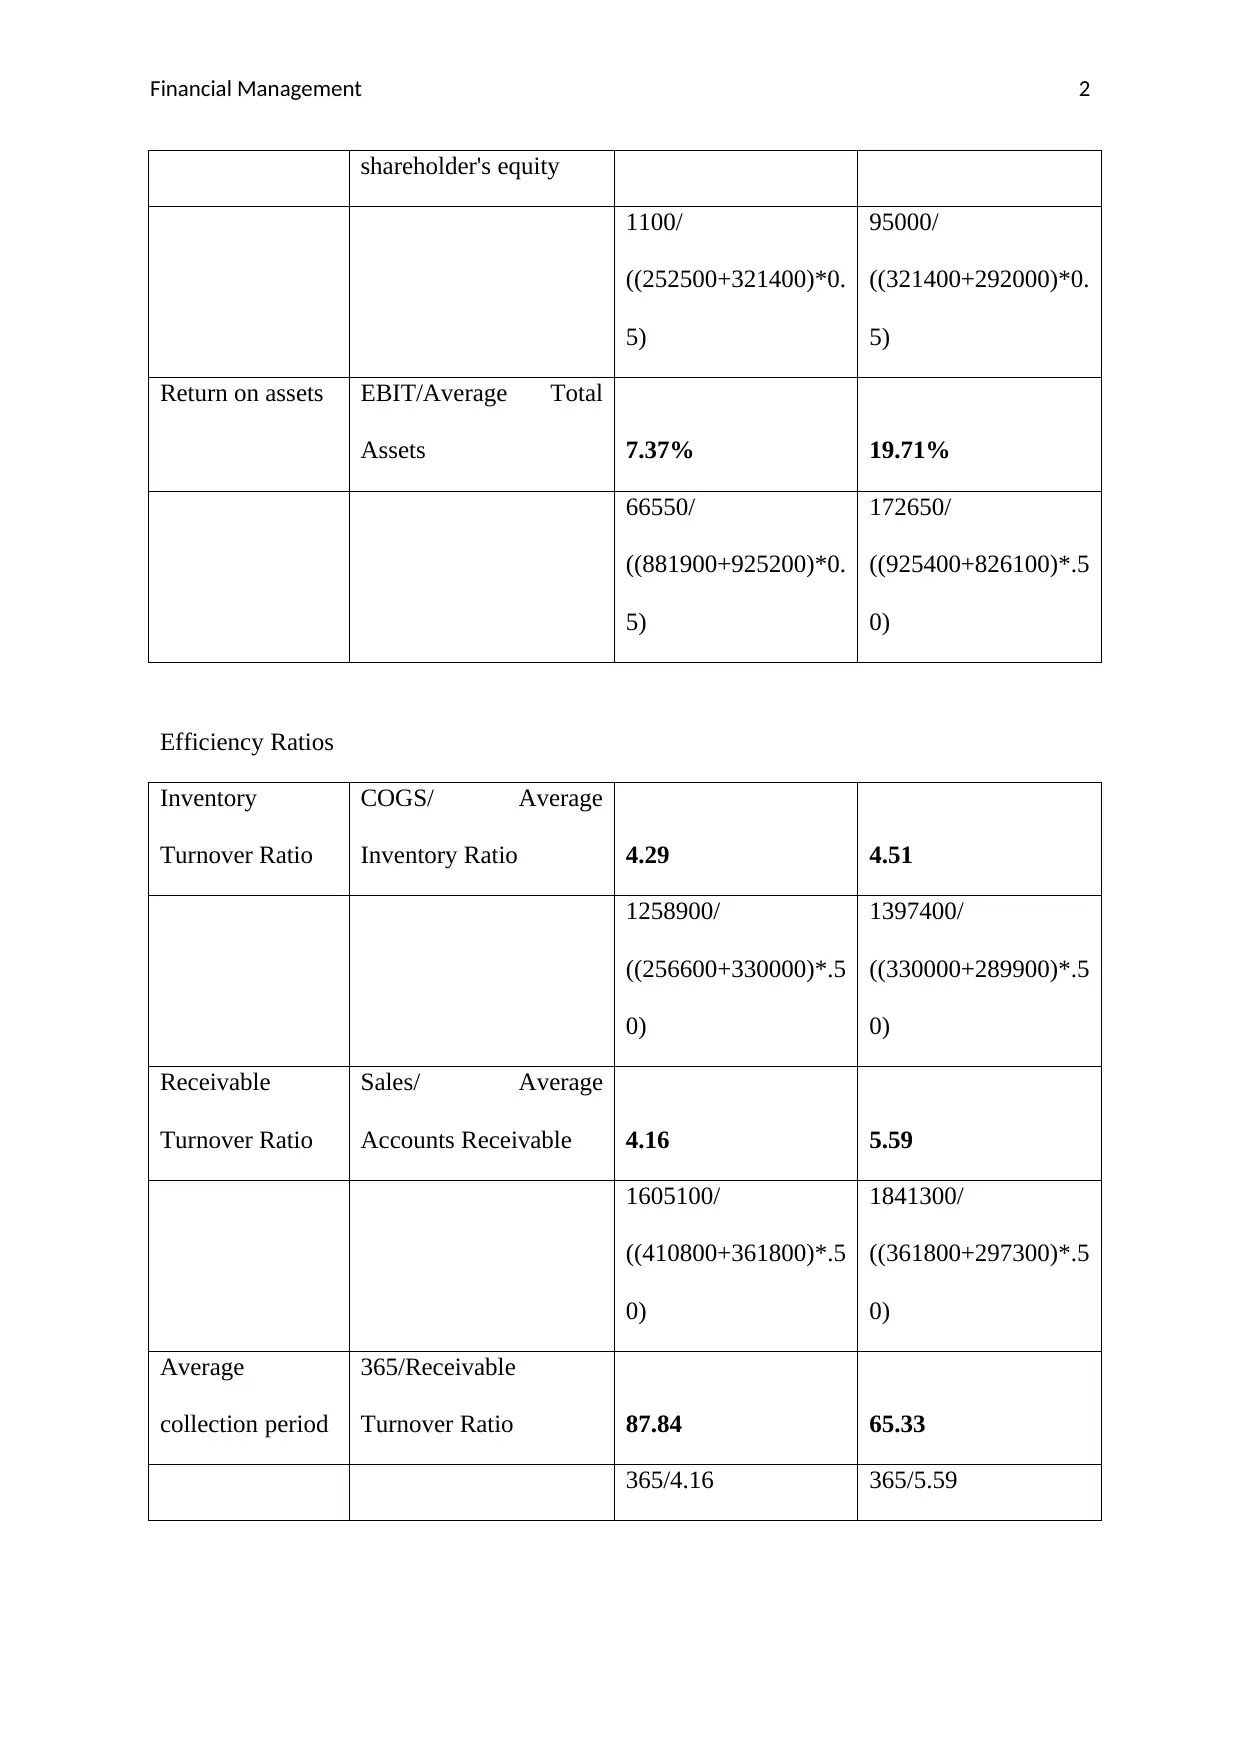
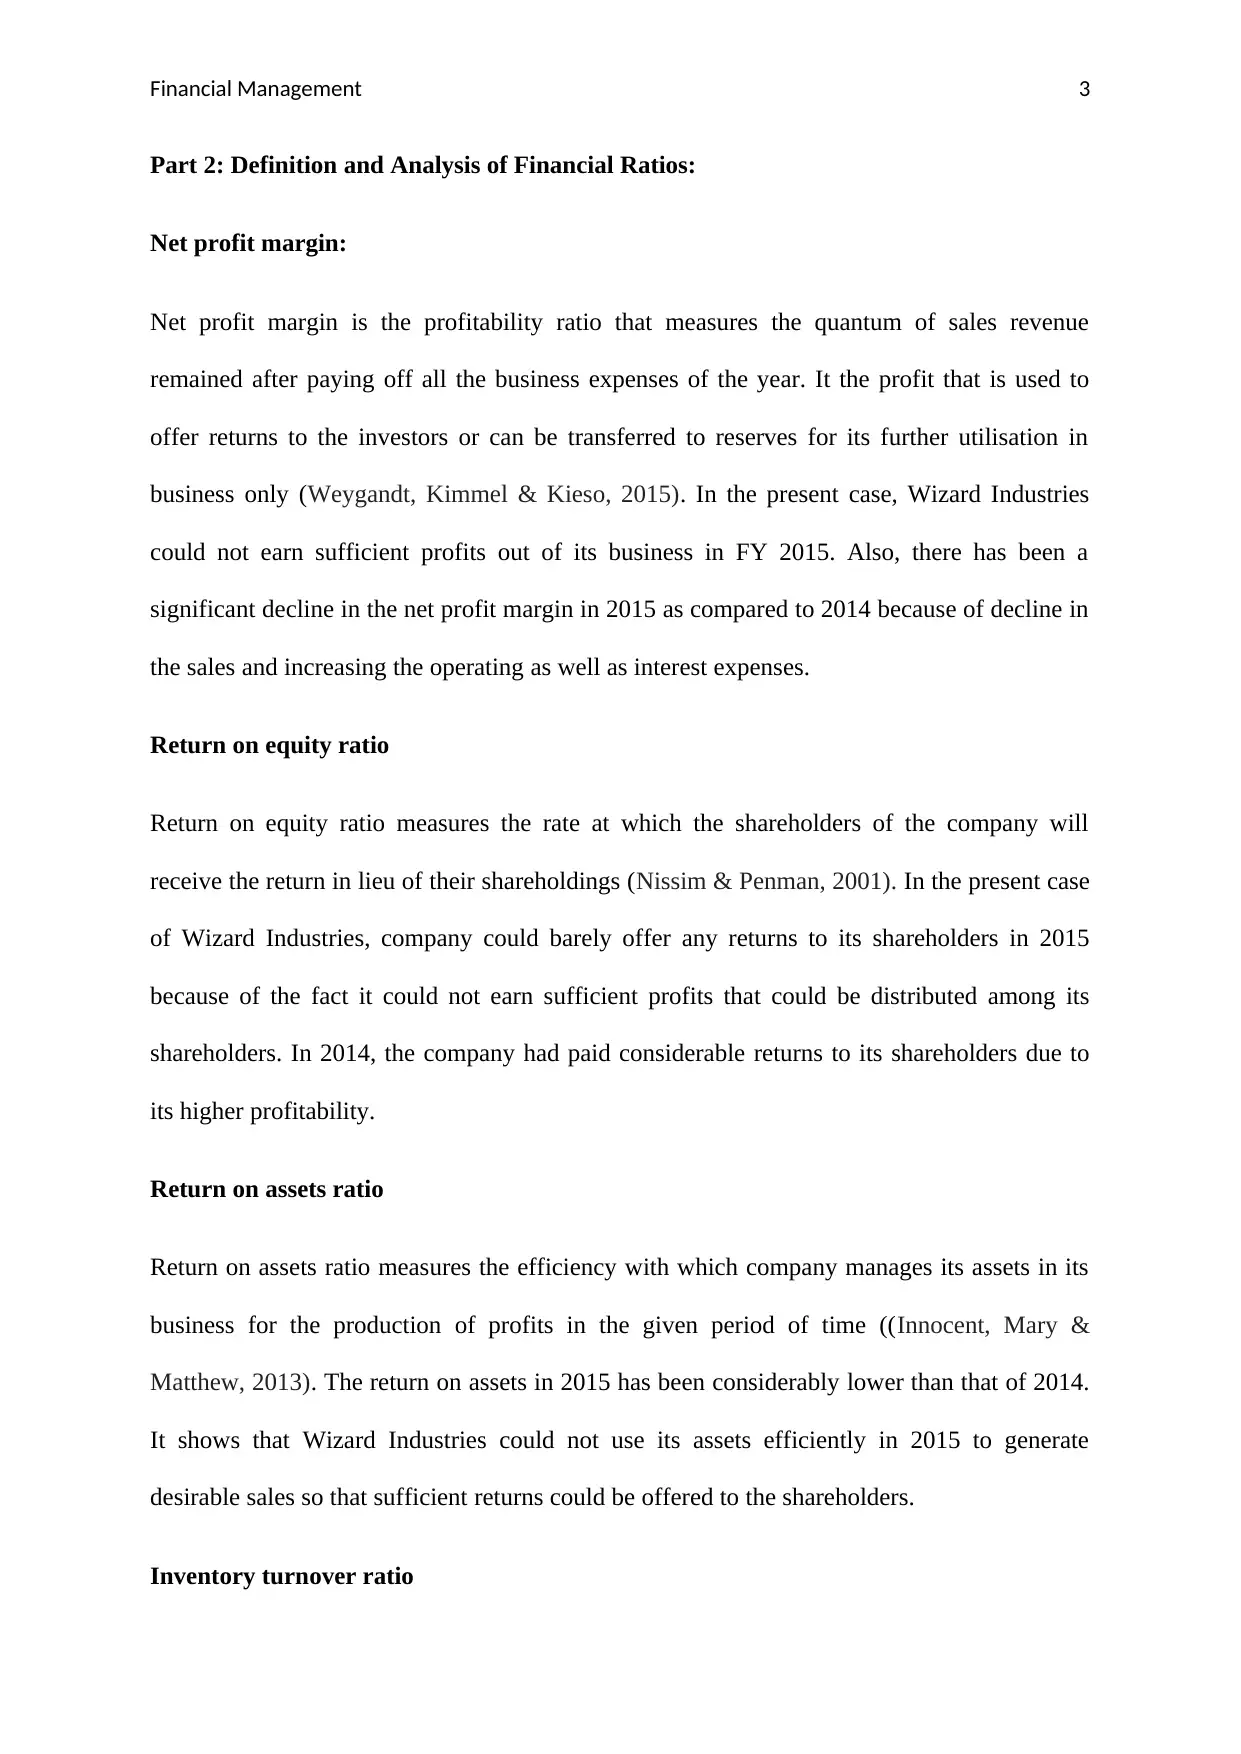
This report presents a financial ratio analysis of Wizard Industries, evaluating its performance in 2015 compared to 2014 and industry averages. The analysis covers profitability ratios (net profit margin, return on equity, return on assets) and efficiency ratios (inventory turnover, receivable turnover, average collection period). The report highlights a decline in financial performance in 2015, with lower profitability and efficiency compared to the previous year and industry benchmarks. The report also discusses the limitations of financial ratio analysis, such as the use of historical data and potential for poor comparability. The conclusion indicates that Wizard Industries' financial standing has weakened, suggesting a need for improved financial management strategies to enhance its market position and competitiveness. The report is well-structured, providing calculations, definitions, and comparisons to support its conclusions and recommendations. The analysis is based on the provided financial data for the company.
Document Page
Running Head: Financial Management
FINANCIAL RATIO ANALYSIS
WIZARD INDUSTRIES
tabler-icon-diamond-filled.svg

Paraphrase This Document

Need a fresh take? Get an instant paraphrase of this document with our AI Paraphraser
Document Page
Financial Management 1
Introduction:
The present report is prepared to analyse the financial performance of Wizard Industries
using the key accounting and financial technique called ratio analysis. The financial ratios in
relation to profitability and efficiency aspects of financial performance of the company are
calculated to assess its financial health from different angles. Use of key profitability ratios is
made to identify whether the business of Wizard industries is generating sufficient profits and
has it utilised its assets and funds of shareholder’s investment in business in such a way that
maximum returns could be offered to the shareholders of the company.
Part 1: Financial Ratios Calculation:
For the purpose of analysis of financial performance of Wizard Industries a comparative
study of financial ratios at both inter-firm as well as intra-firm level has been done. Under the
intra-firm analysis, the financial performance of company in 2015 is compared with that of
2014 in order to evaluate whether the overall financial performance has improved or declined
in 2015. On the other side, the financial performance of company is compared against the
average industry results as a part of inter-firm analysis so as to determine the financial
standing of the company in the industry within which it operates its business.
Profitability
Ratios
2015 2014
Net profit Margin PAT/ Sales
0.07% 5.16%
1100/1605100 95000/1841300
Return on equity Net profit after
tax/Average
0.38% 30.97%
Document Page
Financial Management 2
shareholder's equity
1100/
((252500+321400)*0.
5)
95000/
((321400+292000)*0.
5)
Return on assets EBIT/Average Total
Assets 7.37% 19.71%
66550/
((881900+925200)*0.
5)
172650/
((925400+826100)*.5
0)
Efficiency Ratios
Inventory
Turnover Ratio
COGS/ Average
Inventory Ratio 4.29 4.51
1258900/
((256600+330000)*.5
0)
1397400/
((330000+289900)*.5
0)
Receivable
Turnover Ratio
Sales/ Average
Accounts Receivable 4.16 5.59
1605100/
((410800+361800)*.5
0)
1841300/
((361800+297300)*.5
0)
Average
collection period
365/Receivable
Turnover Ratio 87.84 65.33
365/4.16 365/5.59
Document Page
Financial Management 3
Part 2: Definition and Analysis of Financial Ratios:
Net profit margin:
Net profit margin is the profitability ratio that measures the quantum of sales revenue
remained after paying off all the business expenses of the year. It the profit that is used to
offer returns to the investors or can be transferred to reserves for its further utilisation in
business only (Weygandt, Kimmel & Kieso, 2015). In the present case, Wizard Industries
could not earn sufficient profits out of its business in FY 2015. Also, there has been a
significant decline in the net profit margin in 2015 as compared to 2014 because of decline in
the sales and increasing the operating as well as interest expenses.
Return on equity ratio
Return on equity ratio measures the rate at which the shareholders of the company will
receive the return in lieu of their shareholdings (Nissim & Penman, 2001). In the present case
of Wizard Industries, company could barely offer any returns to its shareholders in 2015
because of the fact it could not earn sufficient profits that could be distributed among its
shareholders. In 2014, the company had paid considerable returns to its shareholders due to
its higher profitability.
Return on assets ratio
Return on assets ratio measures the efficiency with which company manages its assets in its
business for the production of profits in the given period of time ((Innocent, Mary &
Matthew, 2013). The return on assets in 2015 has been considerably lower than that of 2014.
It shows that Wizard Industries could not use its assets efficiently in 2015 to generate
desirable sales so that sufficient returns could be offered to the shareholders.
Inventory turnover ratio
tabler-icon-diamond-filled.svg

Paraphrase This Document

Need a fresh take? Get an instant paraphrase of this document with our AI Paraphraser
Document Page
Financial Management 4
Inventory turnover ratio is the efficiency ratio the measures the number of times the average
inventory of the business is converted into sales during the given period of time (Higgins,
2012). Higher ITR is better as it reflects more efficiency of the firm. In 2015 the ITR has
slightly declined from that of 2014 and this shows that the inventory management practices
have slightly become inefficient.
Receivable turnover ratio
Receivable turnover ratio measures the efficiency with which the accounts receivables of the
company are managed by way of their conversion into cash sales in the given period (Foster,
2004). The RTR is also degraded in 2015 as compared to 2014, which shows that company
could convert its accounts receivables into sales as quickly as it had practiced in 2014.
Average collection period ratio
The average collection period ratio calculated the average number of days which are taken by
the company to convert its accounts receivables into sales. The collection period has
enhanced in 2015 which indicates that the cash conversion cycle of the company has slowed
down in 2015 as compared to 2014 because of its inefficiency to convert its accounts
receivables into cash.
Part 3: Comparison against average industry ratios:
The comparison of Wizard’s performance against the average industry results has shown that
there has been a significant difference in the net profit margin rate as well as the rate of return
on equity. This clearly shows that the company is not performing in line with the
performance of other firms in the industry. The lower profitability in terms of net margins
and returns to the equity shareholders indicates that the company might have to face intense
competitive pressure from its peer competitors as the existing and potential shareholders
Document Page
Financial Management 5
would not have found the company as a better investment option because of its lower
profitability. However, there is no significant difference between the ROA of the company
and its industry averages which shows that company is managing its overall assets in the
appropriate manner but still there is a room for the improvement in its asset management
practices to achieve the competiveness.
In terms of efficiency in managing the current assets such as accounts receivables and
inventories Wizard Industries is not performing as sound as the other firms in the industry
which is providing its rival firms a competitive advantage over it. The inventory and
receivables management practices of the company are not strong enough to meet at-least the
average industry standards. Hence, Wizard is taking more time to convert its inventory and
accounts receivables into cash.
Part 4: Limitations of Financial Ratio Analysis
Though ratio analysis is the most commonly used technique of financial analysis yet it suffers
from various limitations which will be discussed below:
Use of historical information:
The ratio analysis takes into account the information of the results that have been achieved in
past which do not necessarily reflect the performance of the company in future. The balance
sheet which is used to extract data for the purpose of performance analysis is generally
prepared on historical cost basis and not the fair value basis. The impact of inflationary forces
on different components of financial statements is given consideration while analysing the
performance of the company.
Poor comparability:
Document Page
Financial Management 6
The first and foremost factor that makes affects the comparability feature of the ratio analysis
tool is that the average of performance of all the firms is taken to identify the industry
standards and not the performance of the leaders of the industry which provides better
standards against which the company must perform. Further, it is a general fact that not all
the companies prepare their financial statements using t different accounting policies.
No reasons of changes in performance:
Ratio analysis helps a firm to determine the changes in the performance from one period to
another but it does not depict the reasons of such changes. There could be various reasons of
fluctuation of financial performance of the business over a period of time and it is necessary
for the managers to identify the root causes of such changes in order to improve the financial
performance in the subsequent period.
Use of different concepts in calculation:
The multiplicity of the method of calculation of a single ratio on account of application of
different concepts also affects the utility of financial ratios. Different concepts produce
different results for a particular ratio which makes it different for the users of ratios to
interpret those ratios (Lesakova, 2007).
Conclusion:
Hence, it can be said that the financial performance of Wizard industry in 2015 has miserably
declined from the level that was achieved in 2014 and also it does not have sound market
position to sustain for the longer period in the market.
tabler-icon-diamond-filled.svg

Paraphrase This Document

Need a fresh take? Get an instant paraphrase of this document with our AI Paraphraser
Document Page
Financial Management 7
References:
Foster, G. (2004). Financial Statement Analysis, 2/e. Pearson Education India.
Higgins, R.C. (2012). Analysis for financial management. McGraw-Hill/Irwin.
Innocent, E.C., Mary, O.I. and Matthew, O.M. (2013). Financial ratio analysis as a
determinant of profitability in Nigerian pharmaceutical industry. International journal of
business and management, 8(8), p.107.
Lesakova, L., 2007, June. Uses and limitations of profitability ratio analysis in managerial
practice. In International Conference on Management, Enterprise and Benchmarking, pp. 1-
2.
Nissim, D. and Penman, S.H.(2001). Ratio analysis and equity valuation: From research to
practice. Review of accounting studies, 6(1), pp.109-154.
Penman, S.H. and Penman, S.H.(2001). Financial statement analysis and security valuation.
New York, NY: McGraw-Hill/Irwin.
Weygandt, J. J., Kimmel, P. D., & Kieso, D. E. (2015). Financial & managerial accounting.
John Wiley & Sons.
chevron_up_icon
1 out of 8
circle_padding
hide_on_mobile
zoom_out_icon
[object Object]