Financial Management Project: Capital Investment, Projections & More
VerifiedAdded on 2023/06/04
|14
|3885
|192
Project
AI Summary
This financial management project report evaluates capital investment techniques, sales projections, and replacement options for Saturn Petcare. Part A includes calculations for after-tax cash flows, payback period, net present value (NPV), and profitability index under normal, higher, and lower sales scenarios. It finds the project competitive in the normal scenario but advises against proceeding if sales are hampered. It also analyzes two replacement options using NPV to determine the better choice. Part B discusses debt and equity levels, weighted average cost of capital (WACC), cost of equity using CAPM, and the impact of capital structure changes on material risk, concluding with recommendations based on ratio analysis and financial projections. Desklib offers a wealth of similar resources for students.
Running Head: Financial Management
1
Project Report: Financial Management
1
Project Report: Financial Management
Paraphrase This Document
Need a fresh take? Get an instant paraphrase of this document with our AI Paraphraser

Financial Management
2
Contents
Part A................................................................................................................................3
Que 1: capital investment techniques...............................................................................3
After tax cash flows......................................................................................................3
Payback period..............................................................................................................3
Net present value..........................................................................................................3
Profitability index.........................................................................................................4
Que 2: Projections.............................................................................................................4
Higher sales after tax cash flow and NPV....................................................................4
Lower sales after tax cash flow and NPV.....................................................................5
Que 3: Findings.................................................................................................................6
Que 4: Better replacement option.....................................................................................6
Part B................................................................................................................................8
Introduction.......................................................................................................................8
Debt and equity level........................................................................................................8
WACC..............................................................................................................................8
Cost of equity (CAPM).....................................................................................................9
Comparison in capital structure........................................................................................9
Ratio analysis..................................................................................................................10
Changes in capital structure............................................................................................11
Material risk....................................................................................................................12
Conclusion......................................................................................................................13
References.......................................................................................................................14

Financial Management
3
Part A:
Que 1: capital investment techniques:
After tax cash flows:
Year 1 Year 2 Year 3 Year 4 Year 5 Year 6 Year 7 Year 8 Year 9 Year 10
Initial Outlay 20,000,000$
Revenues 20,000,000$ 20,470,000$ 20,951,045$ 21,443,395$ 22,463,076$ 21,947,314$ 22,463,076$ 23,531,246$ 22,990,959$ 23,531,246$
Raw Material 7,000,000$ 7,164,500$ 7,332,866$ 7,505,188$ 7,862,077$ 7,681,560$ 7,862,077$ 8,235,936$ 8,046,835$ 8,235,936$
Variable conversion cost 5,600,000$ 5,600,000$ 5,600,000$ 5,600,000$ 5,600,000$ 5,600,000$ 5,600,000$ 5,600,000$ 5,600,000$ 5,600,000$
Fixed conversion cost 1,400,000$ 1,564,500$ 1,732,866$ 1,905,188$ 2,262,077$ 2,081,560$ 2,262,077$ 2,635,936$ 2,446,835$ 2,635,936$
EBDT 20,000,000$ 6,000,000$ 6,141,000$ 6,285,314$ 6,433,018$ 6,738,923$ 6,584,194$ 6,738,923$ 7,059,374$ 6,897,288$ 7,059,374$
Less: Depreciation 1,500,000$ 1,500,000$ 1,500,000$ 1,500,000$ 1,500,000$ 1,500,000$ 1,500,000$ 1,500,000$ 1,500,000$ 1,500,000$
EBT 20,000,000$ 4,500,000$ 4,641,000$ 4,785,314$ 4,933,018$ 5,238,923$ 5,084,194$ 5,238,923$ 5,559,374$ 5,397,288$ 5,559,374$
Less: Taxes 1,350,000$ 1,392,300$ 1,435,594$ 1,479,906$ 1,571,677$ 1,525,258$ 1,571,677$ 1,667,812$ 1,619,186$ 1,667,812$
EAT 20,000,000$ 3,150,000$ 3,248,700$ 3,349,719$ 3,453,113$ 3,667,246$ 3,558,936$ 3,667,246$ 3,891,562$ 3,778,101$ 3,891,562$
ADD: Depreciaation -$ 1,500,000$ 1,500,000$ 1,500,000$ 1,500,000$ 1,500,000$ 1,500,000$ 1,500,000$ 1,500,000$ 1,500,000$ 1,500,000$
ADD: Scrap value 5,000,000$
cash flow 20,000,000$ 4,650,000$ 4,748,700$ 4,849,719$ 4,953,113$ 5,167,246$ 5,058,936$ 5,167,246$ 5,391,562$ 5,278,101$ 10,391,562$
Total cash flow -20,000,000$ 4,650,000$ 4,748,700$ 4,849,719$ 4,953,113$ 5,167,246$ 5,058,936$ 5,167,246$ 5,391,562$ 5,278,101$ 10,391,562$
Buddy Project
Payback period:
Years Cash Outflow Cash Inflow Cash flows CF
0 -20000000 -20,000,000$ -20,000,000$
1 4650000 4,650,000$ -15,350,000$
2 4748700 4,748,700$ -10,601,300$
3 4849719.45 4,849,719$ -5,751,581$
4 4953112.857 4,953,113$ -798,468$
5 5167246.005 5,167,246$ 4,368,778$
6 5058936.009 5,058,936$ 9,427,714$
7 5167246.005 5,167,246$ 14,594,960$
8 5391561.667 5,391,562$ 19,986,522$
9 5278101.287 5,278,101$ 25,264,623$
10 10391561.67 10,391,562$ 35,656,185$
4.15
Calculation Of Payaback period
Net present value:
⊘ This is a preview!⊘
Do you want full access?
Subscribe today to unlock all pages.
Trusted by 1+ million students worldwide

Financial Management
4
Years Cash Outflow Cash Inflow Factors Cash Inflow PVCash Outflow PV
0 -20,000,000$ 1.000 -$ -20,000,000$
1 4,650,000$ 0.833 3,875,000$
2 4,748,700$ 0.694 3,297,708$
3 4,849,719$ 0.579 2,806,551$
4 4,953,113$ 0.482 2,388,654$
5 5,167,246$ 0.402 2,076,600$
6 5,058,936$ 0.335 1,694,227$
7 5,167,246$ 0.279 1,442,084$
8 5,391,562$ 0.233 1,253,905$
9 5,278,101$ 0.194 1,022,931$
10 10,391,562$ 0.162 1,678,295$
21,535,956$ -20,000,000$
1,535,956$
Calculation of Net Present Value
Total
NPV= Total Cash Inflow PV -Total cash outflow PV
Profitability index:
Years Cash Outflow Cash InflowPV factor P.V.
0 -20000000 - 1.000 -20000000
1 4650000 0.833 3875000
2 4748700 0.694 3297708.333
3 4849719 0.579 2806550.608
4 4953113 0.482 2388653.963
5 5167246 0.402 2076600.279
6 5058936 0.335 1694227.434
7 5167246 0.279 1442083.527
8 5391562 0.233 1253904.926
9 5278101 0.194 1022931.39
10 10391562 0.162 1678295.224
7091442.50
0.355
Calculation of profitability index
PI= Total Cash Inflow/Initial Investment
Que 2: Projections:
Higher sales after tax cash flow and NPV:
After tax cash flows:
Paraphrase This Document
Need a fresh take? Get an instant paraphrase of this document with our AI Paraphraser

Financial Management
5
10% higher than Estimated sales
Year 1 Year 2 Year 3 Year 4 Year 5 Year 6 Year 7 Year 8 Year 9 Year 10
20,000,000$
22,000,000$ 22,517,000$ 23,046,150$ 23,587,734$ 24,709,384$ 24,142,046$ 24,709,384$ 25,884,371$ 25,290,054$ 25,884,371$
Raw Material 7,700,000$ 7,880,950$ 8,066,152$ 8,255,707$ 8,648,284$ 8,449,716$ 8,648,284$ 9,059,530$ 8,851,519$ 9,059,530$
Variable conversion cost 5,600,000$ 5,600,000$ 5,600,000$ 5,600,000$ 5,600,000$ 5,600,000$ 5,600,000$ 5,600,000$ 5,600,000$ 5,600,000$
Fixed conversion cost 2,100,000$ 2,280,950$ 2,466,152$ 2,655,707$ 3,048,284$ 2,849,716$ 3,048,284$ 3,459,530$ 3,251,519$ 3,459,530$
20,000,000$ 6,600,000$ 6,755,100$ 6,913,845$ 7,076,320$ 7,412,815$ 7,242,614$ 7,412,815$ 7,765,311$ 7,587,016$ 7,765,311$
Less: Depreciation 1,500,000$ 1,500,000$ 1,500,000$ 1,500,000$ 1,500,000$ 1,500,000$ 1,500,000$ 1,500,000$ 1,500,000$ 1,500,000$
20,000,000$ 5,100,000$ 5,255,100$ 5,413,845$ 5,576,320$ 5,912,815$ 5,742,614$ 5,912,815$ 6,265,311$ 6,087,016$ 6,265,311$
Less: Taxes 1,530,000$ 1,576,530$ 1,624,153$ 1,672,896$ 1,773,845$ 1,722,784$ 1,773,845$ 1,879,593$ 1,826,105$ 1,879,593$
20,000,000$ 3,570,000$ 3,678,570$ 3,789,691$ 3,903,424$ 4,138,971$ 4,019,830$ 4,138,971$ 4,385,718$ 4,260,911$ 4,385,718$
-$ 1,500,000$ 1,500,000$ 1,500,000$ 1,500,000$ 1,500,000$ 1,500,000$ 1,500,000$ 1,500,000$ 1,500,000$ 1,500,000$
ADD: Scrap value 5,000,000$
20,000,000$ 5,070,000$ 5,178,570$ 5,289,691$ 5,403,424$ 5,638,971$ 5,519,830$ 5,638,971$ 5,885,718$ 5,760,911$ 10,885,718$
-20,000,000$ 5,070,000$ 5,178,570$ 5,289,691$ 5,403,424$ 5,638,971$ 5,519,830$ 5,638,971$ 5,885,718$ 5,760,911$ 10,885,718$
Buddy Project
NPV:
Years Cash Outflow Cash Inflow Factors P.V. ofCash InflowP.V. of Cash Outflow
0 -20,000,000$ 1.000 -$ -20,000,000$
1 5,070,000$ 0.833 4,225,000$
2 5,178,570$ 0.694 3,596,229$
3 5,289,691$ 0.579 3,061,164$
4 5,403,424$ 0.482 2,605,818$
5 5,638,971$ 0.402 2,266,176$
6 5,519,830$ 0.335 1,848,580$
7 5,638,971$ 0.279 1,573,733$
8 5,885,718$ 0.233 1,368,830$
9 5,760,911$ 0.194 1,116,503$
10 10,885,718$ 0.162 1,758,104$
23,420,137$ -20,000,000$
3,420,137$
Calculation of Net Present Value
Total
NPV= Total Cash Inflow PV -Total cash outflow PV
Lower sales after tax cash flow and NPV:
After tax cash flows:
10% lower than Estimated sales
Year 1 Year 2 Year 3 Year 4 Year 5 Year 6 Year 7 Year 8 Year 9 Year 10
Initial Outlay 20,000,000$
Revenues 18,000,000$ 18,423,000$ 18,855,941$ 19,299,055$ 20,216,769$ 19,752,583$ 20,216,769$ 21,178,121$ 20,691,863$ 21,178,121$
Raw Material 6,300,000$ 6,448,050$ 6,599,579$ 6,754,669$ 7,075,869$ 6,913,404$ 7,075,869$ 7,412,343$ 7,242,152$ 7,412,343$
Variable conversion cost 5,600,000$ 5,600,000$ 5,600,000$ 5,600,000$ 5,600,000$ 5,600,000$ 5,600,000$ 5,600,000$ 5,600,000$ 5,600,000$
Fixed conversion cost 700,000$ 848,050$ 999,579$ 1,154,669$ 1,475,869$ 1,313,404$ 1,475,869$ 1,812,343$ 1,642,152$ 1,812,343$
EBDT 20,000,000$ 5,400,000$ 5,526,900$ 5,656,782$ 5,789,717$ 6,065,031$ 5,925,775$ 6,065,031$ 6,353,436$ 6,207,559$ 6,353,436$
Less: Depreciation 1,500,000$ 1,500,000$ 1,500,000$ 1,500,000$ 1,500,000$ 1,500,000$ 1,500,000$ 1,500,000$ 1,500,000$ 1,500,000$
EBT 20,000,000$ 3,900,000$ 4,026,900$ 4,156,782$ 4,289,717$ 4,565,031$ 4,425,775$ 4,565,031$ 4,853,436$ 4,707,559$ 4,853,436$
Less: Taxes 1,170,000$ 1,208,070$ 1,247,035$ 1,286,915$ 1,369,509$ 1,327,732$ 1,369,509$ 1,456,031$ 1,412,268$ 1,456,031$
EAT 20,000,000$ 2,730,000$ 2,818,830$ 2,909,748$ 3,002,802$ 3,195,521$ 3,098,042$ 3,195,521$ 3,397,406$ 3,295,291$ 3,397,406$
ADD: Depreciaation -$ 1,500,000$ 1,500,000$ 1,500,000$ 1,500,000$ 1,500,000$ 1,500,000$ 1,500,000$ 1,500,000$ 1,500,000$ 1,500,000$
ADD: Scrap value 5,000,000$
cash flow 20,000,000$ 4,230,000$ 4,318,830$ 4,409,748$ 4,502,802$ 4,695,521$ 4,598,042$ 4,695,521$ 4,897,406$ 4,795,291$ 9,897,406$
Total cash flow-20,000,000$ 4,230,000$ 4,318,830$ 4,409,748$ 4,502,802$ 4,695,521$ 4,598,042$ 4,695,521$ 4,897,406$ 4,795,291$ 9,897,406$
Buddy Project
NPV:

Financial Management
6
Years Cash Outflow Cash Inflow Factors P.V. ofCash InflowP.V. of Cash Outflow
0 -20,000,000$ 1.000 -$ -20,000,000$
1 4,230,000$ 0.833 3,525,000$
2 4,318,830$ 0.694 2,999,188$
3 4,409,748$ 0.579 2,551,937$
4 4,502,802$ 0.482 2,171,490$
5 4,695,521$ 0.402 1,887,025$
6 4,598,042$ 0.335 1,539,875$
7 4,695,521$ 0.279 1,310,434$
8 4,897,406$ 0.233 1,138,980$
9 4,795,291$ 0.194 929,360$
10 9,897,406$ 0.162 1,598,486$
19,651,774$ -20,000,000$
-348,226$
Calculation of Net Present Value
Total
NPV= Total Cash Inflow PV -Total cash outflow PV
Que 3: Findings:
On the basis of the above given calculations of Buddy project of Saturn Petcare, it has
been found that the project of the company is quite competitive in the normal scenario. The
evaluation of capital budgeting on the case explains that the after tax cash flows of the
company is $ 32,41,471. It further explains that the net present value, profitability index and
the payback period of the project is $ 15,35,956, 35.5% and 4.15 years. It briefs the overall
position of the project in normal scenario is better.
Though, the management wants to evaluate different scenario related to the projects in
order to measure the cash position and the profitability level of the project in different cases.
In case of 10% higher sales of the business, it has been identified that the after tax cash flows
of the project is $3,420,137 and the $ 3,420,137 is the net present value of the project.
Further, in case of 10% lower sales of the business, it has been identified that the after tax
cash flows of the project is $ 31,040,566 and the $ $ -348,226 is the net present value of the
project. It explains that if the sales of the project would be hampered than the business would
generate loss (Haney, 2009). Though, it has been measured that the company has enough
space to run the business and generate profit.
However, on the basis of evaluation, it has been measured that if the factors and
market would affect the sales unit of the business than the business would have to face the
losses and thus it is suggested to the Mr. Quinlivan to not proceed with the project.
Que 4: Better replacement option:
⊘ This is a preview!⊘
Do you want full access?
Subscribe today to unlock all pages.
Trusted by 1+ million students worldwide

Financial Management
7
Saturn petcare is also planning to replace the old machineries with new one to
improve the production process of the business. The company has evaluated two projects to
identify that which project is better to replace the old machineries. The calculations of both
the projects are as follows;
Years Cash OutflowCash InflowFactors P.V. ofCash InflowP.V. of Cash Outflow
0 -475,000$ 1.000 -$ -475,000$
1 100,000$ 0.943 94,340$
2 100,000$ 0.890 89,000$
3 100,000$ 0.840 83,962$
4 100,000$ 0.792 79,209$
5 100,000$ 0.747 74,726$
6 100,000$ 0.705 70,496$
491,732$ -475,000$
16,732$
Calculation of Net Present Value (option A)
Total
NPV= Total Cash Inflow-Total cash outflow
Years Cash Outflow Cash InflowFactors P.V. ofCash InflowP.V. of Cash Outflow
0 -475,000$ 1.000 -$ -475,000$
1 80,000$ 0.943 75,472$
2 80,000$ 0.890 71,200$
3 80,000$ 0.840 67,170$
4 80,000$ 0.792 63,367$
5 80,000$ 0.747 59,781$
6 80,000$ 0.705 56,397$
7 80,000$ 0.665 53,205$
8 80,000$ 0.627 50,193$
9 80,000$ 0.592 47,352$
544,135$ -475,000$
69,135$NPV= Total Cash Inflow PV -Total cash outflow PV
Calculation of Net Present Value (option B)
Total
On the basis of above calculations, the NPV of project A and project B is $ 16,732
and $ 69,135 which explains that project b is offering more cash inflows and profit to the
business. Thus the upgrade of old machineries and production system must be done with
project B of the company because of the better returns (Gapenski & Reiter, 2008).
Paraphrase This Document
Need a fresh take? Get an instant paraphrase of this document with our AI Paraphraser

Financial Management
8
Part B:
Executive summary:
The report focuses on the various economical, internal and external factors of AMP
limited in order to identify the financial strategies and management in order to control over
the overall risk level and cost of the company. The capital structure, ratio analysis, cost of
capital and material risk has been performed in the report on AMP limited to reach over a
conclusion about the position of the company.
Introduction:
AMP limited is a financial services providing company which operates its business in
the Australia and New Zealand market. It is a commercial bank which offers various
commercial and financial services to its clients. In this report, the corporate information of
the company has been collected to identify the risk level, return and the financial position of
the company.
Debt and equity level:
Debt and equity level describes about the capital structure of the business. In the
report, the debt and equity level of the company has been evaluated and it has been found that
the debt level of the company is lowest which expresses about lower financial gearing and
higher cost of capital of the business.
(annual report, 2017)
WACC:

Financial Management
9
WACC explains about the total cost of capital of the business. The below calculations
expresses the weighted average cost of capital of the business is 10.41%. The cost of the
company is higher because of the high equity share.
Price Cost Weight WACC
Debt 1,116 3.85% 0.13 0.52%
Equity 7,202 11.42% 0.87 9.89%
8,318 10.41%
(Amount in million)
Kd
WACC calculations of AMP
(annual report, 2017)
Cost of equity (CAPM):
The cost of equity through CAPM model has been calculated further to identify the
total cost associated with the equity funds of the company. the below table expresses that the
risk and return of the company is 1.47 and 11.42% respectively which explains that along
with the higher risk, the return from the company is also higher.
Risk Free rate 2.41%
Market return 8.54%
Beta 1.470
Required rate of return 11.42%
Calculation of cost of equity (CAPM)
(annual report, 2017)
Comparison in capital structure:
The capital structure (debt and equity level) of Amp limited has been compared with
the Westpac bank in order to identify the capital structure of the industry. The table explains
that even though the capital structure of Westpac bank is not good. It is associating with
lower risk and higher cost of the business.
⊘ This is a preview!⊘
Do you want full access?
Subscribe today to unlock all pages.
Trusted by 1+ million students worldwide

Financial Management
10
(annual report, 2017)
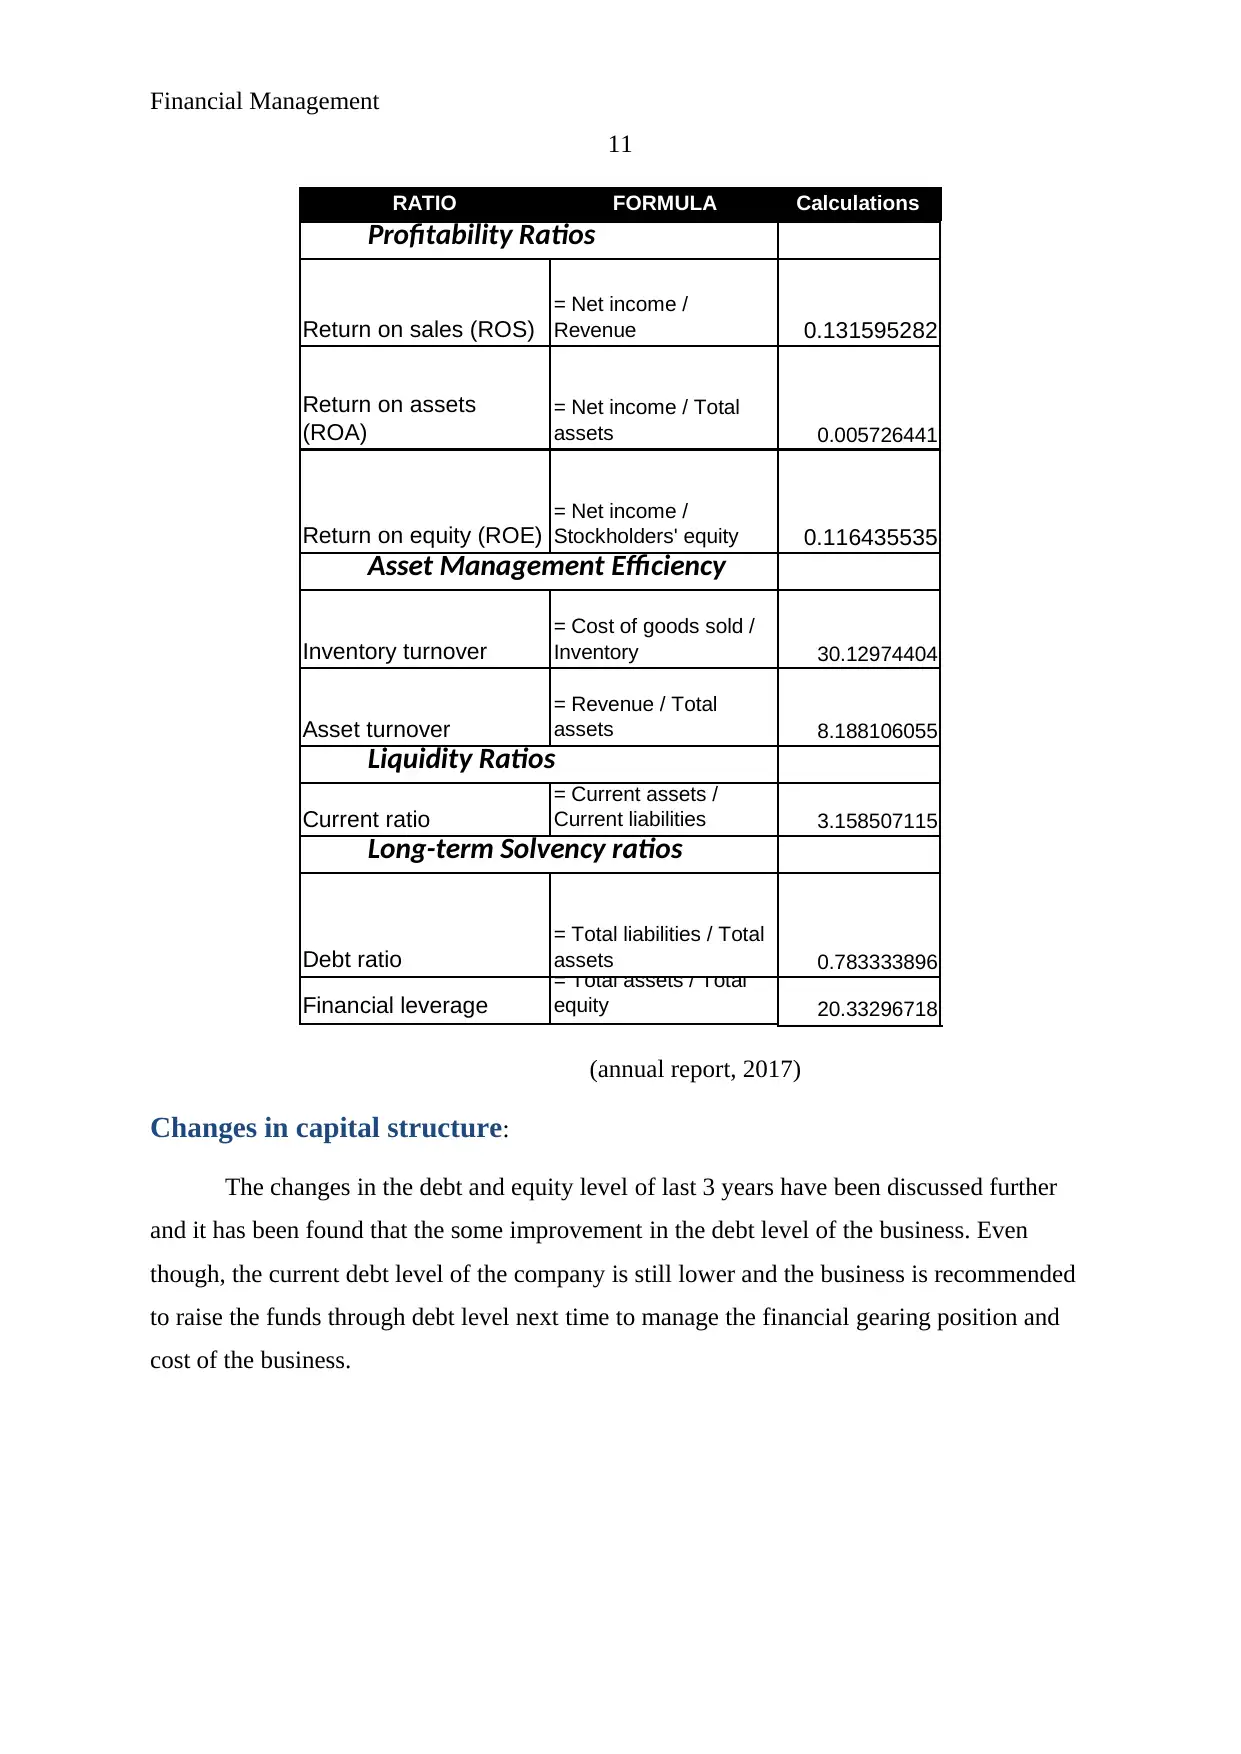
Ratio analysis:
The ratio analysis study has been conducted on the final financial statement of the
company of 1 year in order to measure the financial level of the business. The different ratios
have been conducted on the company to measure the different financial level of the company
such as the liquidity ratios, profitability ratios, capital structure ratios and asset management
efficiency.
The liquidity ratio explains about the debt payment capability of the business,
calculations explain about better liquidity position of the business (Goss, 2015). Further, the
profitability ratios measure the profit generation capabilities of the business. In case of AMP
limited, the profit generation capabilities of the company are quite better. In addition, the
long term solvency ratio measures the gearing position of the business (Fridson & Alvarez,
2011). In case of AMP limited, the cost management and the gearing level of the company is
average. Lastly, the asset management efficiency ratios measure the asset management and
efficiency level of the business. In case of AMP limited, the asset management capabilities of
the business are quite better.
10
(annual report, 2017)
Ratio analysis:
The ratio analysis study has been conducted on the final financial statement of the
company of 1 year in order to measure the financial level of the business. The different ratios
have been conducted on the company to measure the different financial level of the company
such as the liquidity ratios, profitability ratios, capital structure ratios and asset management
efficiency.
The liquidity ratio explains about the debt payment capability of the business,
calculations explain about better liquidity position of the business (Goss, 2015). Further, the
profitability ratios measure the profit generation capabilities of the business. In case of AMP
limited, the profit generation capabilities of the company are quite better. In addition, the
long term solvency ratio measures the gearing position of the business (Fridson & Alvarez,
2011). In case of AMP limited, the cost management and the gearing level of the company is
average. Lastly, the asset management efficiency ratios measure the asset management and
efficiency level of the business. In case of AMP limited, the asset management capabilities of
the business are quite better.
Paraphrase This Document
Need a fresh take? Get an instant paraphrase of this document with our AI Paraphraser
Financial Management
11
RATIO FORMULA Calculations
Return on sales (ROS)
= Net income /
Revenue 0.131595282
Return on assets
(ROA)
= Net income / Total
assets 0.005726441
Return on equity (ROE)
= Net income /
Stockholders' equity 0.116435535
Inventory turnover
= Cost of goods sold /
Inventory 30.12974404
Asset turnover
= Revenue / Total
assets 8.188106055
Current ratio
= Current assets /
Current liabilities 3.158507115
Debt ratio
= Total liabilities / Total
assets 0.783333896
Financial leverage
= Total assets / Total
equity 20.33296718
Profitability Ratios
Asset Management Efficiency
Liquidity Ratios
Long-term Solvency ratios
(annual report, 2017)
Changes in capital structure:
The changes in the debt and equity level of last 3 years have been discussed further
and it has been found that the some improvement in the debt level of the business. Even
though, the current debt level of the company is still lower and the business is recommended
to raise the funds through debt level next time to manage the financial gearing position and
cost of the business.

Financial Management
12
(Annual report, 2017)
Material risk:
Material risk defines about the uncertainty in a business. The uncertainties in a
business could be of various types. In case of Amp limited, it has been found that the main
material risks of the business are as follows:
1. Strategic risk: This is related to the changes in the financial and non financial
strategies of the business.
2. credit risk: It is related to the total credit time period of the business which is offered
to the debtors to repay the amount (Haney, 2009).
3. Market risk: It is related to the fluctuations in the market demand and market factors.
4. Liquidity risk: It explains about the short term solvency position and the capability to
repay the short term debt of the business.
5. Operational risk: It is related to the daily operations and the management of the
operations of the business.
6. Insurance risk: it is related to the different policies of the business (Goss, 2015).
7. Concentration risk: it explains about the overall spread of outstanding account of bank
over the number of debtors of the bank who has lent the money from the bank.
After identifying the different material risk of the company, it has been recognized that
the uncertainties of all the above stated factors are higher in the Amp limited. Recently, the
⊘ This is a preview!⊘
Do you want full access?
Subscribe today to unlock all pages.
Trusted by 1+ million students worldwide
1 out of 14