Financial Analysis of Enero Group and Aspermont Ltd
VerifiedAdded on 2023/01/11
|16
|3076
|92
AI Summary
This report analyzes the financial performance of Enero Group and its competitor Aspermont Ltd using ratio analysis, DuPont analysis for ROE, and working capital management. It provides insights into liquidity, capital structure, efficiency, and profitability of the companies.
Contribute Materials
Your contribution can guide someone’s learning journey. Share your
documents today.

FINANCIAL MANAGEMENT
Secure Best Marks with AI Grader
Need help grading? Try our AI Grader for instant feedback on your assignments.
TABLE OF CONTENTS
TABLE OF CONTENTS................................................................................................................2
INTRODUTION..............................................................................................................................1
FINANCIAL ANALYSIS...............................................................................................................1
Enero Group.................................................................................................................................1
Comparison and Trend Analysis of Enero Group.......................................................................1
DuPont Method: Return on invested capital................................................................................7
Working Capital management.....................................................................................................8
Market Ratios.............................................................................................................................10
CONCLUSION..............................................................................................................................10
REFERENCES..............................................................................................................................12
APPENDICES...............................................................................................................................13
Operating cash cycle..................................................................................................................13
DuPont Analysis: ROE..............................................................................................................14
INTRODUTION
Financial management refers to planning, directing, organising and controlling financial
activities like the procurement & utilisation of the funds of enterprise. Financial management
involves application of the management principles to the financial resources of entity. It is
concerned with analysing and dealing and the investments for person or the business for helping
the management to make decisions. It focuses over the equities, ratios and debts. This is useful
for the portfolio management, distribution of the dividend, hedging, capital raising hedging after
analysing and evaluating the product cycles foreign currencies. Present report is based on Enero
Group that is a software and telecommunication company operating in Australia. Study will
analyse the financial performance of Enero Group and its competitor Aspermont. The companies
are operating in the same telecommunication industry. Report will include the analysis of the
Enero group with Aspermont ltd using ratio analysis, DuPont analysis for ROE and working
capital management of the two companies. The report will enhance the understanding of the
financial statement analysis and tools used for evaluating the performance and position of
company.
FINANCIAL ANALYSIS
Enero Group
Enero Group is company engaged communication and marketing services including
market research, strategy, public relations, advertising, graphic designing, communication
planning, direct marketing, event management and corporate communications. Company consists
of 10 communication and marketing service business services businesses in around eight
countries. Company mainly has 3 hubs that are Sydney, London & New York. There are 2 cash
generating units which are Operating Brands and Search Marketing CGU (Enero Group, 2019).
Operating brands of business includes Australian and International communication and
marketing services. one of the major competitor is Aspermont ltd carrying business in the same
industry.
Comparison and Trend Analysis of Enero Group.
Enero Group has been running business in the field of telecommunications but is facing
through critical times in maintaining its stability. Financial analysis of the company is carried out
using ratio analysis.
Liquidity Ratios
1
Liquidity ratio
Aspermont Limited Enero Group
2019 2018 2019 2018
Current ratio Current
assets / current
liabilities
0.24 0.45 0.39 1.49 1.72 1.59
Quick Ratio (Current
Assets -
Inventory) /
Current
Liabilities
0.24 0.45 0.39 1.44 1.72 1.56
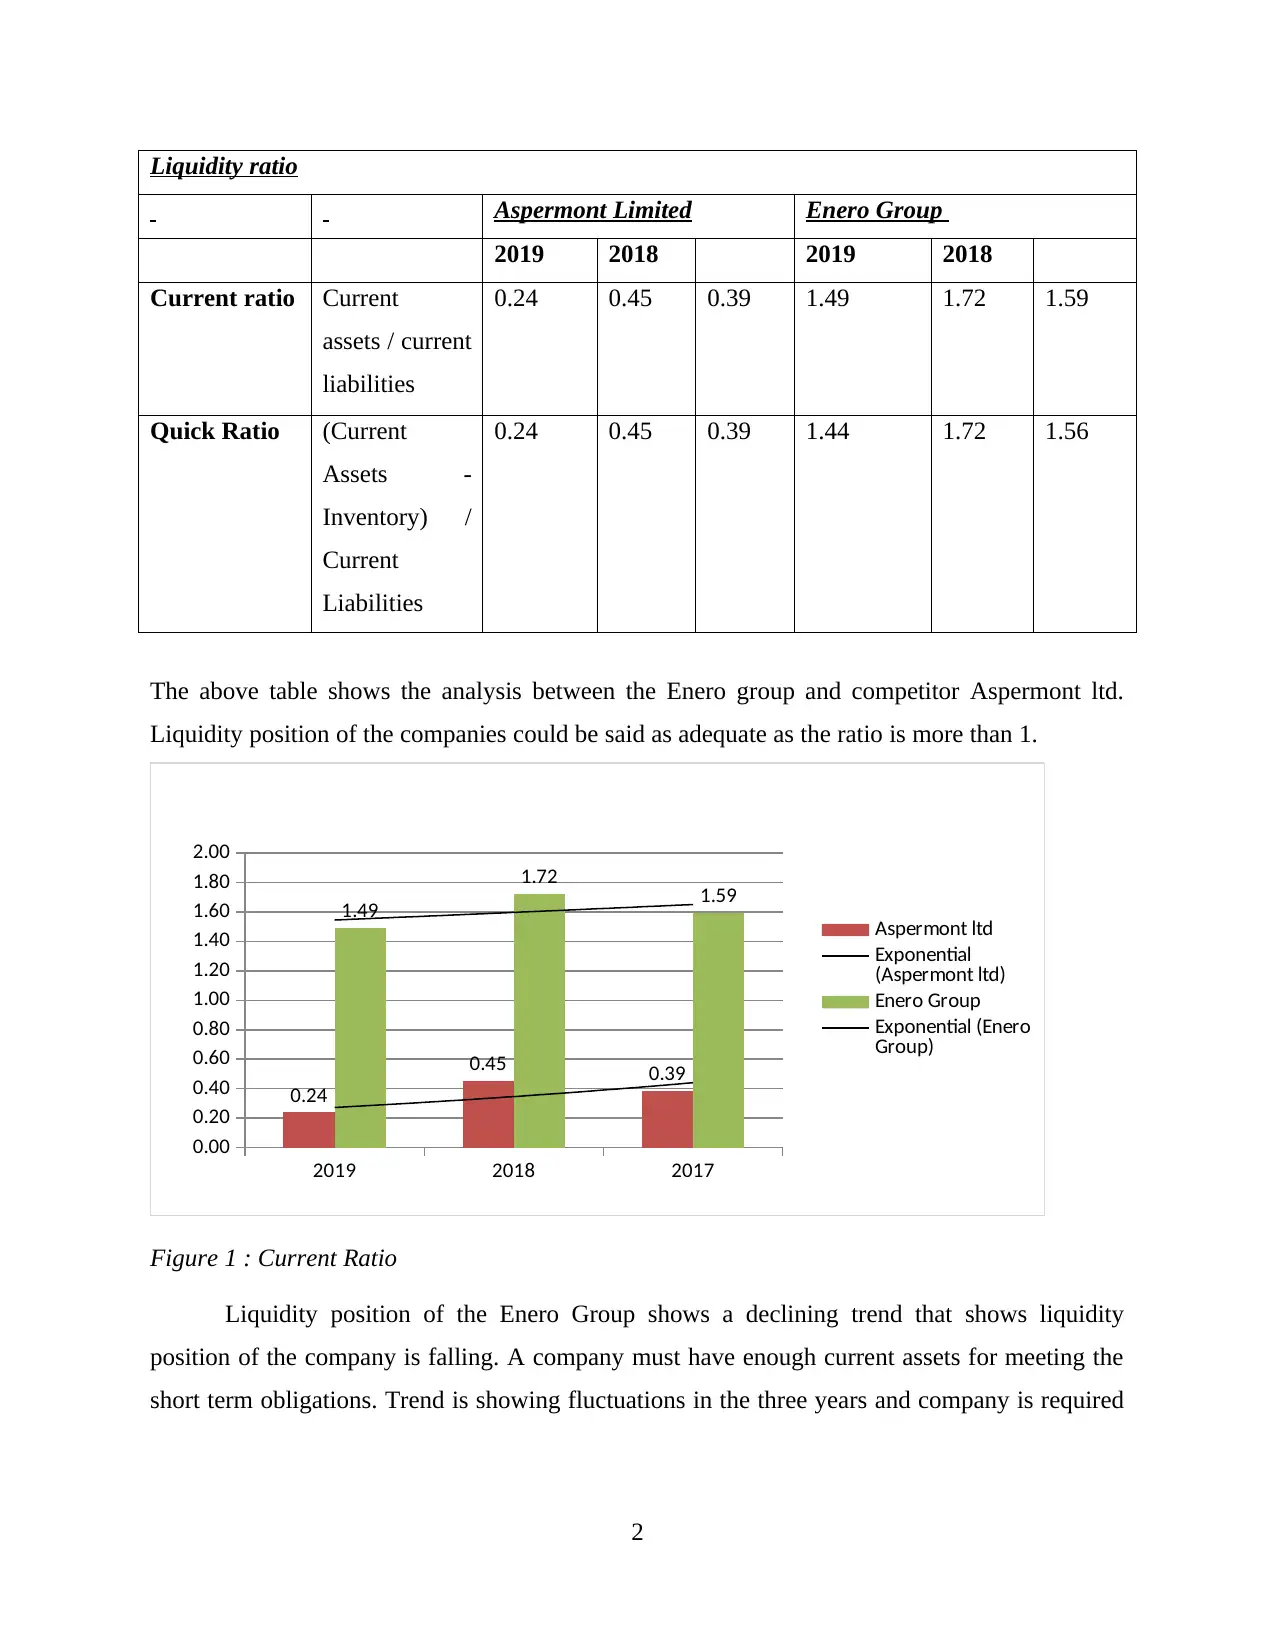
The above table shows the analysis between the Enero group and competitor Aspermont ltd.
Liquidity position of the companies could be said as adequate as the ratio is more than 1.
2019 2018 2017
0.00
0.20
0.40
0.60
0.80
1.00
1.20
1.40
1.60
1.80
2.00
0.24
0.45 0.39
1.49
1.72 1.59
Aspermont ltd
Exponential
(Aspermont ltd)
Enero Group
Exponential (Enero
Group)
Figure 1 : Current Ratio
Liquidity position of the Enero Group shows a declining trend that shows liquidity
position of the company is falling. A company must have enough current assets for meeting the
short term obligations. Trend is showing fluctuations in the three years and company is required
2
Aspermont Limited Enero Group
2019 2018 2019 2018
Current ratio Current
assets / current
liabilities
0.24 0.45 0.39 1.49 1.72 1.59
Quick Ratio (Current
Assets -
Inventory) /
Current
Liabilities
0.24 0.45 0.39 1.44 1.72 1.56
The above table shows the analysis between the Enero group and competitor Aspermont ltd.
Liquidity position of the companies could be said as adequate as the ratio is more than 1.
2019 2018 2017
0.00
0.20
0.40
0.60
0.80
1.00
1.20
1.40
1.60
1.80
2.00
0.24
0.45 0.39
1.49
1.72 1.59
Aspermont ltd
Exponential
(Aspermont ltd)
Enero Group
Exponential (Enero
Group)
Figure 1 : Current Ratio
Liquidity position of the Enero Group shows a declining trend that shows liquidity
position of the company is falling. A company must have enough current assets for meeting the
short term obligations. Trend is showing fluctuations in the three years and company is required
2
Secure Best Marks with AI Grader
Need help grading? Try our AI Grader for instant feedback on your assignments.
to manage the operations of the business for strengthening the liquidity position. As the company
belongs to service sector considerable difference is not seen between the current and quick ratios.
On the other competitor Aspermont is having very weak liquidity position. Company is
striving to maintain its liquidity position. Current ratio of Aspermont shows that it is not able to
pay the short term liabilities from the available current assets (Shapiro and Hanouna, 2019). If
the liquidity position is not stabilised in short term company face shut down in near future. By
evaluating the liquidity position of both the firms it could be said that the Enero group is having
strong liquidity position as compared with other competitor group. However it has to maintain
the stability of the current ratio by managing the cash cycle and efficiency in managing the
operations of business.
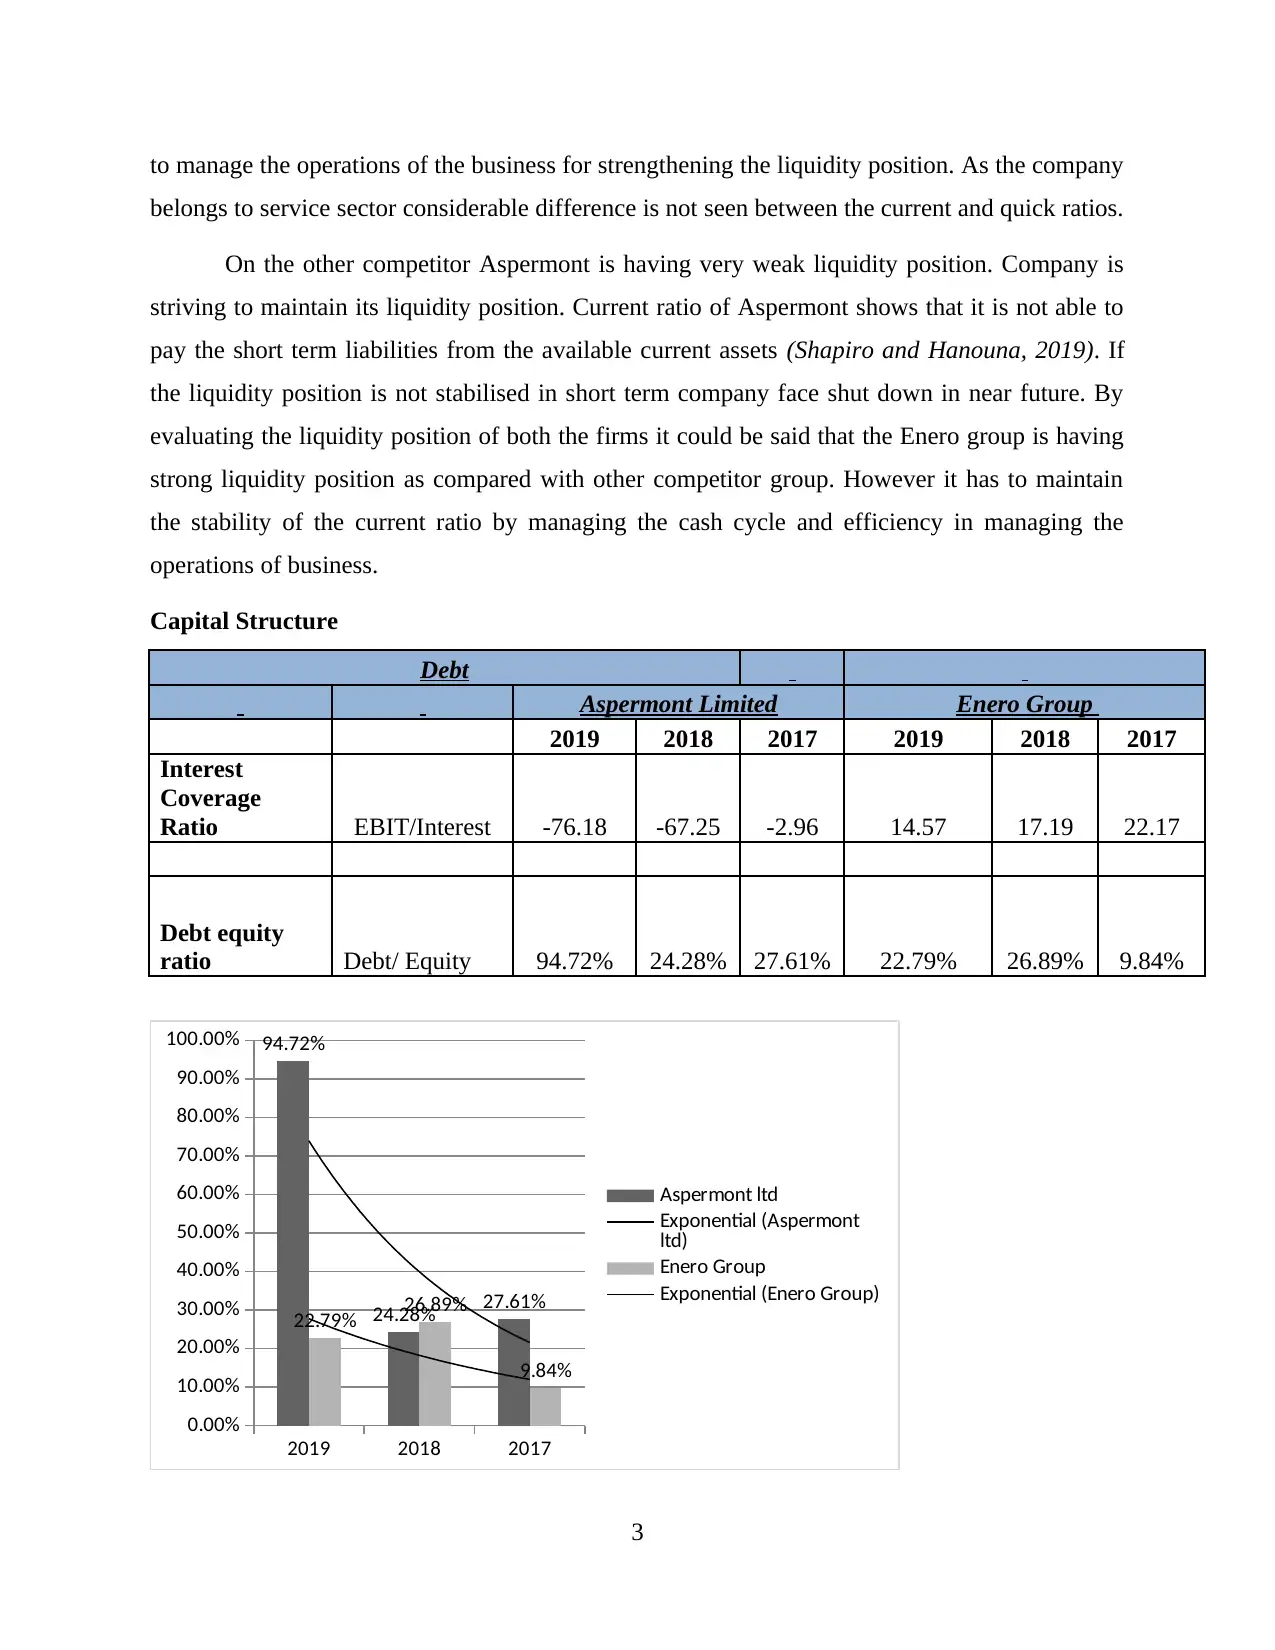
Capital Structure
Debt
Aspermont Limited Enero Group
2019 2018 2017 2019 2018 2017
Interest
Coverage
Ratio EBIT/Interest -76.18 -67.25 -2.96 14.57 17.19 22.17
Debt equity
ratio Debt/ Equity 94.72% 24.28% 27.61% 22.79% 26.89% 9.84%
2019 2018 2017
0.00%
10.00%
20.00%
30.00%
40.00%
50.00%
60.00%
70.00%
80.00%
90.00%
100.00% 94.72%
24.28% 27.61%
22.79% 26.89%
9.84%
Aspermont ltd
Exponential (Aspermont
ltd)
Enero Group
Exponential (Enero Group)
3
belongs to service sector considerable difference is not seen between the current and quick ratios.
On the other competitor Aspermont is having very weak liquidity position. Company is
striving to maintain its liquidity position. Current ratio of Aspermont shows that it is not able to
pay the short term liabilities from the available current assets (Shapiro and Hanouna, 2019). If
the liquidity position is not stabilised in short term company face shut down in near future. By
evaluating the liquidity position of both the firms it could be said that the Enero group is having
strong liquidity position as compared with other competitor group. However it has to maintain
the stability of the current ratio by managing the cash cycle and efficiency in managing the
operations of business.
Capital Structure
Debt
Aspermont Limited Enero Group
2019 2018 2017 2019 2018 2017
Interest
Coverage
Ratio EBIT/Interest -76.18 -67.25 -2.96 14.57 17.19 22.17
Debt equity
ratio Debt/ Equity 94.72% 24.28% 27.61% 22.79% 26.89% 9.84%
2019 2018 2017
0.00%
10.00%
20.00%
30.00%
40.00%
50.00%
60.00%
70.00%
80.00%
90.00%
100.00% 94.72%
24.28% 27.61%
22.79% 26.89%
9.84%
Aspermont ltd
Exponential (Aspermont
ltd)
Enero Group
Exponential (Enero Group)
3
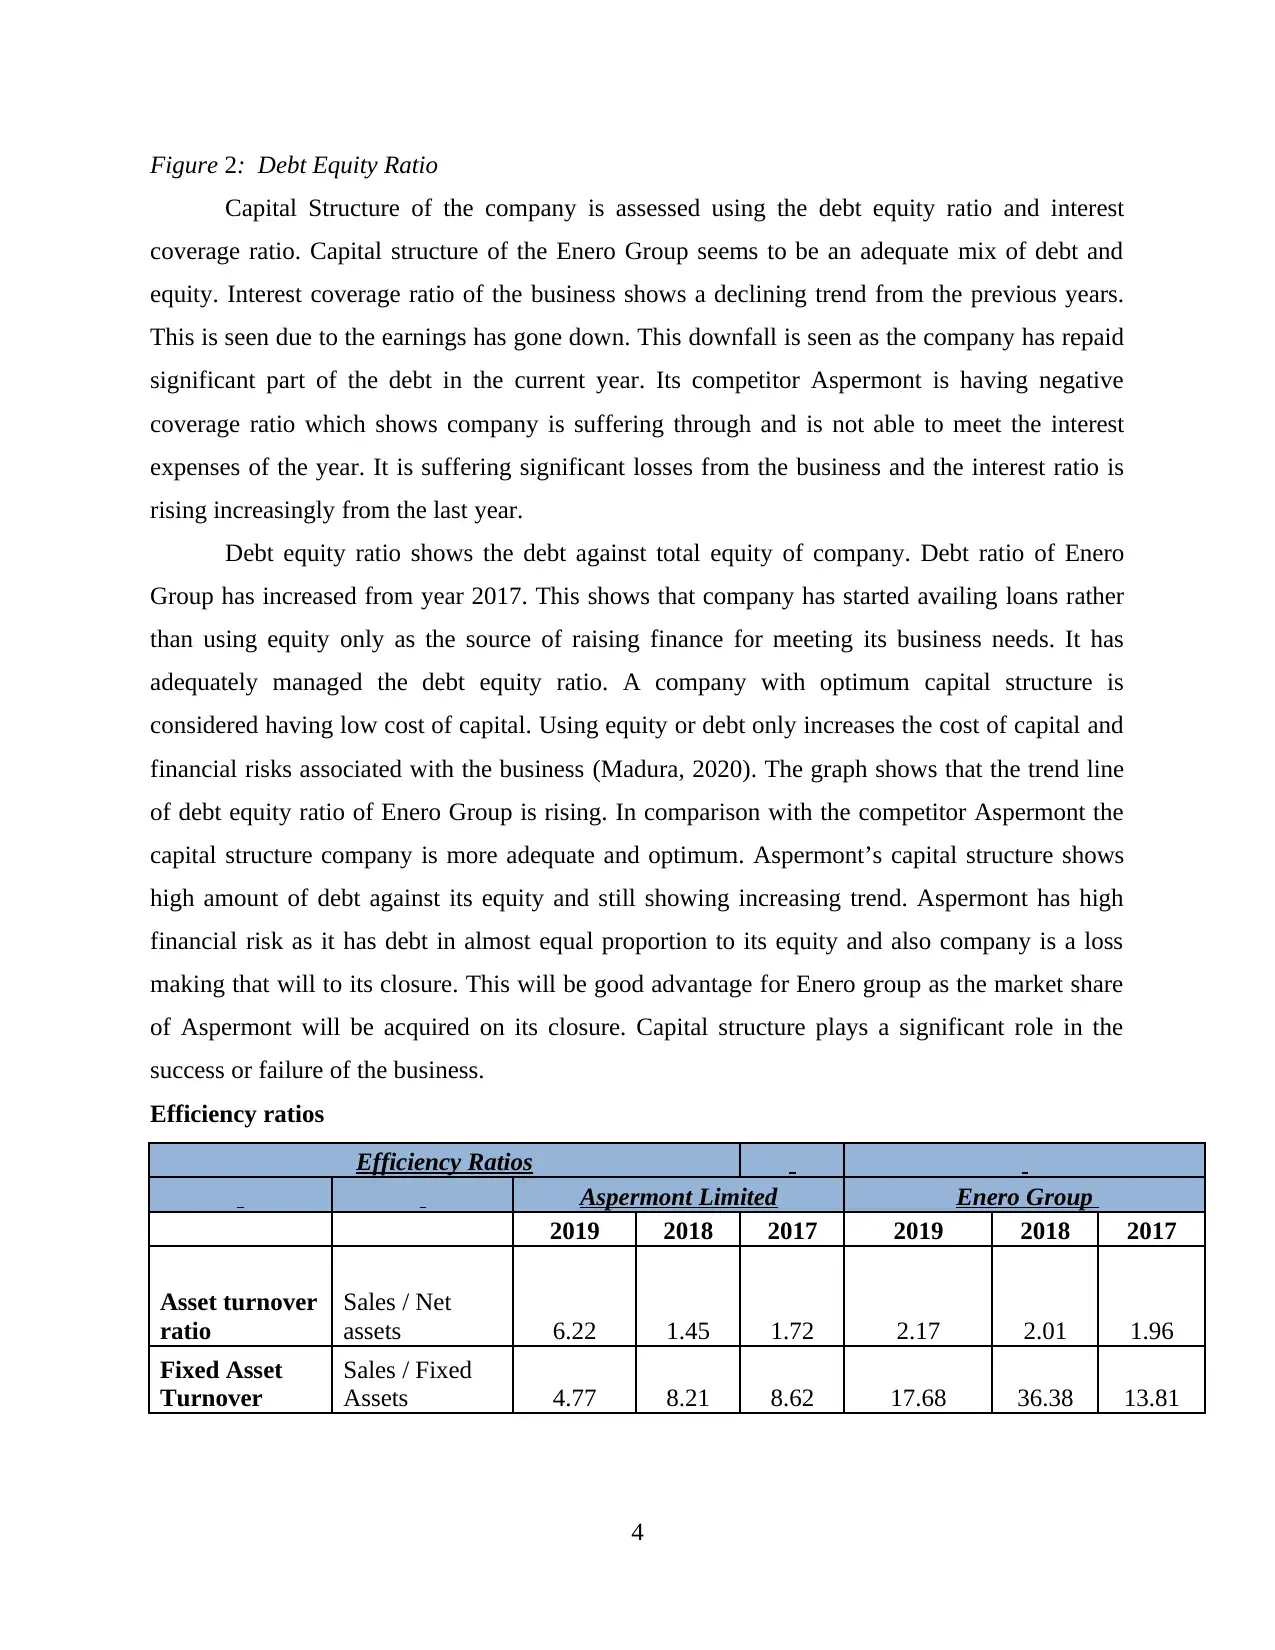
Figure 2: Debt Equity Ratio
Capital Structure of the company is assessed using the debt equity ratio and interest
coverage ratio. Capital structure of the Enero Group seems to be an adequate mix of debt and
equity. Interest coverage ratio of the business shows a declining trend from the previous years.
This is seen due to the earnings has gone down. This downfall is seen as the company has repaid
significant part of the debt in the current year. Its competitor Aspermont is having negative
coverage ratio which shows company is suffering through and is not able to meet the interest
expenses of the year. It is suffering significant losses from the business and the interest ratio is
rising increasingly from the last year.
Debt equity ratio shows the debt against total equity of company. Debt ratio of Enero
Group has increased from year 2017. This shows that company has started availing loans rather
than using equity only as the source of raising finance for meeting its business needs. It has
adequately managed the debt equity ratio. A company with optimum capital structure is
considered having low cost of capital. Using equity or debt only increases the cost of capital and
financial risks associated with the business (Madura, 2020). The graph shows that the trend line
of debt equity ratio of Enero Group is rising. In comparison with the competitor Aspermont the
capital structure company is more adequate and optimum. Aspermont’s capital structure shows
high amount of debt against its equity and still showing increasing trend. Aspermont has high
financial risk as it has debt in almost equal proportion to its equity and also company is a loss
making that will to its closure. This will be good advantage for Enero group as the market share
of Aspermont will be acquired on its closure. Capital structure plays a significant role in the
success or failure of the business.
Efficiency ratios
Efficiency Ratios
Aspermont Limited Enero Group
2019 2018 2017 2019 2018 2017
Asset turnover
ratio
Sales / Net
assets 6.22 1.45 1.72 2.17 2.01 1.96
Fixed Asset
Turnover
Sales / Fixed
Assets 4.77 8.21 8.62 17.68 36.38 13.81
4
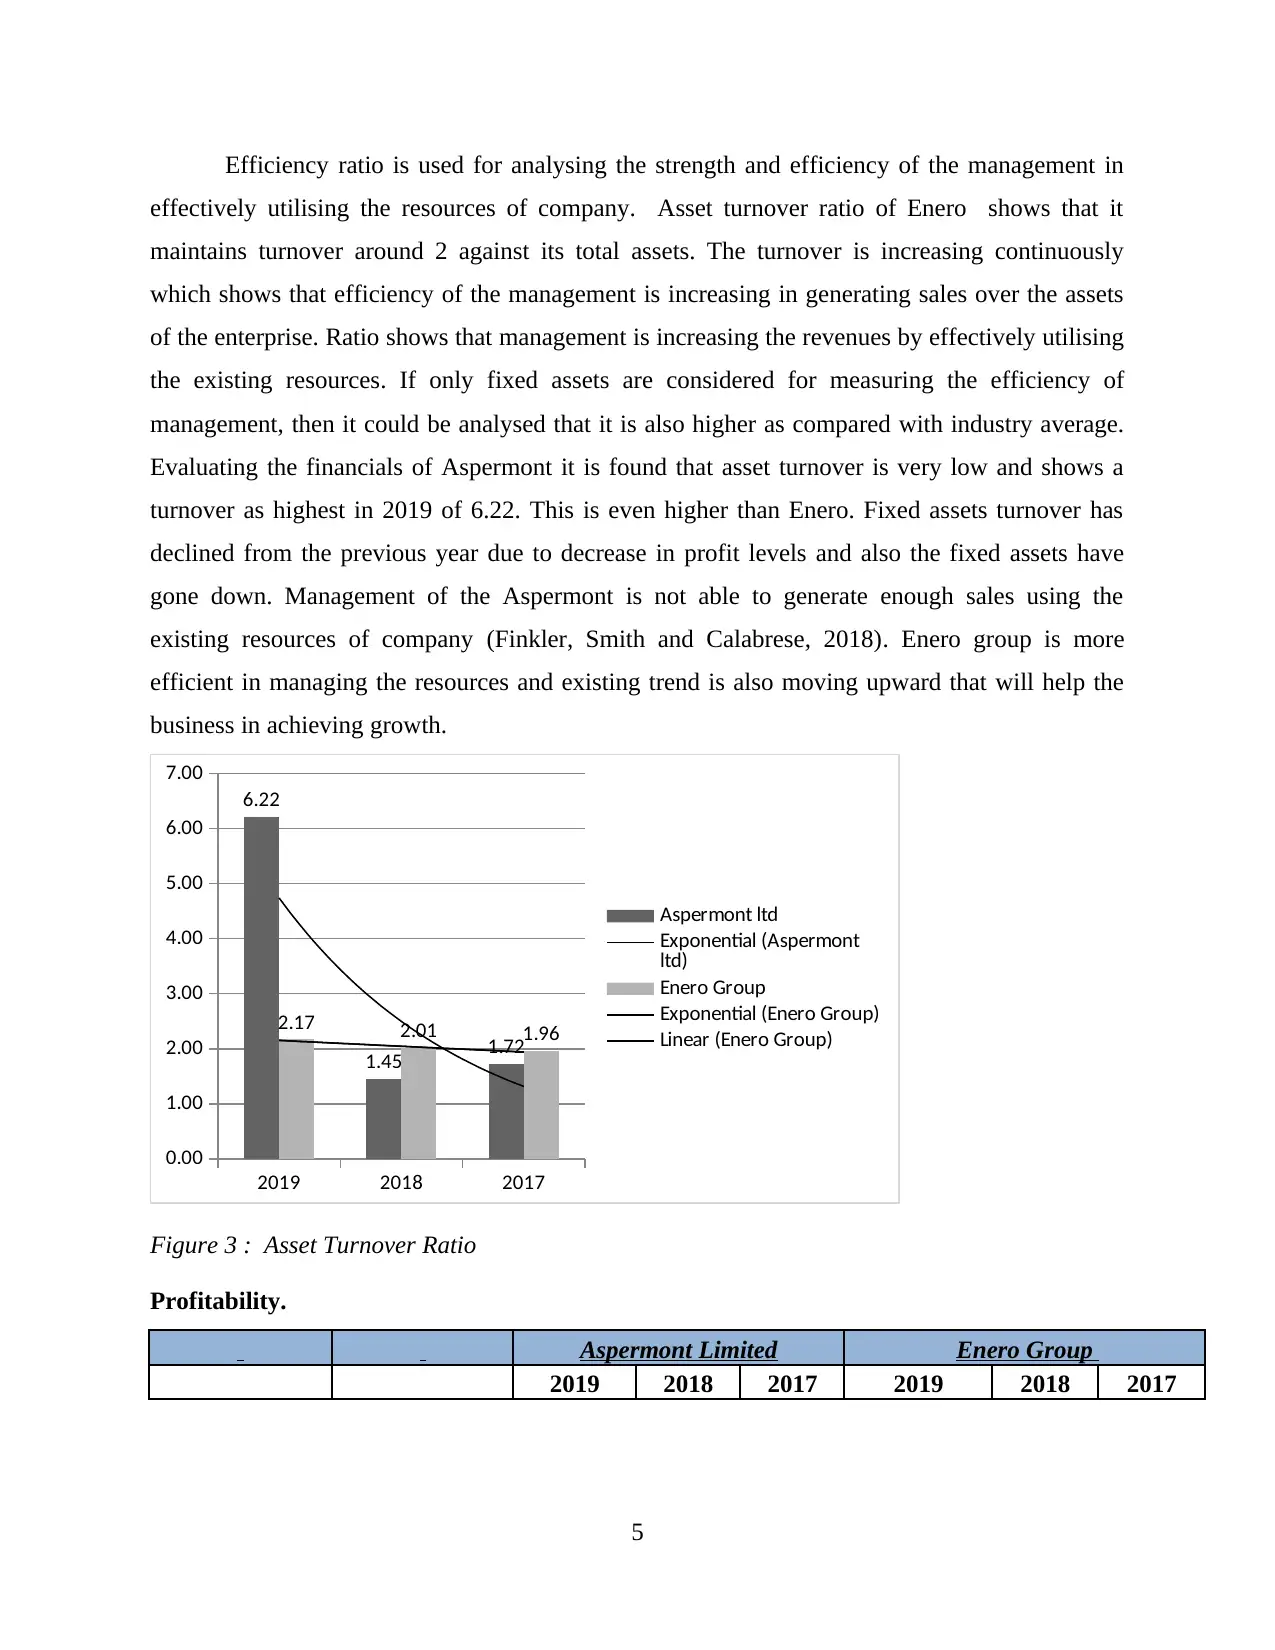
Efficiency ratio is used for analysing the strength and efficiency of the management in
effectively utilising the resources of company. Asset turnover ratio of Enero shows that it
maintains turnover around 2 against its total assets. The turnover is increasing continuously
which shows that efficiency of the management is increasing in generating sales over the assets
of the enterprise. Ratio shows that management is increasing the revenues by effectively utilising
the existing resources. If only fixed assets are considered for measuring the efficiency of
management, then it could be analysed that it is also higher as compared with industry average.
Evaluating the financials of Aspermont it is found that asset turnover is very low and shows a
turnover as highest in 2019 of 6.22. This is even higher than Enero. Fixed assets turnover has
declined from the previous year due to decrease in profit levels and also the fixed assets have
gone down. Management of the Aspermont is not able to generate enough sales using the
existing resources of company (Finkler, Smith and Calabrese, 2018). Enero group is more
efficient in managing the resources and existing trend is also moving upward that will help the
business in achieving growth.
2019 2018 2017
0.00
1.00
2.00
3.00
4.00
5.00
6.00
7.00
6.22
1.45 1.72
2.17 2.01 1.96
Aspermont ltd
Exponential (Aspermont
ltd)
Enero Group
Exponential (Enero Group)
Linear (Enero Group)
Figure 3 : Asset Turnover Ratio
Profitability.
Aspermont Limited Enero Group
2019 2018 2017 2019 2018 2017
5
Paraphrase This Document
Need a fresh take? Get an instant paraphrase of this document with our AI Paraphraser
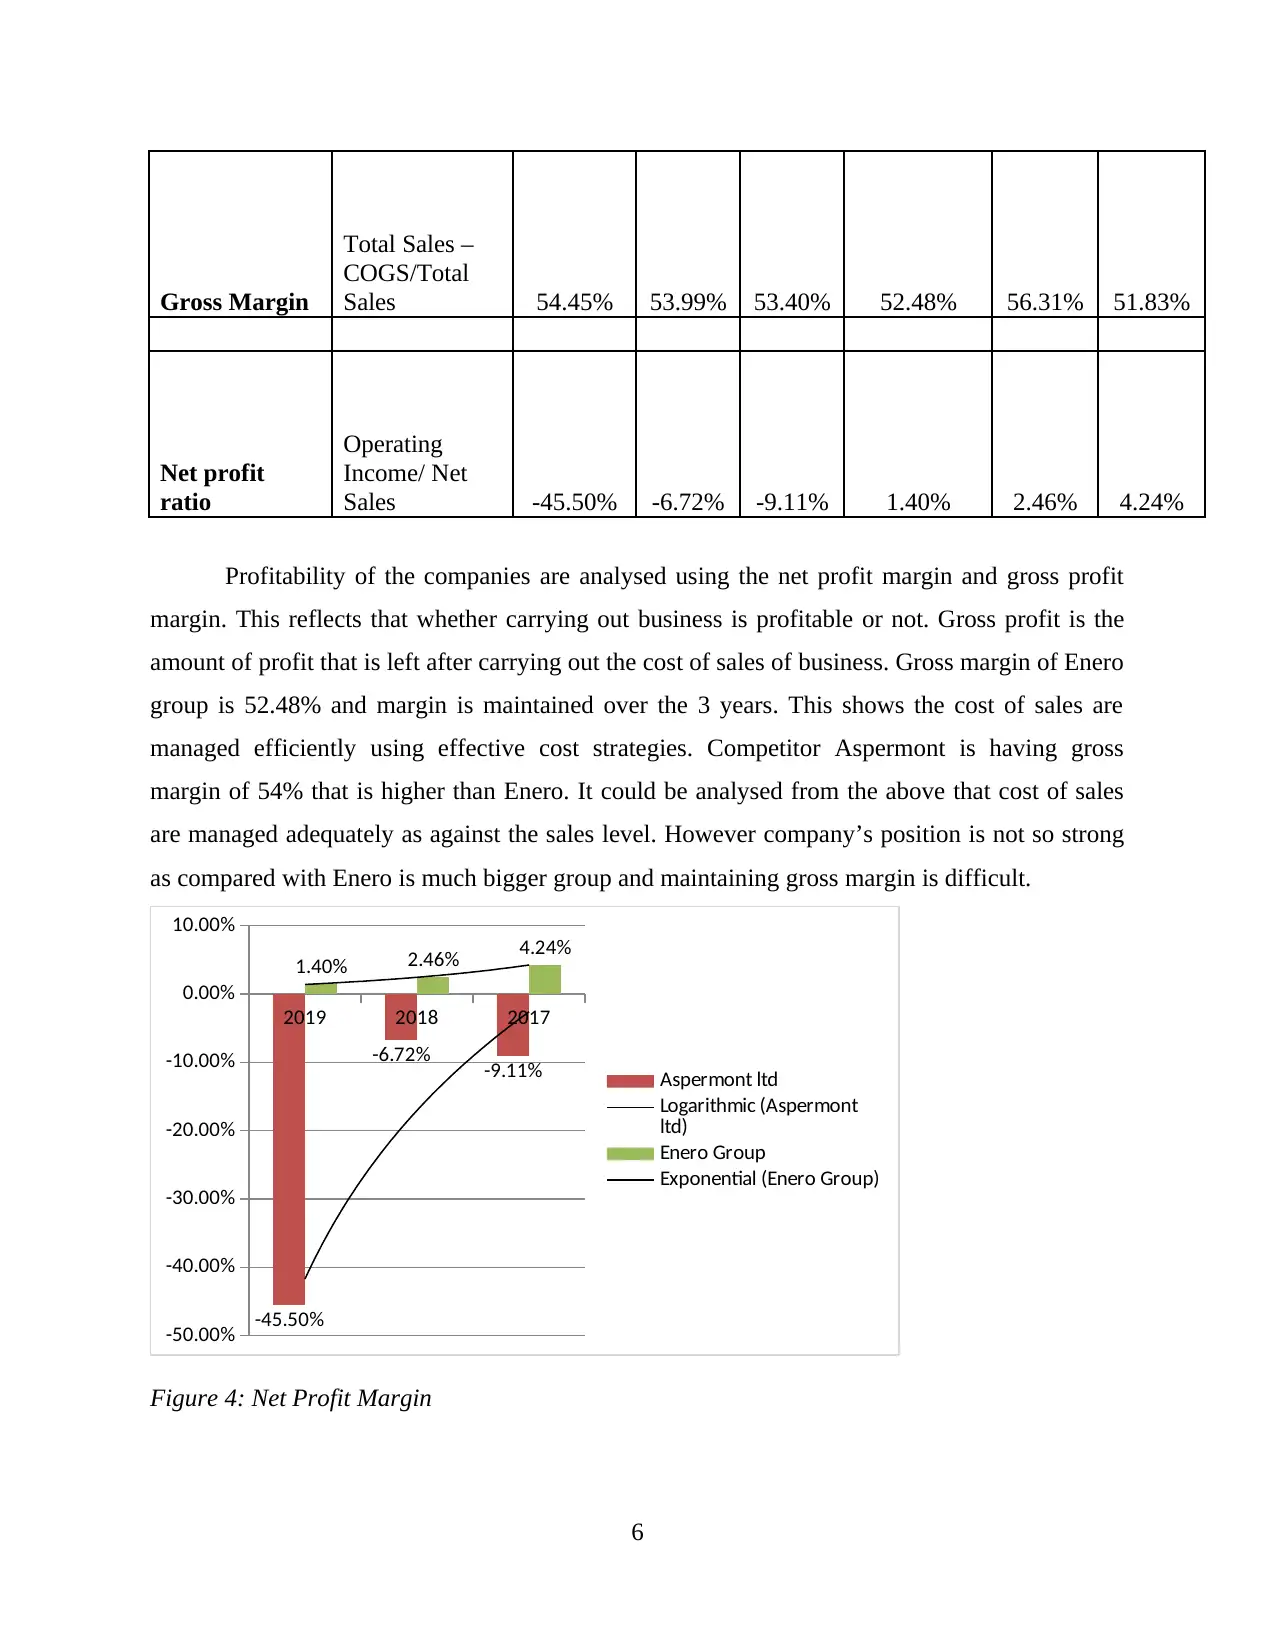
Gross Margin
Total Sales –
COGS/Total
Sales 54.45% 53.99% 53.40% 52.48% 56.31% 51.83%
Net profit
ratio
Operating
Income/ Net
Sales -45.50% -6.72% -9.11% 1.40% 2.46% 4.24%
Profitability of the companies are analysed using the net profit margin and gross profit
margin. This reflects that whether carrying out business is profitable or not. Gross profit is the
amount of profit that is left after carrying out the cost of sales of business. Gross margin of Enero
group is 52.48% and margin is maintained over the 3 years. This shows the cost of sales are
managed efficiently using effective cost strategies. Competitor Aspermont is having gross
margin of 54% that is higher than Enero. It could be analysed from the above that cost of sales
are managed adequately as against the sales level. However company’s position is not so strong
as compared with Enero is much bigger group and maintaining gross margin is difficult.
2019 2018 2017
-50.00%
-40.00%
-30.00%
-20.00%
-10.00%
0.00%
10.00%
-45.50%
-6.72% -9.11%
1.40% 2.46% 4.24%
Aspermont ltd
Logarithmic (Aspermont
ltd)
Enero Group
Exponential (Enero Group)
Figure 4: Net Profit Margin
6
The above trend analysis shows the net profit margin ratio of Enero Group and
Aspermont ltd. Net Profit margin is very essential for the business as it is the amount left after
covering all the costs and expenses associated with the business. Every business is carried out
with intent of earning reasonable profits for achieving the goals and objectives. A company must
earn adequate profits for the business. It could be seen that net profit margin of the Enero Group
is declining at the steady rate(Barr and McClellan, 2018). Profit margin has decreased to 1.40%
in 2019 from 4.24% in 2017 which is a considerable matter. Net profit margins of Aspermont on
the other are going downward steadily with sharp decline from -9.11% in 2017 to -45.50.
Company is increasingly making losses from last three years. If the attention towards
maintaining the profit margins is not paid by Enero then it may soon suffer the losses.
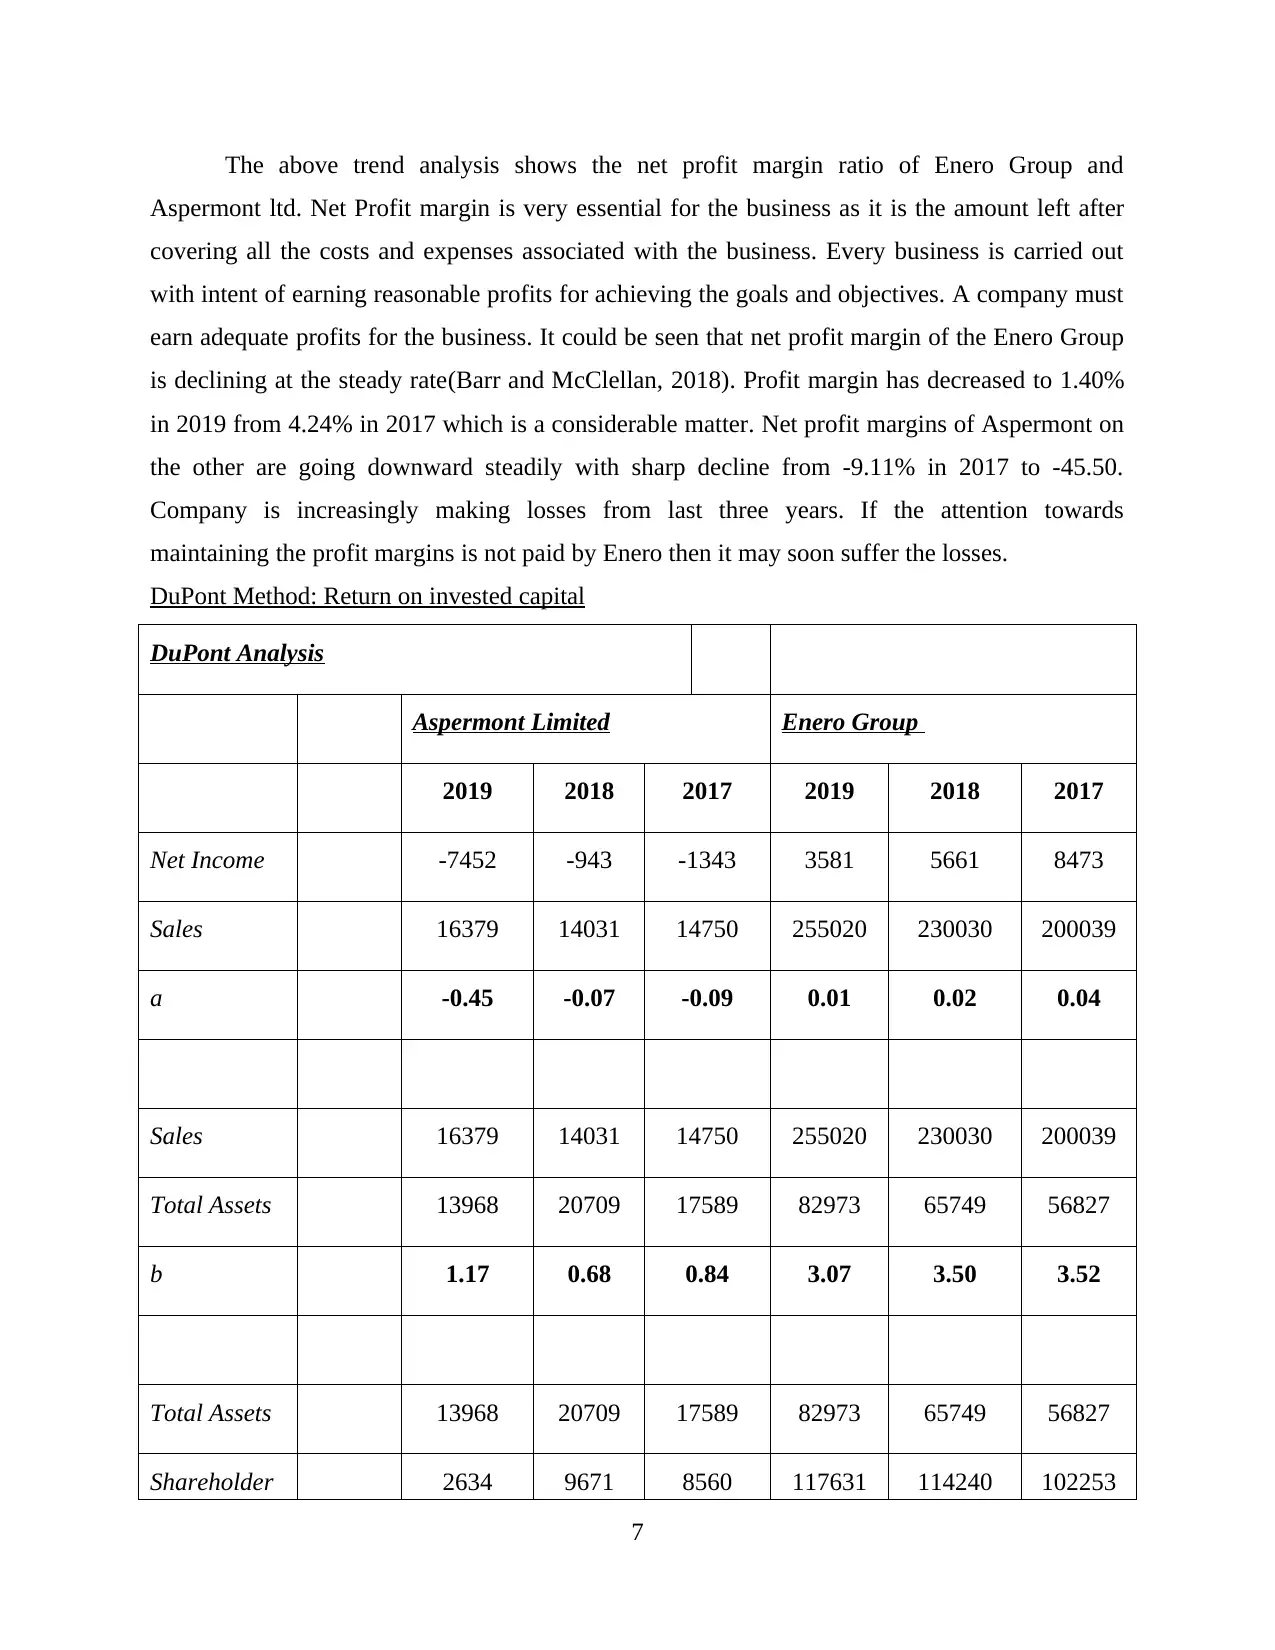
DuPont Method: Return on invested capital
DuPont Analysis
Aspermont Limited Enero Group
2019 2018 2017 2019 2018 2017
Net Income -7452 -943 -1343 3581 5661 8473
Sales 16379 14031 14750 255020 230030 200039
a -0.45 -0.07 -0.09 0.01 0.02 0.04
Sales 16379 14031 14750 255020 230030 200039
Total Assets 13968 20709 17589 82973 65749 56827
b 1.17 0.68 0.84 3.07 3.50 3.52
Total Assets 13968 20709 17589 82973 65749 56827
Shareholder 2634 9671 8560 117631 114240 102253
7
Aspermont ltd. Net Profit margin is very essential for the business as it is the amount left after
covering all the costs and expenses associated with the business. Every business is carried out
with intent of earning reasonable profits for achieving the goals and objectives. A company must
earn adequate profits for the business. It could be seen that net profit margin of the Enero Group
is declining at the steady rate(Barr and McClellan, 2018). Profit margin has decreased to 1.40%
in 2019 from 4.24% in 2017 which is a considerable matter. Net profit margins of Aspermont on
the other are going downward steadily with sharp decline from -9.11% in 2017 to -45.50.
Company is increasingly making losses from last three years. If the attention towards
maintaining the profit margins is not paid by Enero then it may soon suffer the losses.
DuPont Method: Return on invested capital
DuPont Analysis
Aspermont Limited Enero Group
2019 2018 2017 2019 2018 2017
Net Income -7452 -943 -1343 3581 5661 8473
Sales 16379 14031 14750 255020 230030 200039
a -0.45 -0.07 -0.09 0.01 0.02 0.04
Sales 16379 14031 14750 255020 230030 200039
Total Assets 13968 20709 17589 82973 65749 56827
b 1.17 0.68 0.84 3.07 3.50 3.52
Total Assets 13968 20709 17589 82973 65749 56827
Shareholder 2634 9671 8560 117631 114240 102253
7
Equity
c 5.30 2.14 2.05 0.71 0.58 0.56
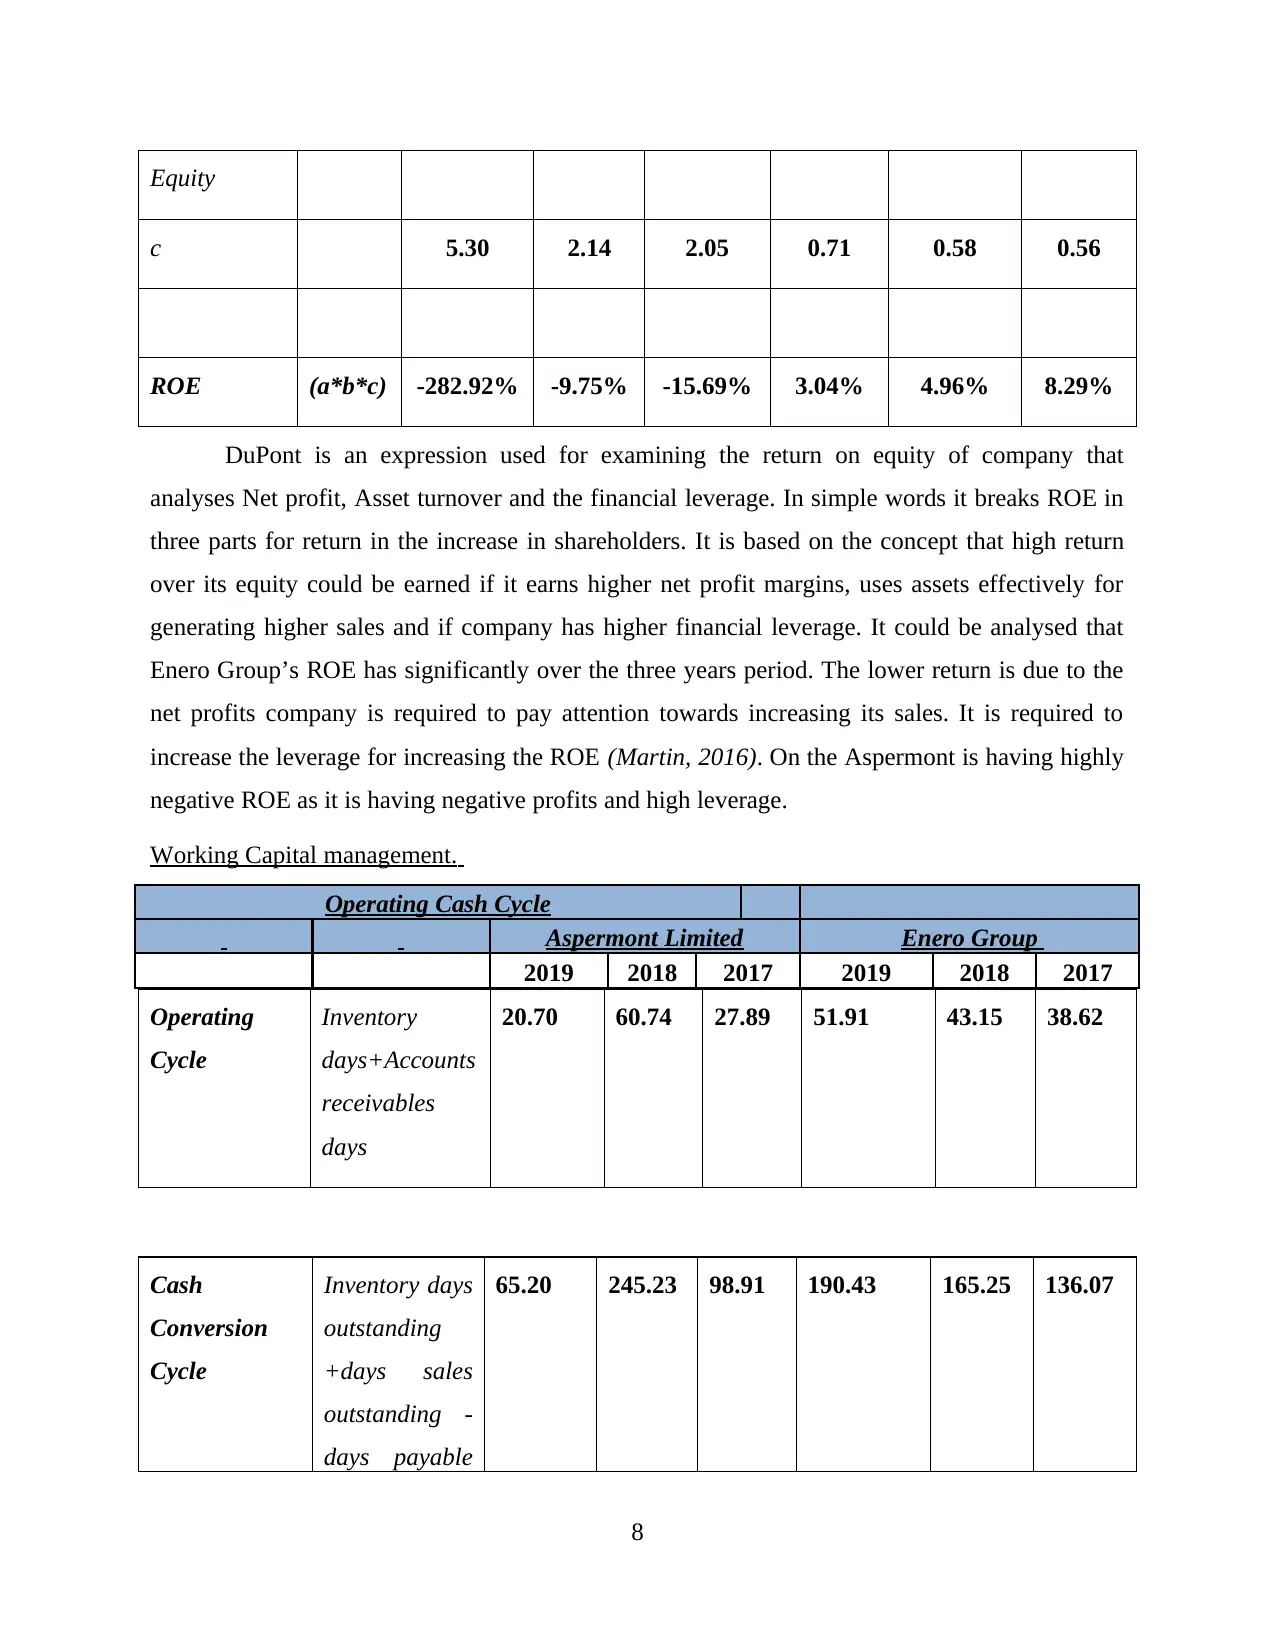
ROE (a*b*c) -282.92% -9.75% -15.69% 3.04% 4.96% 8.29%
DuPont is an expression used for examining the return on equity of company that
analyses Net profit, Asset turnover and the financial leverage. In simple words it breaks ROE in
three parts for return in the increase in shareholders. It is based on the concept that high return
over its equity could be earned if it earns higher net profit margins, uses assets effectively for
generating higher sales and if company has higher financial leverage. It could be analysed that
Enero Group’s ROE has significantly over the three years period. The lower return is due to the
net profits company is required to pay attention towards increasing its sales. It is required to
increase the leverage for increasing the ROE (Martin, 2016). On the Aspermont is having highly
negative ROE as it is having negative profits and high leverage.
Working Capital management.
Operating Cash Cycle
Aspermont Limited Enero Group
2019 2018 2017 2019 2018 2017
Operating
Cycle
Inventory
days+Accounts
receivables
days
20.70 60.74 27.89 51.91 43.15 38.62
Cash
Conversion
Cycle
Inventory days
outstanding
+days sales
outstanding -
days payable
65.20 245.23 98.91 190.43 165.25 136.07
8
c 5.30 2.14 2.05 0.71 0.58 0.56
ROE (a*b*c) -282.92% -9.75% -15.69% 3.04% 4.96% 8.29%
DuPont is an expression used for examining the return on equity of company that
analyses Net profit, Asset turnover and the financial leverage. In simple words it breaks ROE in
three parts for return in the increase in shareholders. It is based on the concept that high return
over its equity could be earned if it earns higher net profit margins, uses assets effectively for
generating higher sales and if company has higher financial leverage. It could be analysed that
Enero Group’s ROE has significantly over the three years period. The lower return is due to the
net profits company is required to pay attention towards increasing its sales. It is required to
increase the leverage for increasing the ROE (Martin, 2016). On the Aspermont is having highly
negative ROE as it is having negative profits and high leverage.
Working Capital management.
Operating Cash Cycle
Aspermont Limited Enero Group
2019 2018 2017 2019 2018 2017
Operating
Cycle
Inventory
days+Accounts
receivables
days
20.70 60.74 27.89 51.91 43.15 38.62
Cash
Conversion
Cycle
Inventory days
outstanding
+days sales
outstanding -
days payable
65.20 245.23 98.91 190.43 165.25 136.07
8
Secure Best Marks with AI Grader
Need help grading? Try our AI Grader for instant feedback on your assignments.
outstanding
2019 2018 2017
0.00
10.00
20.00
30.00
40.00
50.00
60.00
70.00
20.70
60.74
27.89
51.91
43.15
38.62 Aspermont ltd
Polynomial (Aspermont
ltd)
Enero Group
Polynomial (Enero Group)
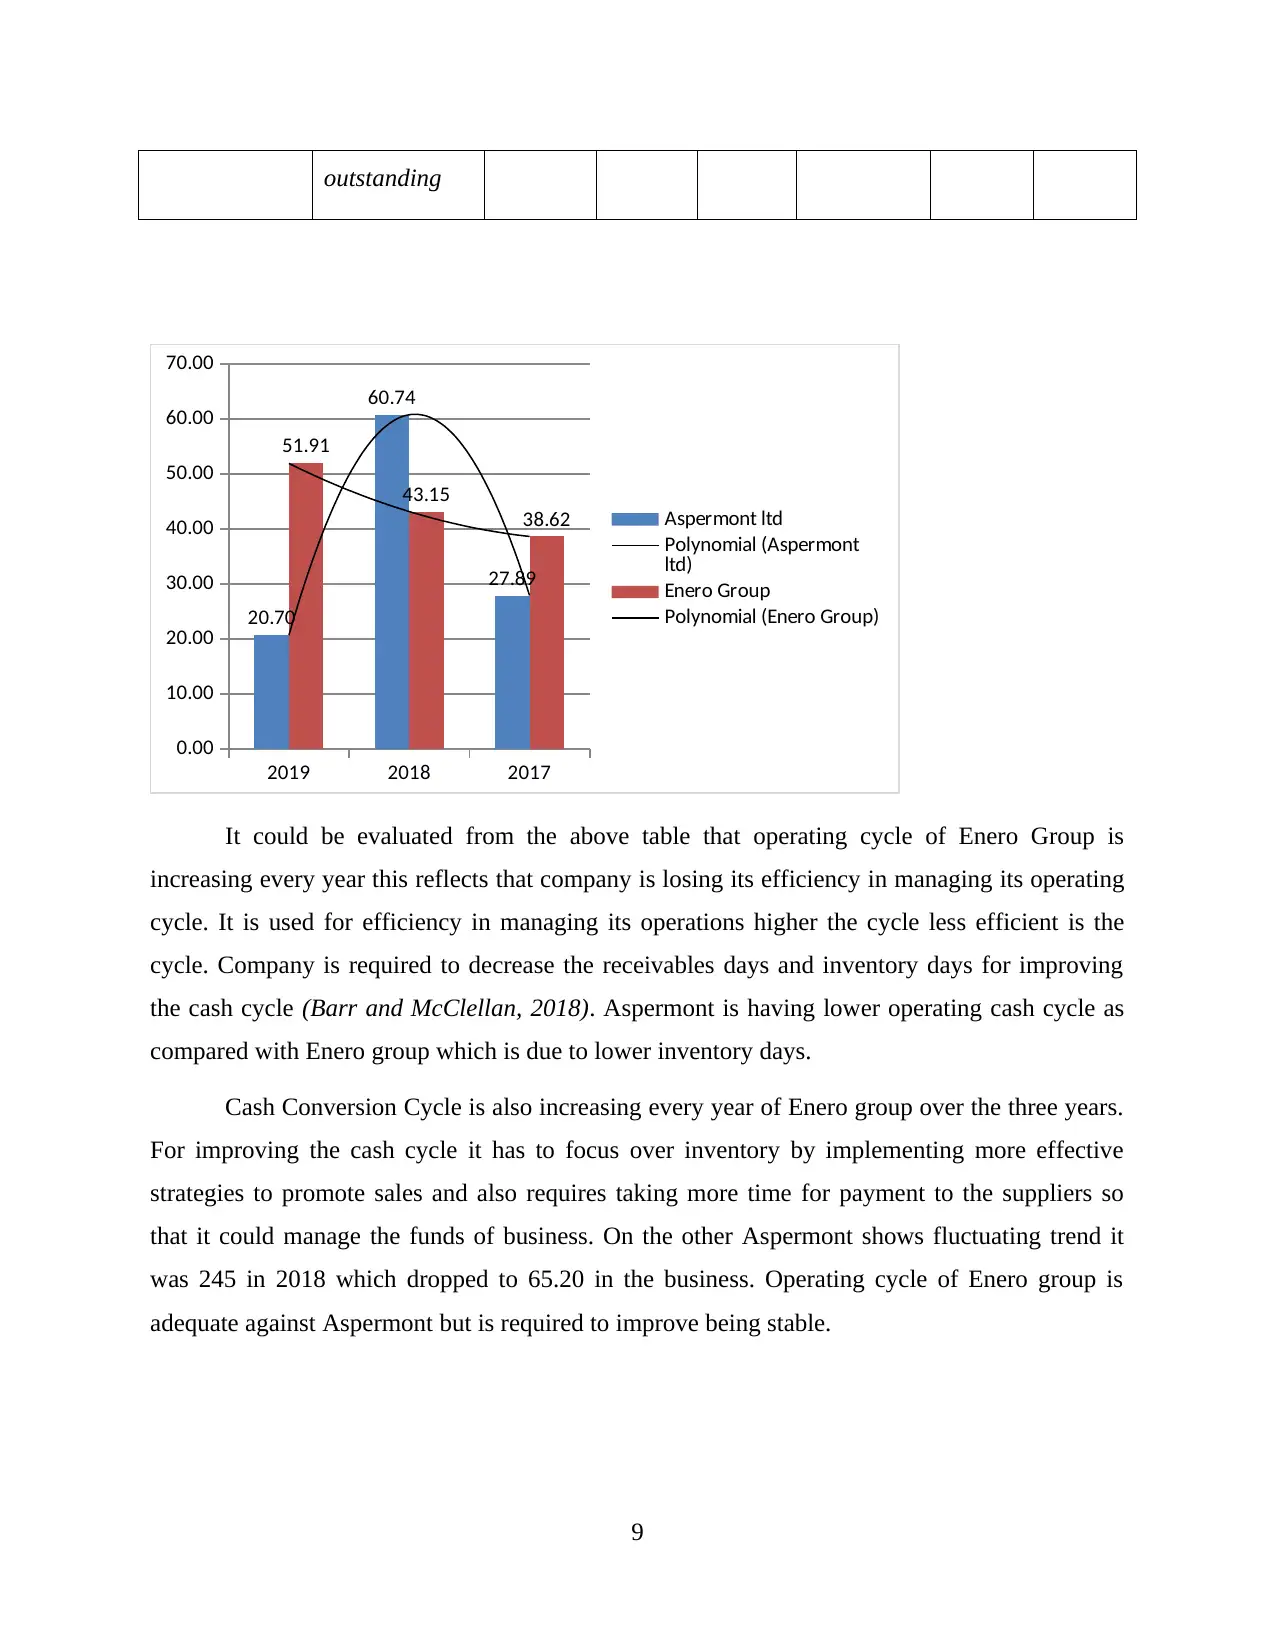
It could be evaluated from the above table that operating cycle of Enero Group is
increasing every year this reflects that company is losing its efficiency in managing its operating
cycle. It is used for efficiency in managing its operations higher the cycle less efficient is the
cycle. Company is required to decrease the receivables days and inventory days for improving
the cash cycle (Barr and McClellan, 2018). Aspermont is having lower operating cash cycle as
compared with Enero group which is due to lower inventory days.
Cash Conversion Cycle is also increasing every year of Enero group over the three years.
For improving the cash cycle it has to focus over inventory by implementing more effective
strategies to promote sales and also requires taking more time for payment to the suppliers so
that it could manage the funds of business. On the other Aspermont shows fluctuating trend it
was 245 in 2018 which dropped to 65.20 in the business. Operating cycle of Enero group is
adequate against Aspermont but is required to improve being stable.
9
2019 2018 2017
0.00
10.00
20.00
30.00
40.00
50.00
60.00
70.00
20.70
60.74
27.89
51.91
43.15
38.62 Aspermont ltd
Polynomial (Aspermont
ltd)
Enero Group
Polynomial (Enero Group)
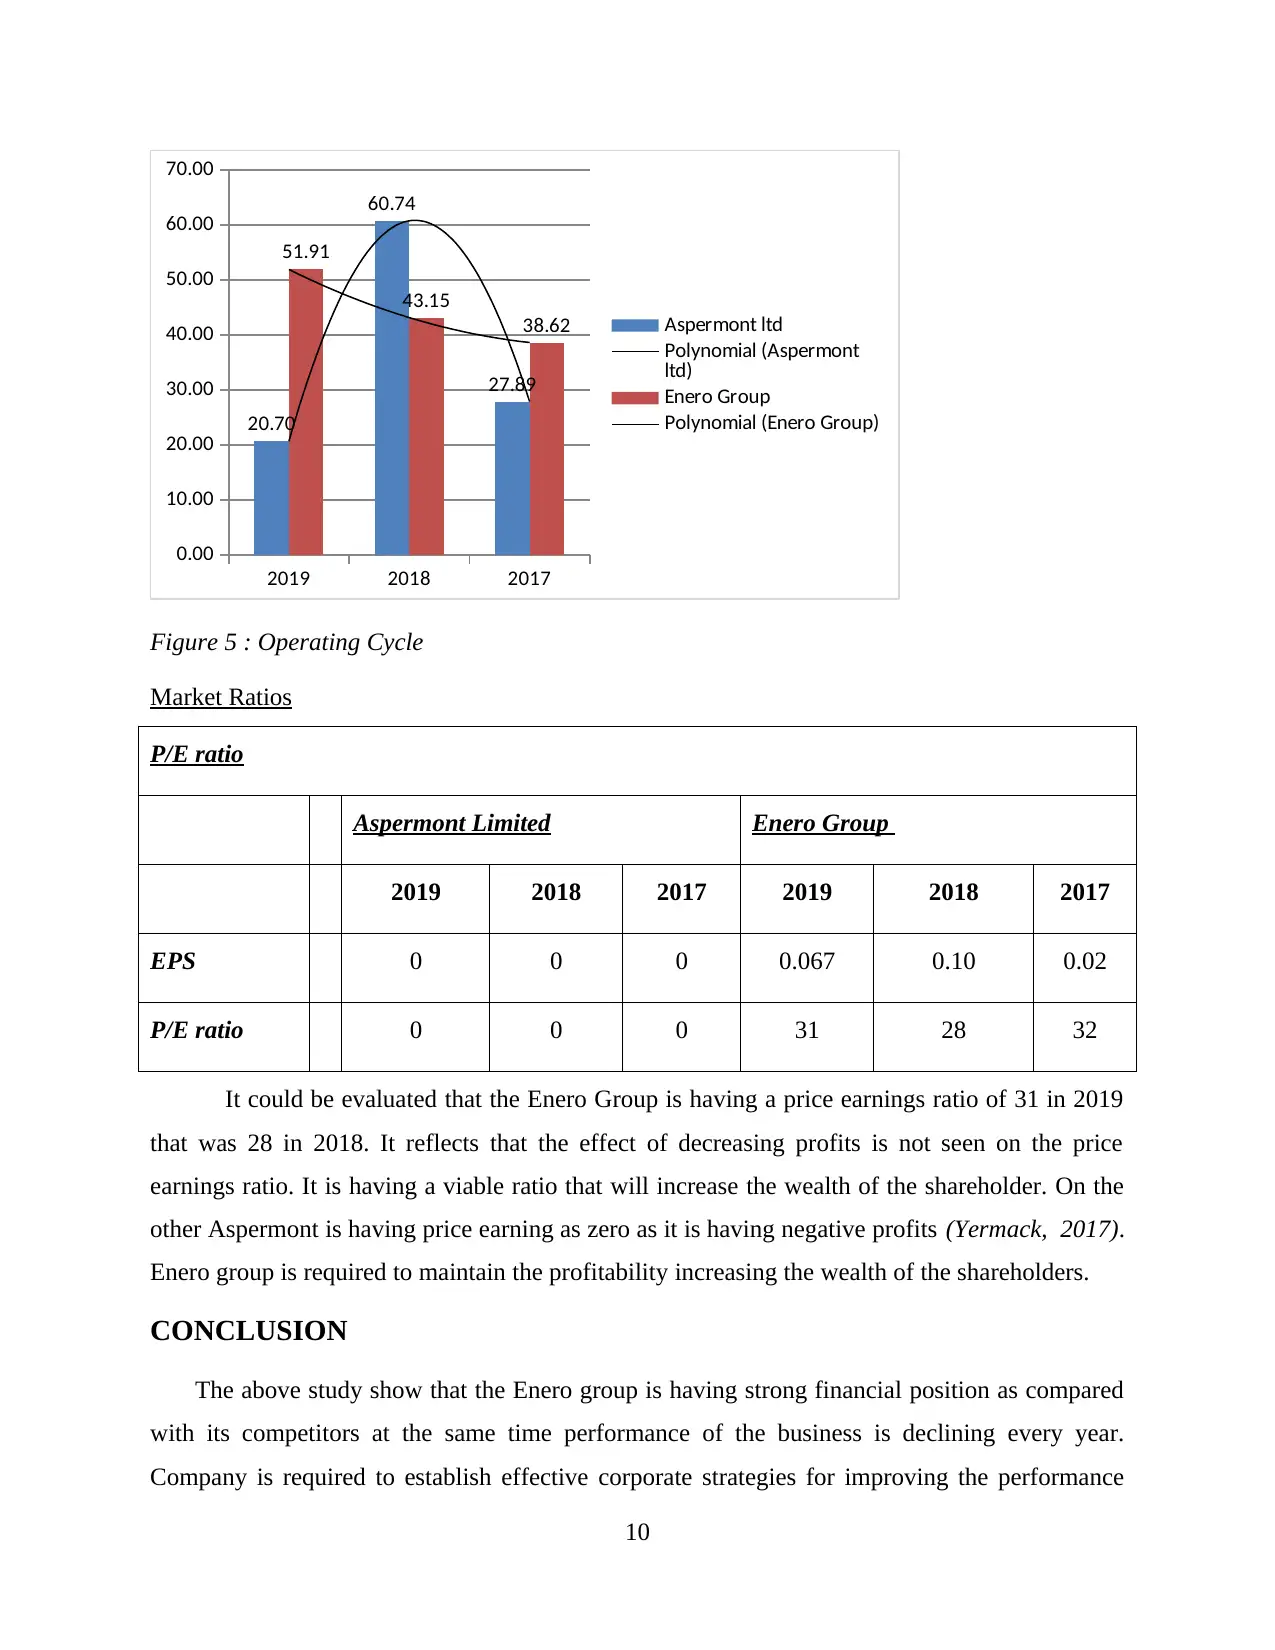
Figure 5 : Operating Cycle
Market Ratios
P/E ratio
Aspermont Limited Enero Group
2019 2018 2017 2019 2018 2017
EPS 0 0 0 0.067 0.10 0.02
P/E ratio 0 0 0 31 28 32
It could be evaluated that the Enero Group is having a price earnings ratio of 31 in 2019
that was 28 in 2018. It reflects that the effect of decreasing profits is not seen on the price
earnings ratio. It is having a viable ratio that will increase the wealth of the shareholder. On the
other Aspermont is having price earning as zero as it is having negative profits (Yermack, 2017).
Enero group is required to maintain the profitability increasing the wealth of the shareholders.
CONCLUSION
The above study show that the Enero group is having strong financial position as compared
with its competitors at the same time performance of the business is declining every year.
Company is required to establish effective corporate strategies for improving the performance
10
0.00
10.00
20.00
30.00
40.00
50.00
60.00
70.00
20.70
60.74
27.89
51.91
43.15
38.62 Aspermont ltd
Polynomial (Aspermont
ltd)
Enero Group
Polynomial (Enero Group)
Figure 5 : Operating Cycle
Market Ratios
P/E ratio
Aspermont Limited Enero Group
2019 2018 2017 2019 2018 2017
EPS 0 0 0 0.067 0.10 0.02
P/E ratio 0 0 0 31 28 32
It could be evaluated that the Enero Group is having a price earnings ratio of 31 in 2019
that was 28 in 2018. It reflects that the effect of decreasing profits is not seen on the price
earnings ratio. It is having a viable ratio that will increase the wealth of the shareholder. On the
other Aspermont is having price earning as zero as it is having negative profits (Yermack, 2017).
Enero group is required to maintain the profitability increasing the wealth of the shareholders.
CONCLUSION
The above study show that the Enero group is having strong financial position as compared
with its competitors at the same time performance of the business is declining every year.
Company is required to establish effective corporate strategies for improving the performance
10

and increasing the profitability. Since the above firms are service industry ROE and operating
cash cycle could not be evaluated adequately as company do not have inventory or is very less.
11
cash cycle could not be evaluated adequately as company do not have inventory or is very less.
11
Paraphrase This Document
Need a fresh take? Get an instant paraphrase of this document with our AI Paraphraser
REFERENCES
Books and Journals
Shapiro, A.C. and Hanouna, P., 2019. Multinational financial management. Wiley.
Madura, J., 2020. International financial management. Cengage Learning.
Jones, C. and et.al., 2018. Financial Management for Nurse Managers and Executives-E-Book.
Elsevier Health Sciences.
Finkler, S.A., Smith, D.L. and Calabrese, T.D., 2018. Financial management for public, health,
and not-for-profit organizations. CQ Press.
Barr, M.J. and McClellan, G.S., 2018. Budgets and financial management in higher education.
John Wiley & Sons.
Martin, L.L., 2016. Financial management for human service administrators. Waveland Press.
Yermack, D., 2017. Donor governance and financial management in prominent US art
museums. Journal of Cultural Economics.41(3). pp.215-235.
Online
Enero Group. 2019. [Online]. Available through :
< https://au.finance.yahoo.com/quote/EGG.AX/balance-sheet?p=EGG.AX>.
12
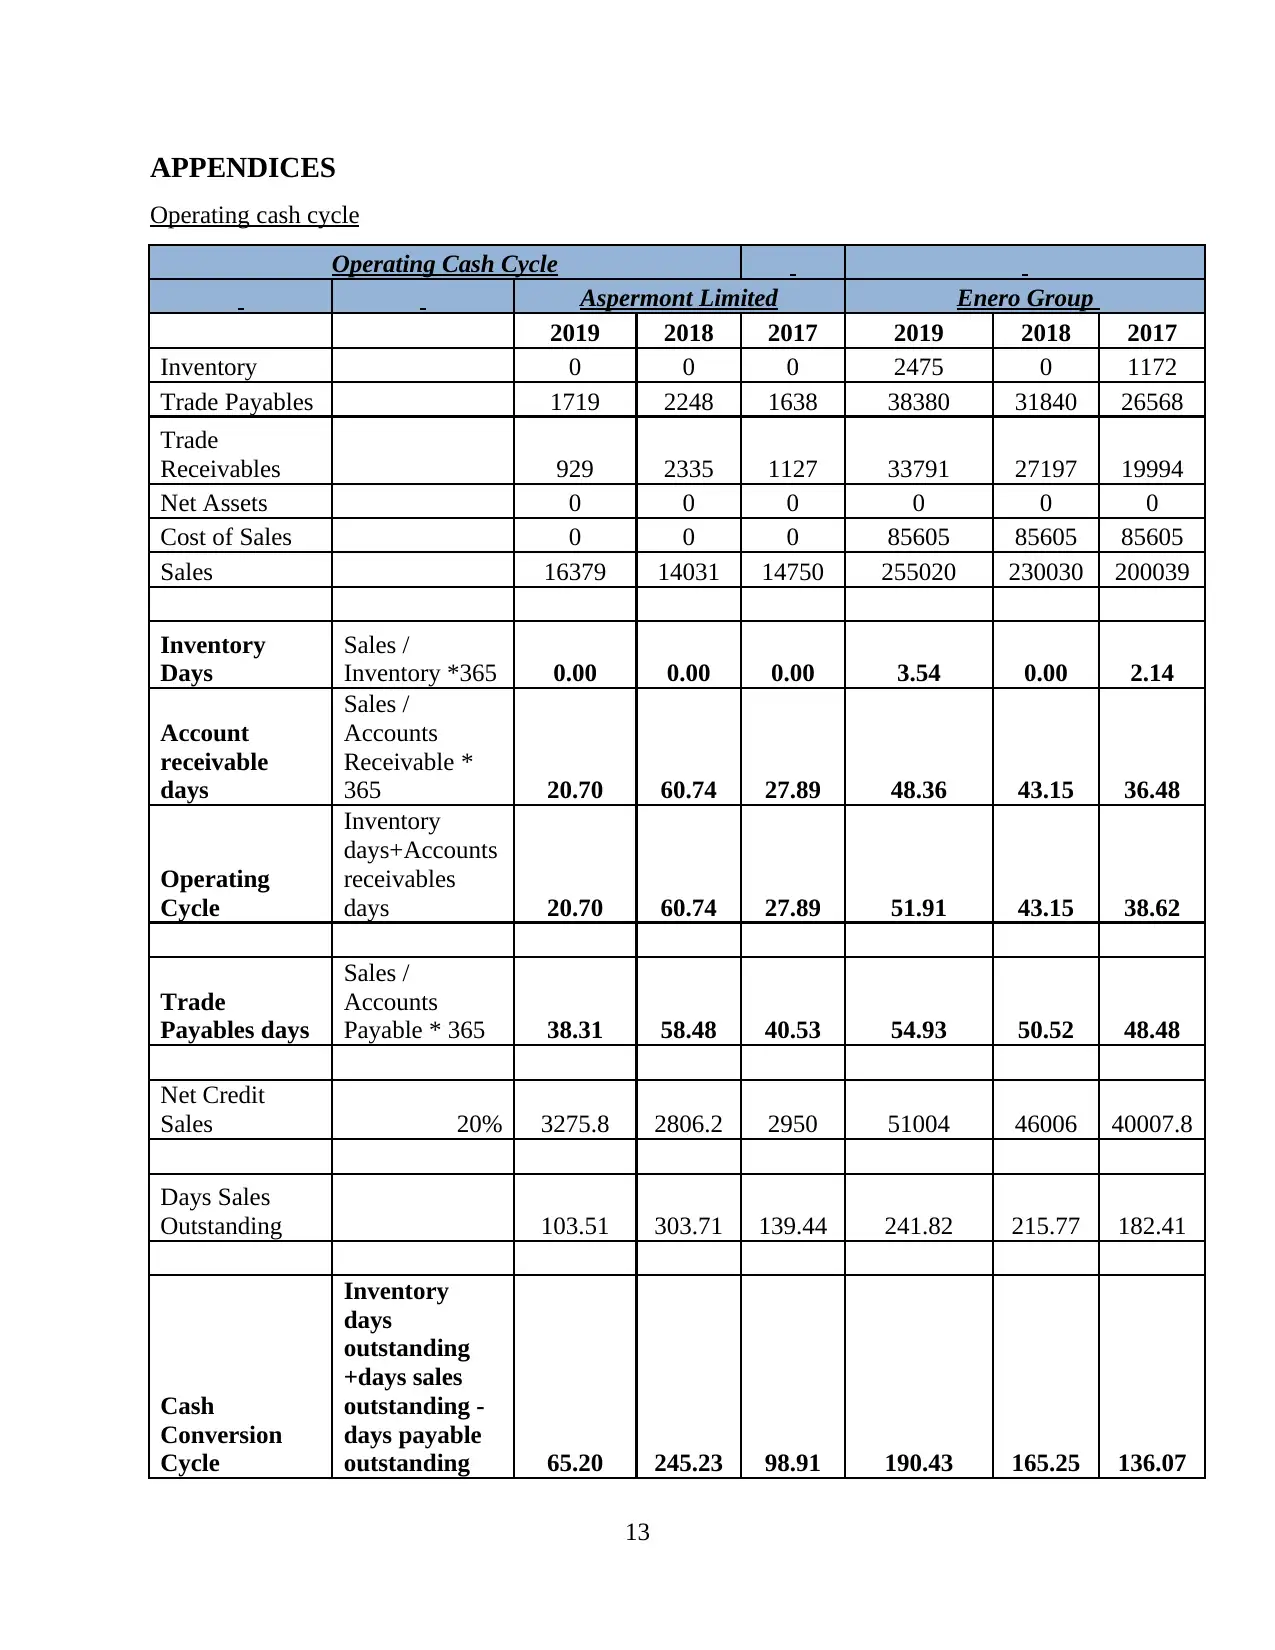
APPENDICES
Operating cash cycle
Operating Cash Cycle
Aspermont Limited Enero Group
2019 2018 2017 2019 2018 2017
Inventory 0 0 0 2475 0 1172
Trade Payables 1719 2248 1638 38380 31840 26568
Trade
Receivables 929 2335 1127 33791 27197 19994
Net Assets 0 0 0 0 0 0
Cost of Sales 0 0 0 85605 85605 85605
Sales 16379 14031 14750 255020 230030 200039
Inventory
Days
Sales /
Inventory *365 0.00 0.00 0.00 3.54 0.00 2.14
Account
receivable
days
Sales /
Accounts
Receivable *
365 20.70 60.74 27.89 48.36 43.15 36.48
Operating
Cycle
Inventory
days+Accounts
receivables
days 20.70 60.74 27.89 51.91 43.15 38.62
Trade
Payables days
Sales /
Accounts
Payable * 365 38.31 58.48 40.53 54.93 50.52 48.48
Net Credit
Sales 20% 3275.8 2806.2 2950 51004 46006 40007.8
Days Sales
Outstanding 103.51 303.71 139.44 241.82 215.77 182.41
Cash
Conversion
Cycle
Inventory
days
outstanding
+days sales
outstanding -
days payable
outstanding 65.20 245.23 98.91 190.43 165.25 136.07
13
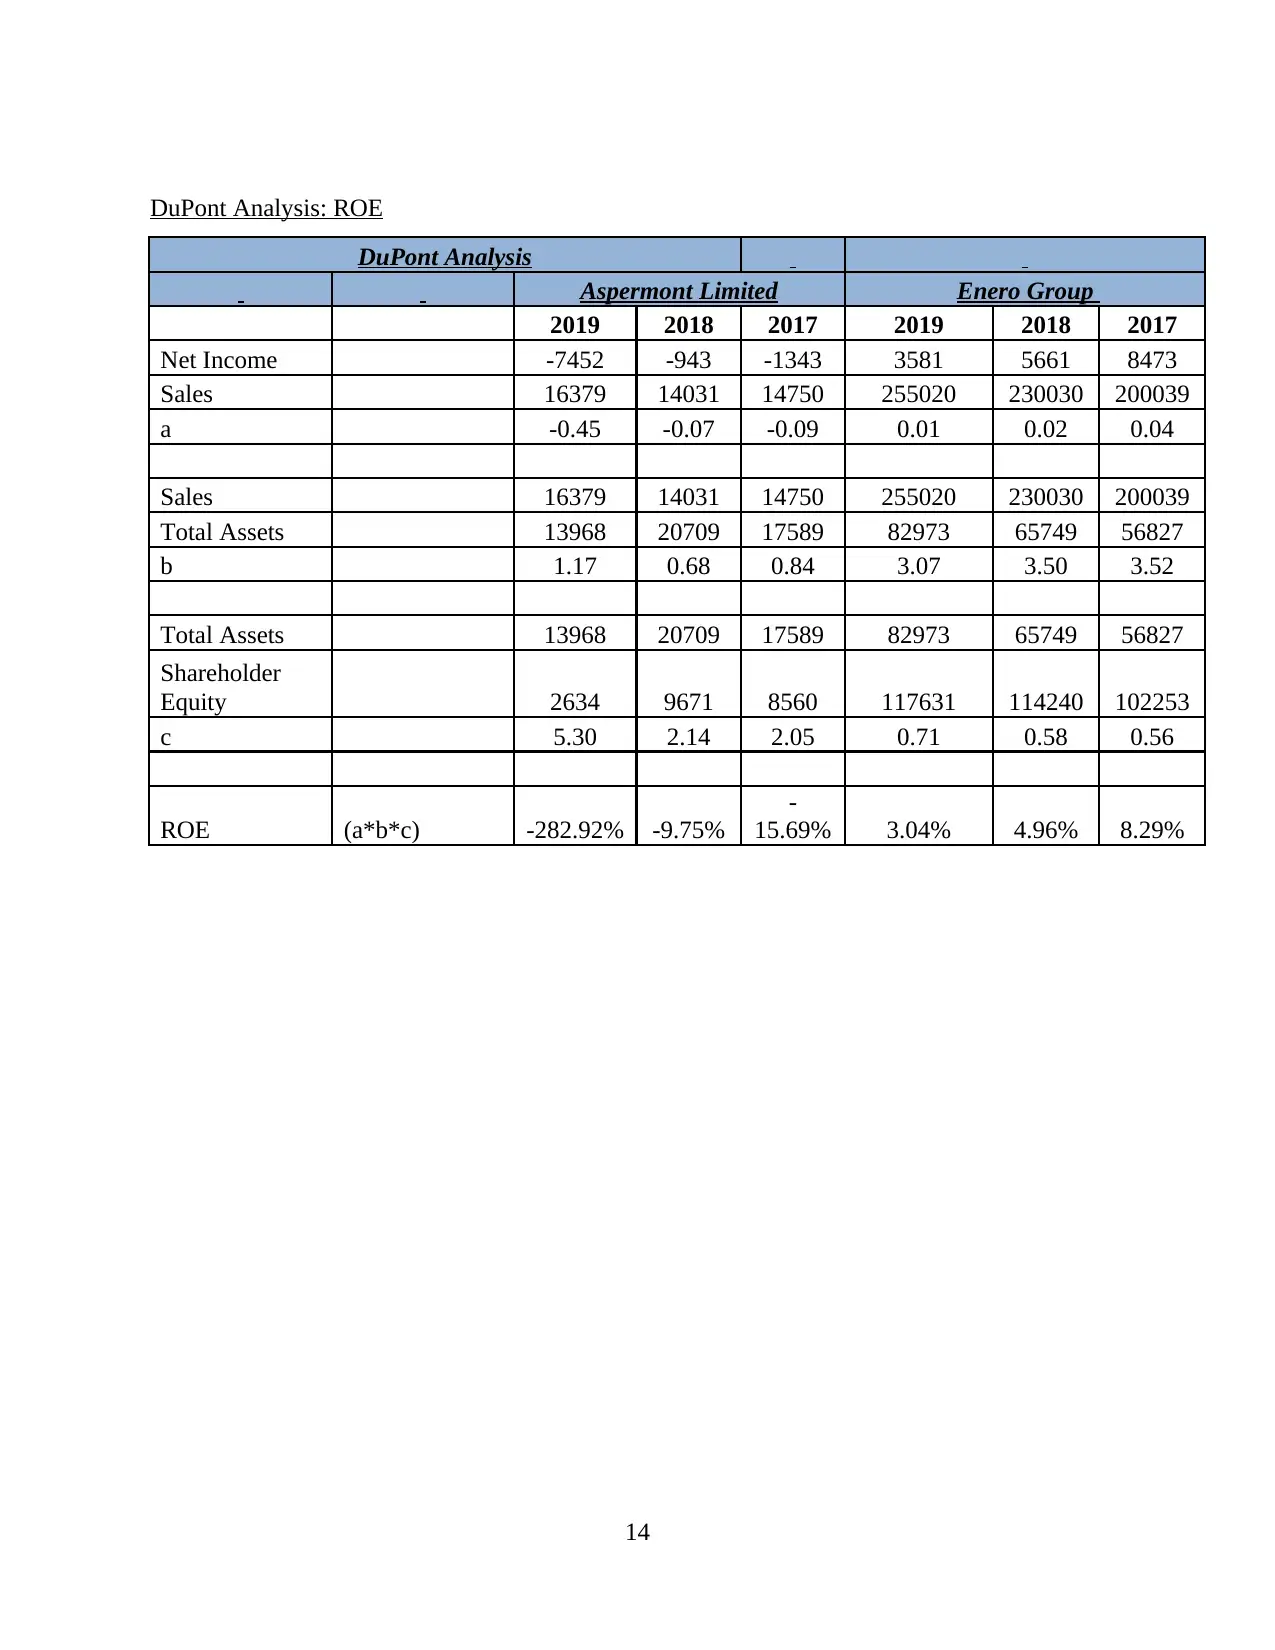
DuPont Analysis: ROE
DuPont Analysis
Aspermont Limited Enero Group
2019 2018 2017 2019 2018 2017
Net Income -7452 -943 -1343 3581 5661 8473
Sales 16379 14031 14750 255020 230030 200039
a -0.45 -0.07 -0.09 0.01 0.02 0.04
Sales 16379 14031 14750 255020 230030 200039
Total Assets 13968 20709 17589 82973 65749 56827
b 1.17 0.68 0.84 3.07 3.50 3.52
Total Assets 13968 20709 17589 82973 65749 56827
Shareholder
Equity 2634 9671 8560 117631 114240 102253
c 5.30 2.14 2.05 0.71 0.58 0.56
ROE (a*b*c) -282.92% -9.75%
-
15.69% 3.04% 4.96% 8.29%
14
1 out of 16
Related Documents


Your All-in-One AI-Powered Toolkit for Academic Success.
+13062052269
info@desklib.com
Available 24*7 on WhatsApp / Email
![[object Object]](/_next/static/media/star-bottom.7253800d.svg)
Unlock your academic potential
© 2024 | Zucol Services PVT LTD | All rights reserved.