Financial Report: Comparative Analysis of Unilever Plc Group
VerifiedAdded on 2023/06/13
|35
|8849
|183
Report
AI Summary
This report presents a detailed financial analysis of Unilever Plc Group, comparing its performance with competitors Nestle and P&G using key financial ratios such as Return on Capital Employed (ROCE), Gross Profit Margin, Operating Profit Margin, Gearing, and Interest Cover for the years 2015 and 2016. The analysis evaluates the viability, profitability, and stability of Unilever, highlighting its strengths and weaknesses relative to its peers. While Unilever shows a higher ROCE, its gross profit margin is lower than Nestle and P&G. The report also discusses budgetary techniques like incremental and zero-based budgeting, performance measurement methods, and decision-making processes in large global firms. Desklib provides access to this and other solved assignments for students.
Running head: FINANCIAL MANAGEMENT
Financial Management
Name of the Student
Name of the University
Author Note
Financial Management
Name of the Student
Name of the University
Author Note
Paraphrase This Document
Need a fresh take? Get an instant paraphrase of this document with our AI Paraphraser
1FINANCIAL MANAGEMENT
Table of Contents
Part 1:...............................................................................................................................................3
Introduction..................................................................................................................................3
Background of the companies.....................................................................................................3
Comparative Financial Analysis of the main firm Unilever Plc Group......................................4
Recommendations and conclusion............................................................................................10
Part 2..............................................................................................................................................11
Introduction................................................................................................................................11
Budget- How it works................................................................................................................12
The different budgetary techniques...........................................................................................12
The comparison between the two main global company budgeting techniques:......................15
The benefits of Incremental Budgeting:....................................................................................15
The disadvantages of incremental budgeting:...........................................................................16
The benefits of zero based budgeting:.......................................................................................16
Conclusion.................................................................................................................................17
Part 3..............................................................................................................................................17
Introduction................................................................................................................................17
Discussion..................................................................................................................................18
Various techniques of performance measurement.....................................................................18
Conclusion.................................................................................................................................21
2FINANCIAL MANAGEMENT
Part 4..............................................................................................................................................22
Introduction................................................................................................................................22
The process of decision making by the managing director in the large global firms................22
The key issues that the manager faces in decision making.......................................................24
Conclusion.................................................................................................................................25
References:....................................................................................................................................26
⊘ This is a preview!⊘
Do you want full access?
Subscribe today to unlock all pages.
Trusted by 1+ million students worldwide
3FINANCIAL MANAGEMENT
Part 1:
Introduction
The current section elucidates in detail the processes of assessing viability, profitability
as well as stability of a firm to arrive at improved economic decisions. This study at hand utilize
key financial ratio to analytically evaluate financial condition of the main selected company
Unilever Plc in comparison to its peers Nestle and P&G over the time period 2015 and 2016.
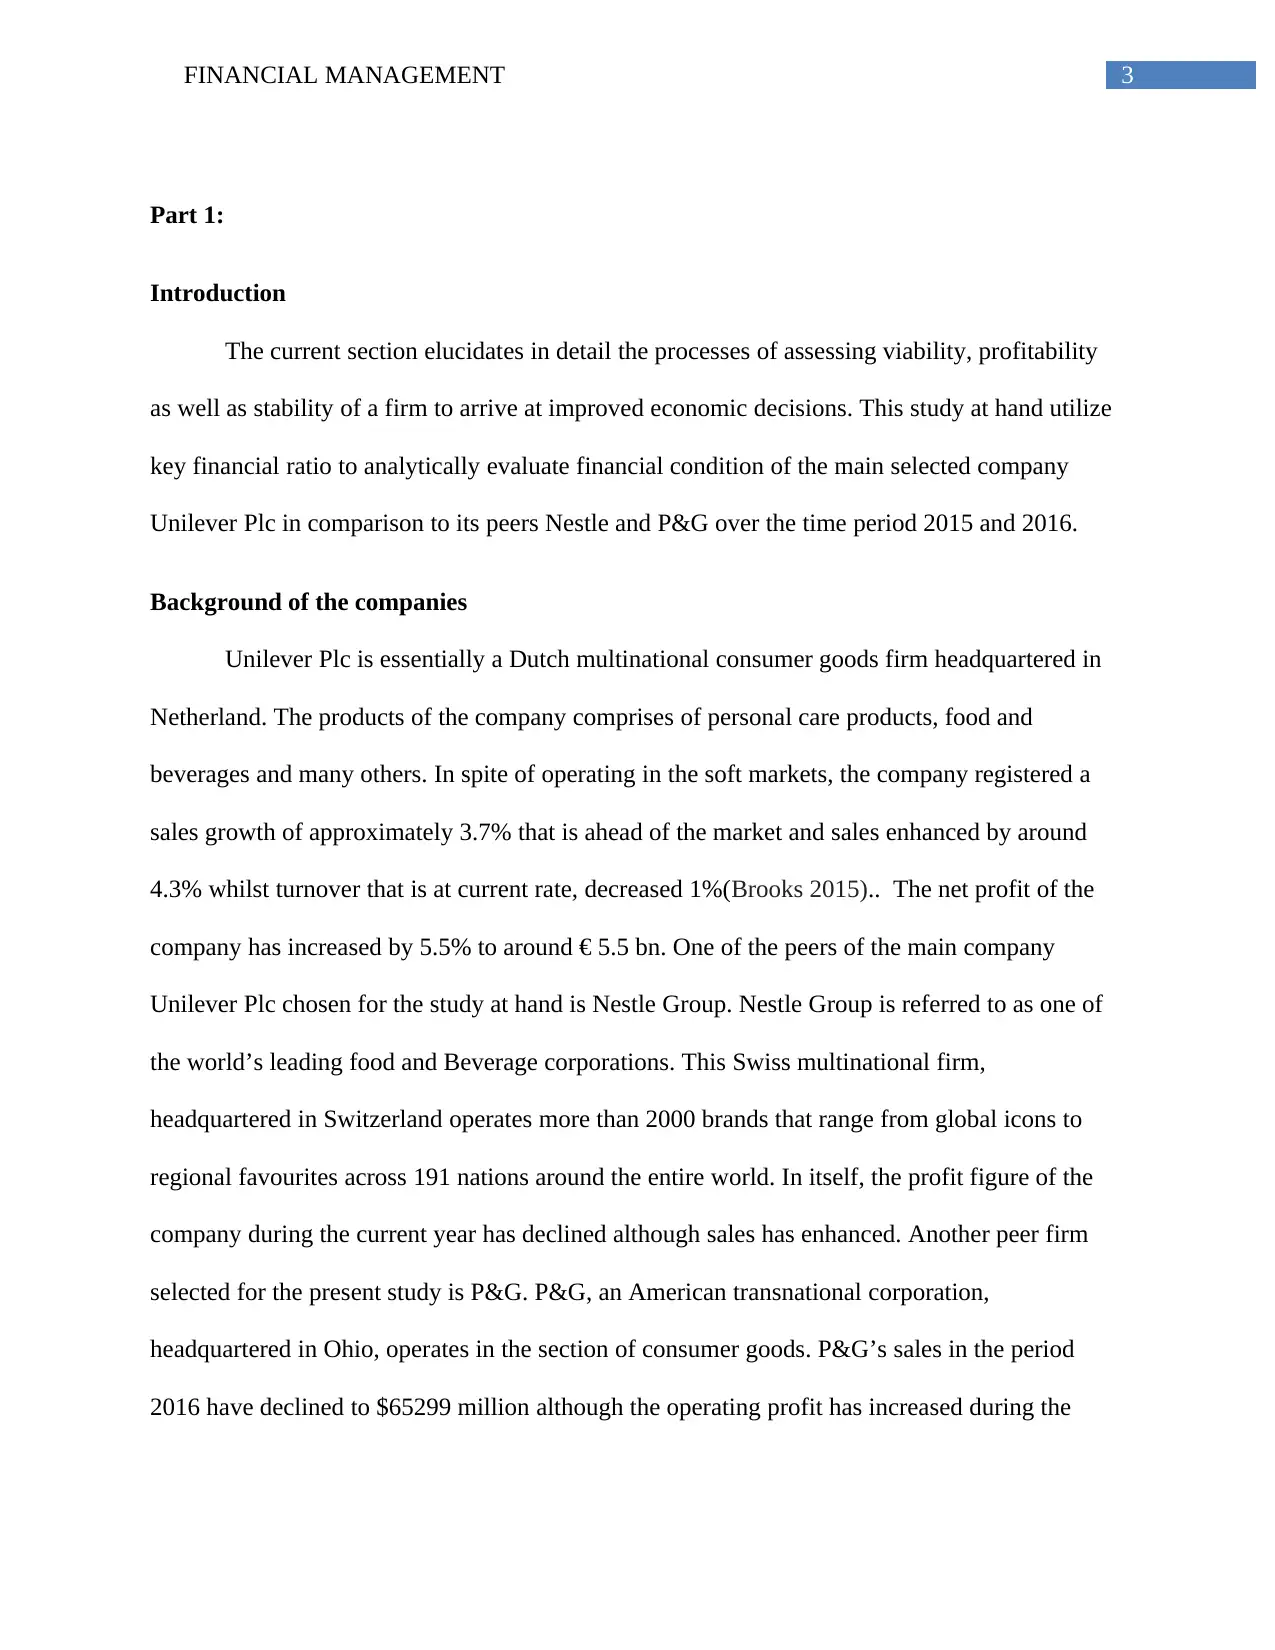
Background of the companies
Unilever Plc is essentially a Dutch multinational consumer goods firm headquartered in
Netherland. The products of the company comprises of personal care products, food and
beverages and many others. In spite of operating in the soft markets, the company registered a
sales growth of approximately 3.7% that is ahead of the market and sales enhanced by around
4.3% whilst turnover that is at current rate, decreased 1%(Brooks 2015).. The net profit of the
company has increased by 5.5% to around € 5.5 bn. One of the peers of the main company
Unilever Plc chosen for the study at hand is Nestle Group. Nestle Group is referred to as one of
the world’s leading food and Beverage corporations. This Swiss multinational firm,
headquartered in Switzerland operates more than 2000 brands that range from global icons to
regional favourites across 191 nations around the entire world. In itself, the profit figure of the
company during the current year has declined although sales has enhanced. Another peer firm
selected for the present study is P&G. P&G, an American transnational corporation,
headquartered in Ohio, operates in the section of consumer goods. P&G’s sales in the period
2016 have declined to $65299 million although the operating profit has increased during the
Part 1:
Introduction
The current section elucidates in detail the processes of assessing viability, profitability
as well as stability of a firm to arrive at improved economic decisions. This study at hand utilize
key financial ratio to analytically evaluate financial condition of the main selected company
Unilever Plc in comparison to its peers Nestle and P&G over the time period 2015 and 2016.
Background of the companies
Unilever Plc is essentially a Dutch multinational consumer goods firm headquartered in
Netherland. The products of the company comprises of personal care products, food and
beverages and many others. In spite of operating in the soft markets, the company registered a
sales growth of approximately 3.7% that is ahead of the market and sales enhanced by around
4.3% whilst turnover that is at current rate, decreased 1%(Brooks 2015).. The net profit of the
company has increased by 5.5% to around € 5.5 bn. One of the peers of the main company
Unilever Plc chosen for the study at hand is Nestle Group. Nestle Group is referred to as one of
the world’s leading food and Beverage corporations. This Swiss multinational firm,
headquartered in Switzerland operates more than 2000 brands that range from global icons to
regional favourites across 191 nations around the entire world. In itself, the profit figure of the
company during the current year has declined although sales has enhanced. Another peer firm
selected for the present study is P&G. P&G, an American transnational corporation,
headquartered in Ohio, operates in the section of consumer goods. P&G’s sales in the period
2016 have declined to $65299 million although the operating profit has increased during the
Paraphrase This Document
Need a fresh take? Get an instant paraphrase of this document with our AI Paraphraser
4FINANCIAL MANAGEMENT
same period. In addition to this, the EPS registered for this company is 3.8 in the year 2016 as
compared to 2.5 in the year 2015(Brooks 2015)..
Comparative Financial Analysis of the main firm Unilever Plc Group
• Return on Capital Employed: As correctly put forward by Bekaert and Hodrick (2017)
return on capital employed refers to a profitability ratio that enumerates the extent of efficiency
of a business concern to create profit from the firm’s employed capital. This is carried out by
comparing net operating profit to firm’s employed capital. Essentially, this ratio is enumerated
by calculating by dividing net operating profit or in other words Earnings before Interest and Tax
(EBIT) by the firm’s employed capital (Brooks 2015).. In case if employed capital is not
provided in a current issue or in the financial statement declaration, then it can be calculated by
subtracting current liabilities from particularly total assets (Barr 2018). The formula that is used
for enumeration is as presented below:
Return on capital employed = Net Operating Profit/ (Total Assets-Current Liabilities)
Fundamentally, a higher ratio implies more desirable position of the firm since it implies
that more profits are generated by capital employed (Titman et al. 2017).
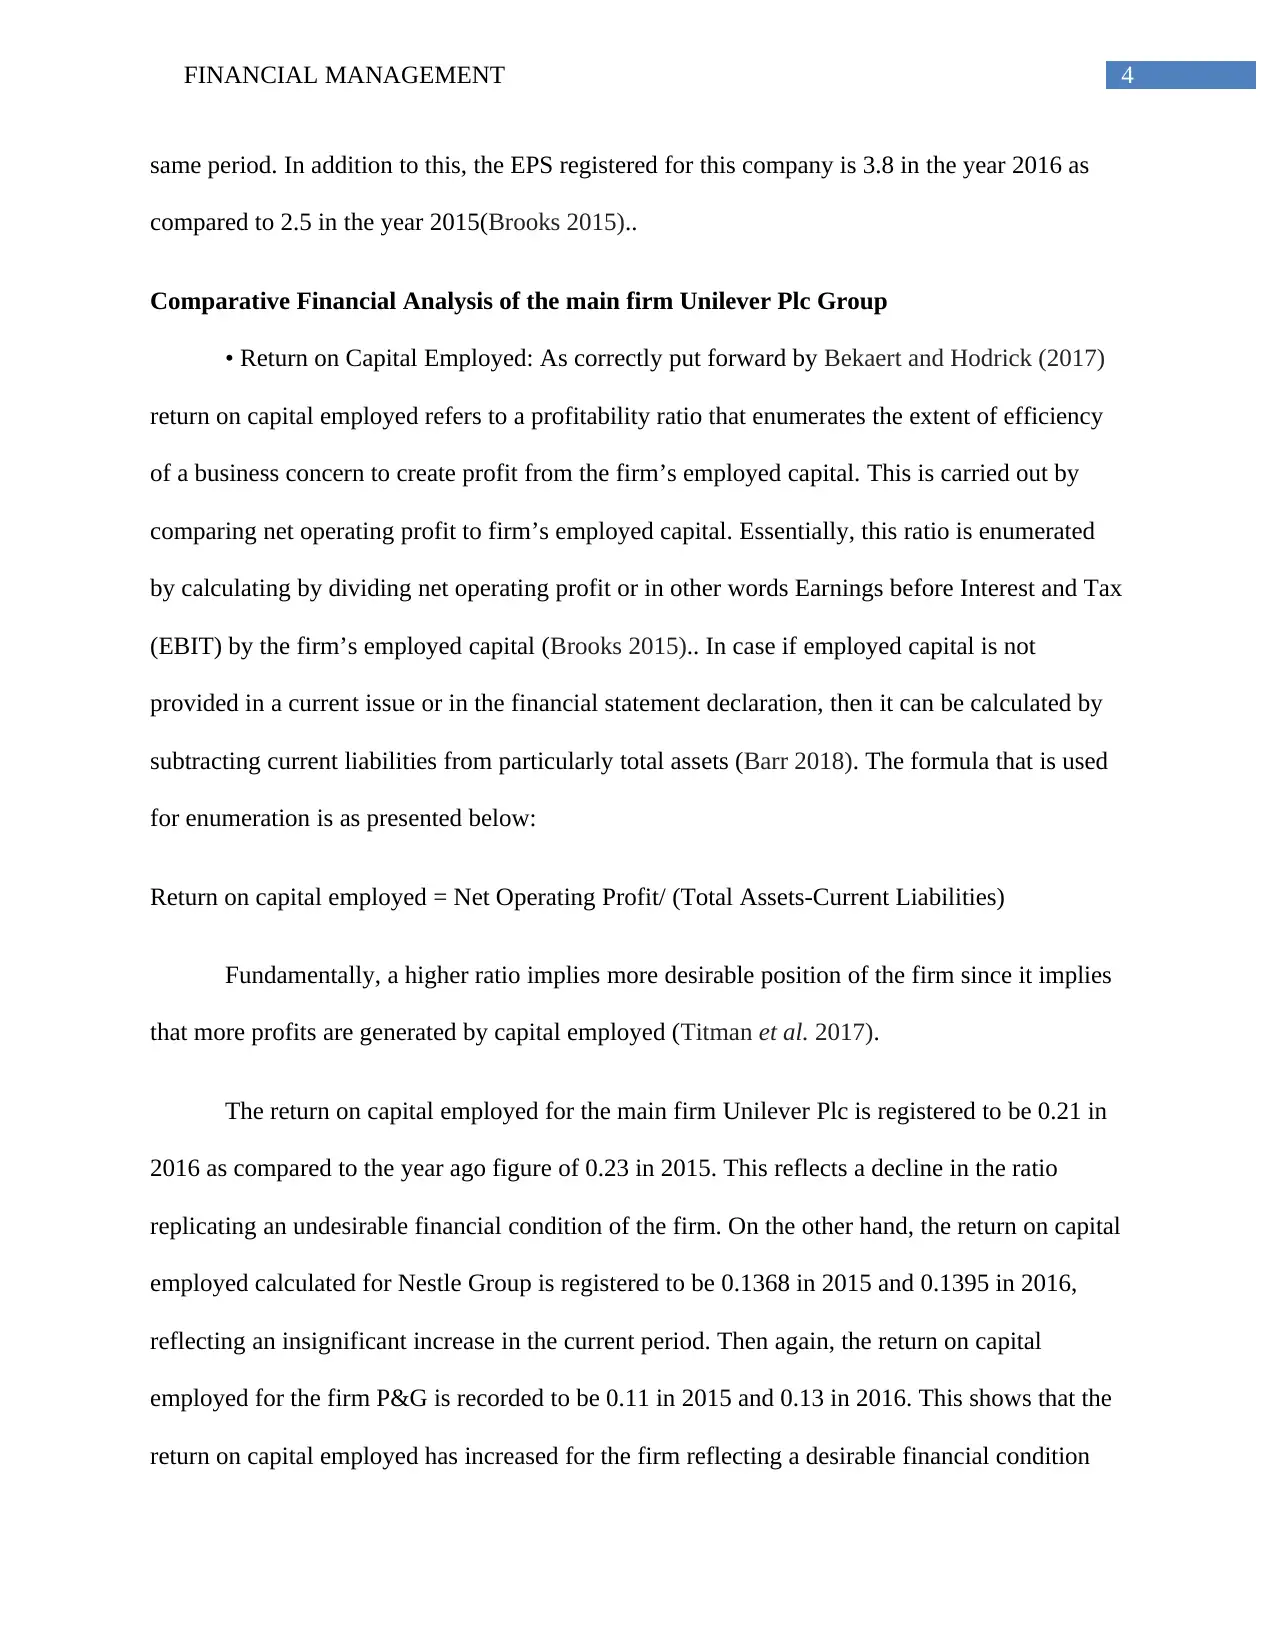
The return on capital employed for the main firm Unilever Plc is registered to be 0.21 in
2016 as compared to the year ago figure of 0.23 in 2015. This reflects a decline in the ratio
replicating an undesirable financial condition of the firm. On the other hand, the return on capital
employed calculated for Nestle Group is registered to be 0.1368 in 2015 and 0.1395 in 2016,
reflecting an insignificant increase in the current period. Then again, the return on capital
employed for the firm P&G is recorded to be 0.11 in 2015 and 0.13 in 2016. This shows that the
return on capital employed has increased for the firm reflecting a desirable financial condition
same period. In addition to this, the EPS registered for this company is 3.8 in the year 2016 as
compared to 2.5 in the year 2015(Brooks 2015)..
Comparative Financial Analysis of the main firm Unilever Plc Group
• Return on Capital Employed: As correctly put forward by Bekaert and Hodrick (2017)
return on capital employed refers to a profitability ratio that enumerates the extent of efficiency
of a business concern to create profit from the firm’s employed capital. This is carried out by
comparing net operating profit to firm’s employed capital. Essentially, this ratio is enumerated
by calculating by dividing net operating profit or in other words Earnings before Interest and Tax
(EBIT) by the firm’s employed capital (Brooks 2015).. In case if employed capital is not
provided in a current issue or in the financial statement declaration, then it can be calculated by
subtracting current liabilities from particularly total assets (Barr 2018). The formula that is used
for enumeration is as presented below:
Return on capital employed = Net Operating Profit/ (Total Assets-Current Liabilities)
Fundamentally, a higher ratio implies more desirable position of the firm since it implies
that more profits are generated by capital employed (Titman et al. 2017).
The return on capital employed for the main firm Unilever Plc is registered to be 0.21 in
2016 as compared to the year ago figure of 0.23 in 2015. This reflects a decline in the ratio
replicating an undesirable financial condition of the firm. On the other hand, the return on capital
employed calculated for Nestle Group is registered to be 0.1368 in 2015 and 0.1395 in 2016,
reflecting an insignificant increase in the current period. Then again, the return on capital
employed for the firm P&G is recorded to be 0.11 in 2015 and 0.13 in 2016. This shows that the
return on capital employed has increased for the firm reflecting a desirable financial condition
5FINANCIAL MANAGEMENT
during the current period (Brooks 2015). However, it can be hereby witnessed that this ratio is
recorded to be the highest for the main firm Unilever Plc, replicating a better efficiency of the
firm in comparison to its peers.
2015 2016 2015 2016 2015 2016
Unilever Nestle Group P&G
0
0.05
0.1
0.15
0.2
0.25
Return on Capital Employed
Return on Capital Employed Series2
Series3 Ratio
• Gross profit margin: This is essentially a profitability ratio that enumerates the overall
percentage of sales that surpasses the total cost of goods sold (COGS). This enumerates the
extent of efficiency of a company in utilizing the materials as well as labour to produce and at
the same time sell products profitably (Finkler et al. 2016). Basically, this is calculated by using
the formula:
Gross Profit Margin Percentage= (Total Sales-Cost of Goods Sold)/Sales
⊘ This is a preview!⊘
Do you want full access?
Subscribe today to unlock all pages.
Trusted by 1+ million students worldwide
6FINANCIAL MANAGEMENT
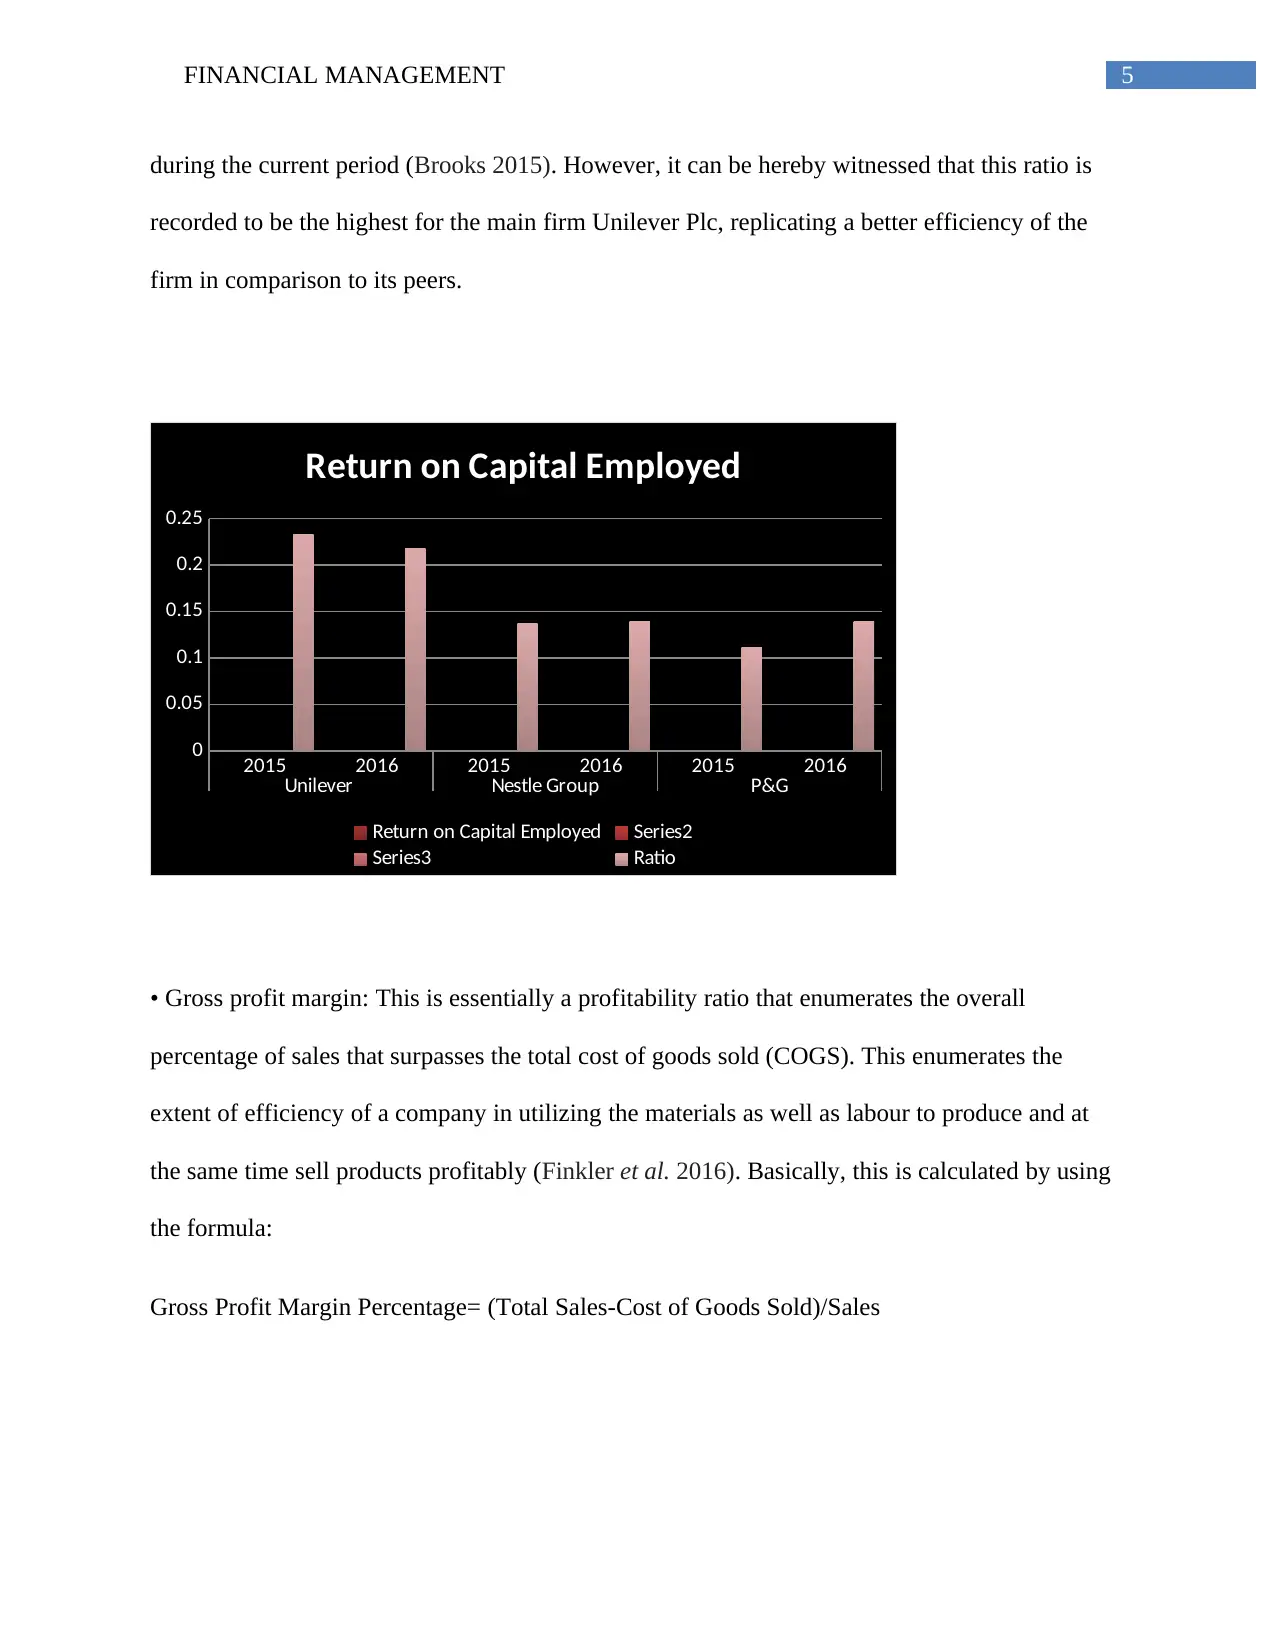
Analysis of the gross profit margin reveals that a higher one is more desirable as it
reflects higher efficiency on the part of the company to produce as well as sell products (Petty et
al. 2015).
The gross profit margin of the main firm Unilever plc has decreased during the period
2016 although insignificantly to 0.4265 in the year 2016 in comparison to the year ago figure of
0.4213(Zainudin and Hashim 2016).. This replicates an undesirable financial condition of the
firm in terms of profitability of the firm. On the other hand, the ratio is observed to have
increased for the peer firm Nestle Group as well as P&G. Also, gross profit margin of the main
firm is recorded to be less than that of both the peers.
2015 2016 2015 2016 2015 2016
Unilever Nestle Group P&G
0
0.1
0.2
0.3
0.4
0.5
0.6
Gross Profit Margin
Gross profit margin Ratio
• Operating profit margin: This ratio replicates profitability ratio that enumerates the overall
percentage of total revenue that is made from the operating income (Attig et al. 2016). In itself,
this operating profit margin is enumerated by using the following formula:
Operating Margin Ratio = Operating Income/Net Sales
Paraphrase This Document
Need a fresh take? Get an instant paraphrase of this document with our AI Paraphraser
7FINANCIAL MANAGEMENT
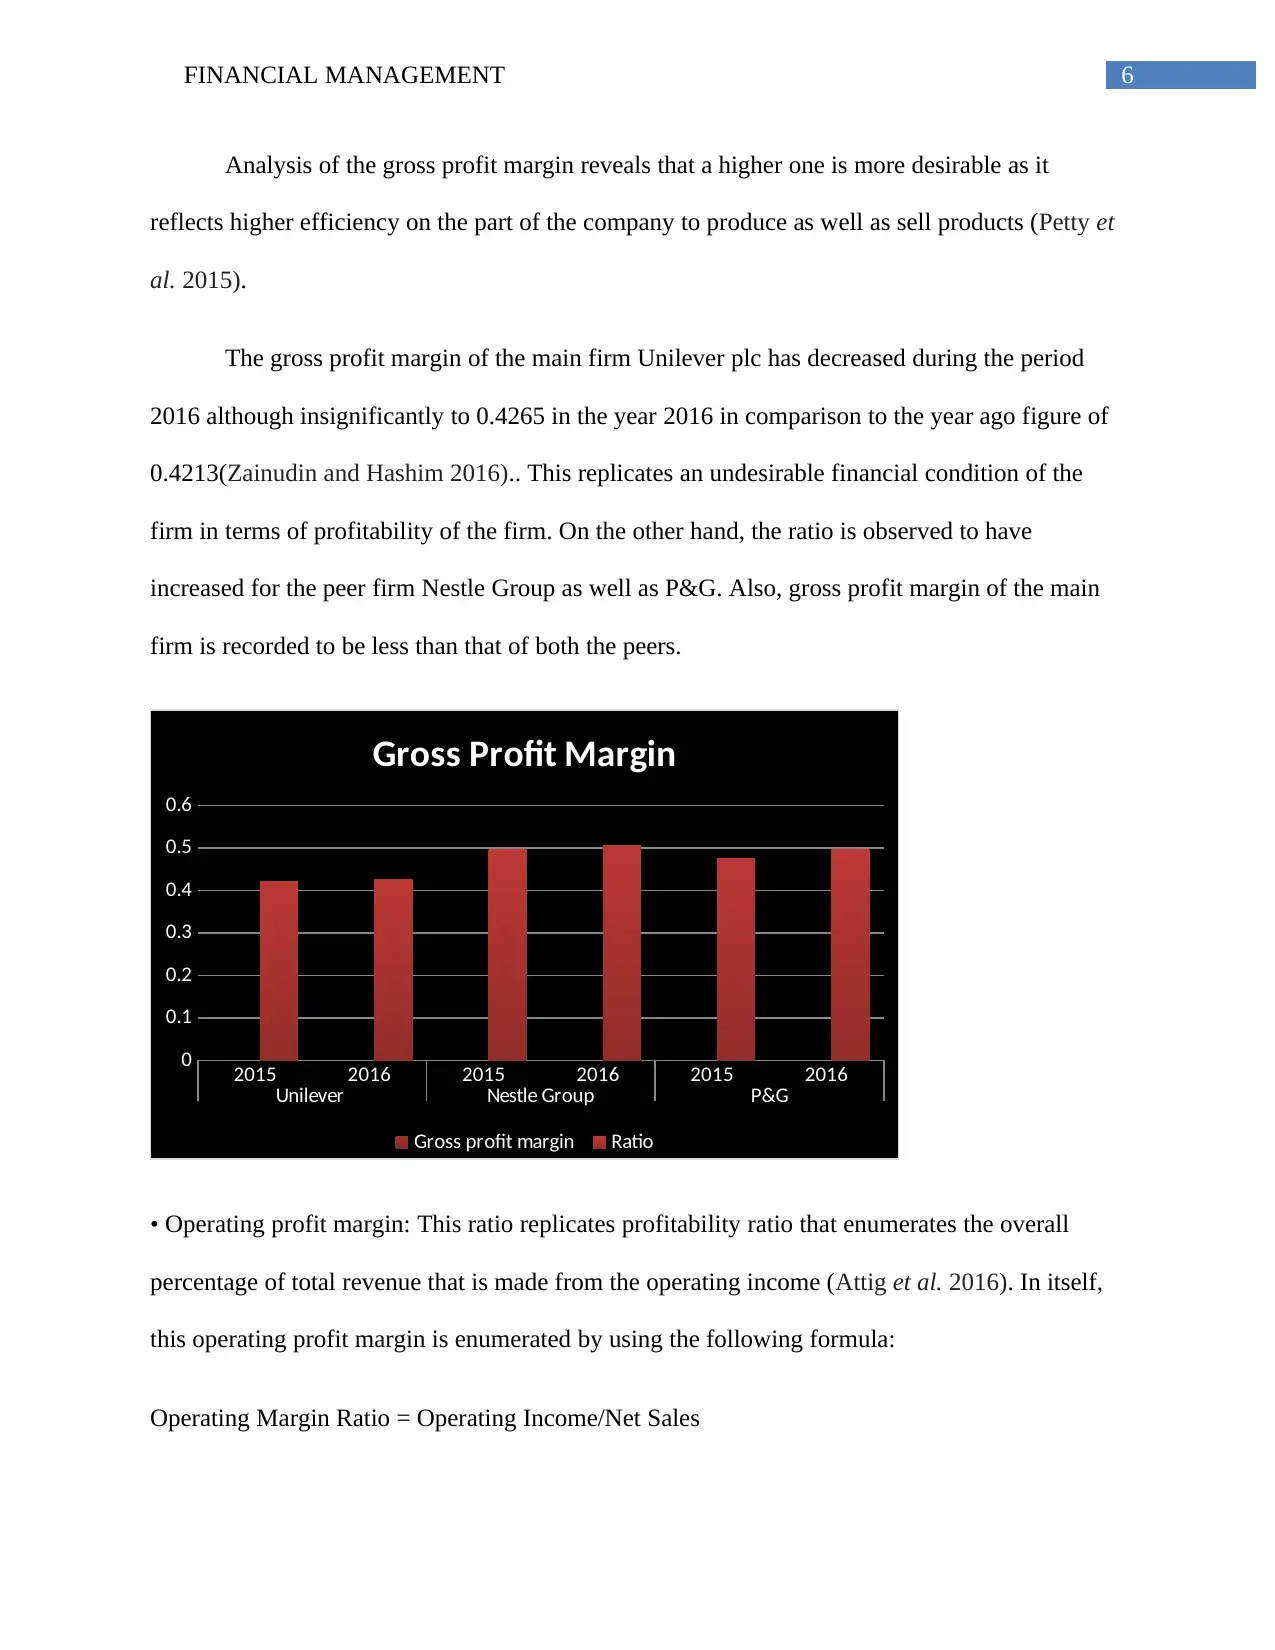
A greater operating margin can be considered to be more desirable in comparison to a
low ratio as this reflects that the business is making adequate money from numerous ongoing
operations to pay off for different variable costs along with fixed costs (Rodrigues and Rodrigues
2018).
Operating margin for the main firm Unilever Plc is recorded to be 0.1413 in 2015 and
0.1479 in 2016. This shows that the operating margin of the firm has increased although
insignificantly(Zainudin and Hashim 2016).. In itself, it reflects a better financial condition of the
firm in terms of profitability. Essentially, this demonstrates that during the current period a
higher proportion of revenue remains available for covering different non-operating costs
(Amelec and Carmen 2015). On the other hand, the operating profit margin has increased from
0.13 in 2015 to 0.14 in 2016, reflecting steady financial condition. Again, for the peer firm P&G,
this ratio has significantly increased from 0.15 in 2015 to 0.20 in 2016, indicating a sound
financial condition of the firm. However, it can be hereby observed that in terms of operating
margin, P&G has a better financial steadiness among the three firms.
2015 2016 2015 2016 2015 2016
Unilever Nestle Group P&G
0
0.05
0.1
0.15
0.2
0.25
Operating Profit Margin
Operating profit margin Ratio
8FINANCIAL MANAGEMENT
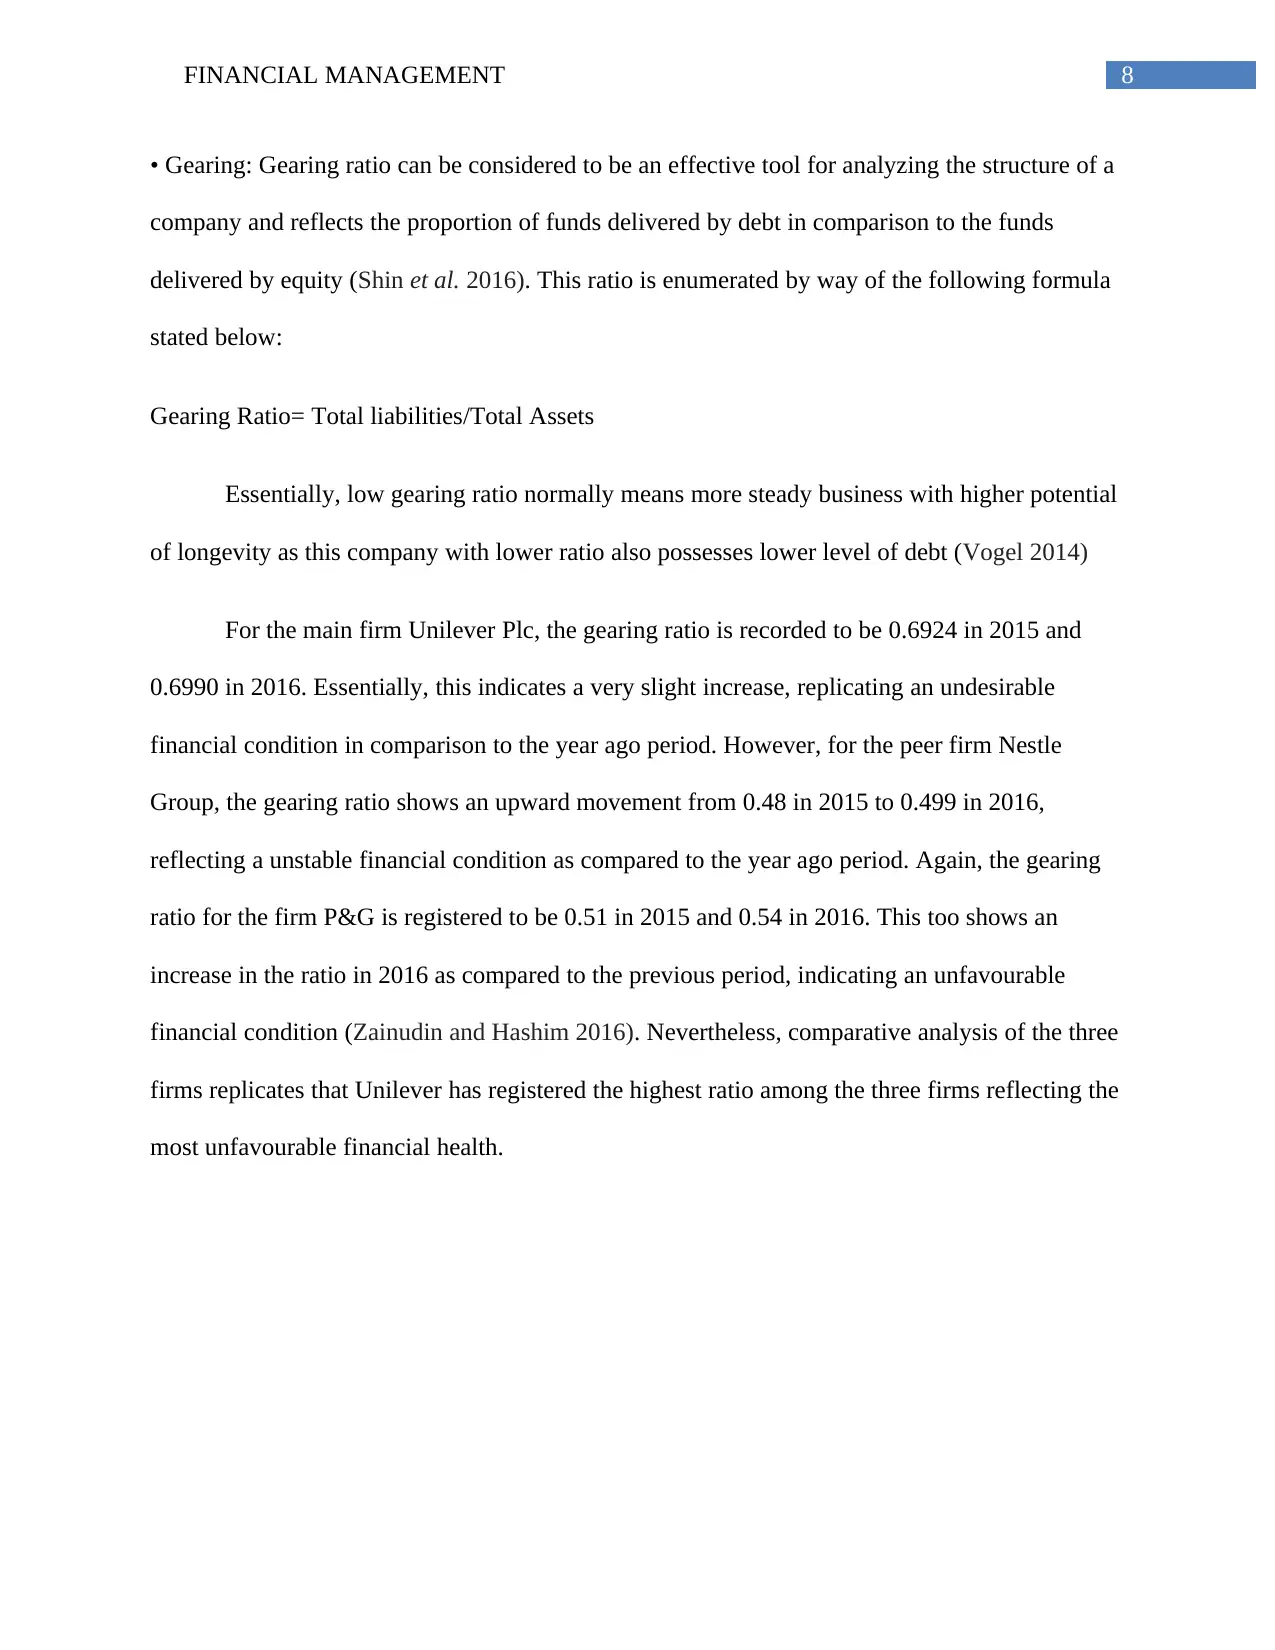
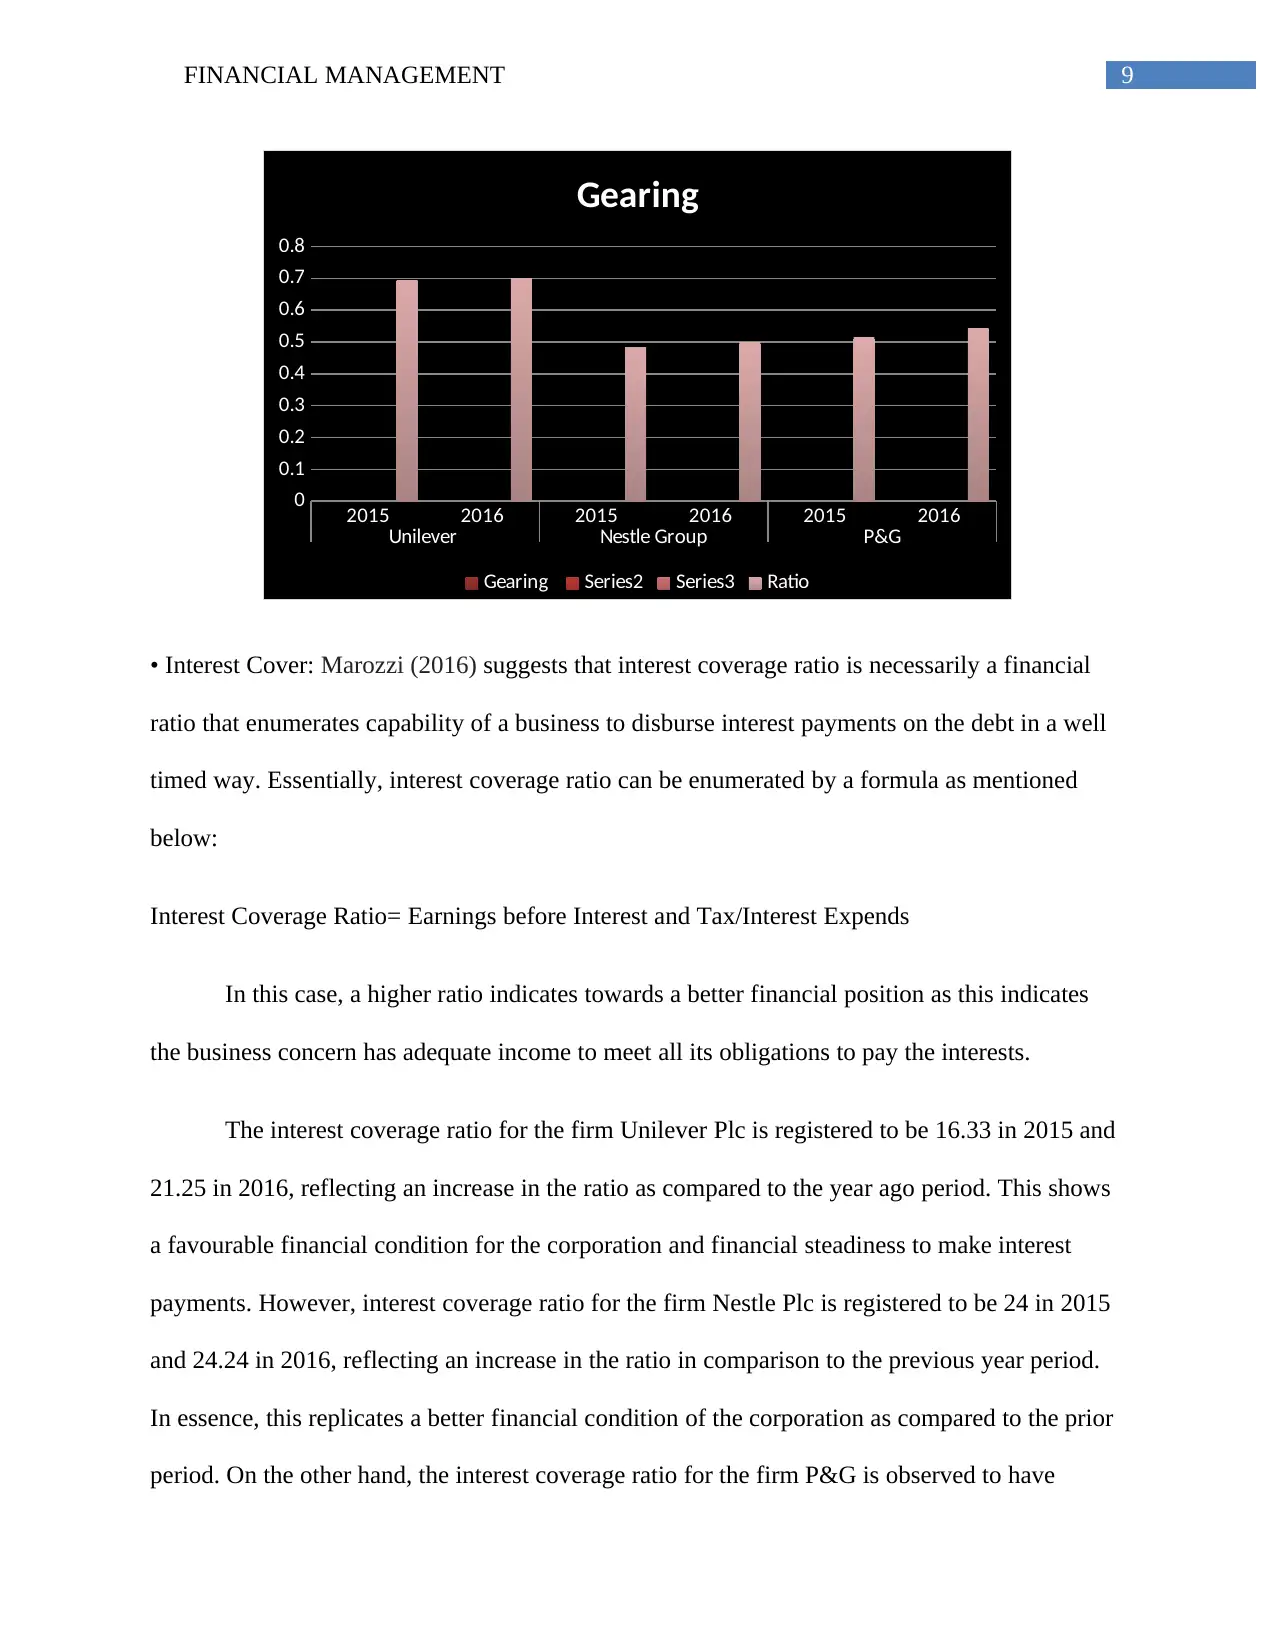
• Gearing: Gearing ratio can be considered to be an effective tool for analyzing the structure of a
company and reflects the proportion of funds delivered by debt in comparison to the funds
delivered by equity (Shin et al. 2016). This ratio is enumerated by way of the following formula
stated below:
Gearing Ratio= Total liabilities/Total Assets
Essentially, low gearing ratio normally means more steady business with higher potential
of longevity as this company with lower ratio also possesses lower level of debt (Vogel 2014)
For the main firm Unilever Plc, the gearing ratio is recorded to be 0.6924 in 2015 and
0.6990 in 2016. Essentially, this indicates a very slight increase, replicating an undesirable
financial condition in comparison to the year ago period. However, for the peer firm Nestle
Group, the gearing ratio shows an upward movement from 0.48 in 2015 to 0.499 in 2016,
reflecting a unstable financial condition as compared to the year ago period. Again, the gearing
ratio for the firm P&G is registered to be 0.51 in 2015 and 0.54 in 2016. This too shows an
increase in the ratio in 2016 as compared to the previous period, indicating an unfavourable
financial condition (Zainudin and Hashim 2016). Nevertheless, comparative analysis of the three
firms replicates that Unilever has registered the highest ratio among the three firms reflecting the
most unfavourable financial health.
⊘ This is a preview!⊘
Do you want full access?
Subscribe today to unlock all pages.
Trusted by 1+ million students worldwide
9FINANCIAL MANAGEMENT
2015 2016 2015 2016 2015 2016
Unilever Nestle Group P&G
0
0.1
0.2
0.3
0.4
0.5
0.6
0.7
0.8
Gearing
Gearing Series2 Series3 Ratio
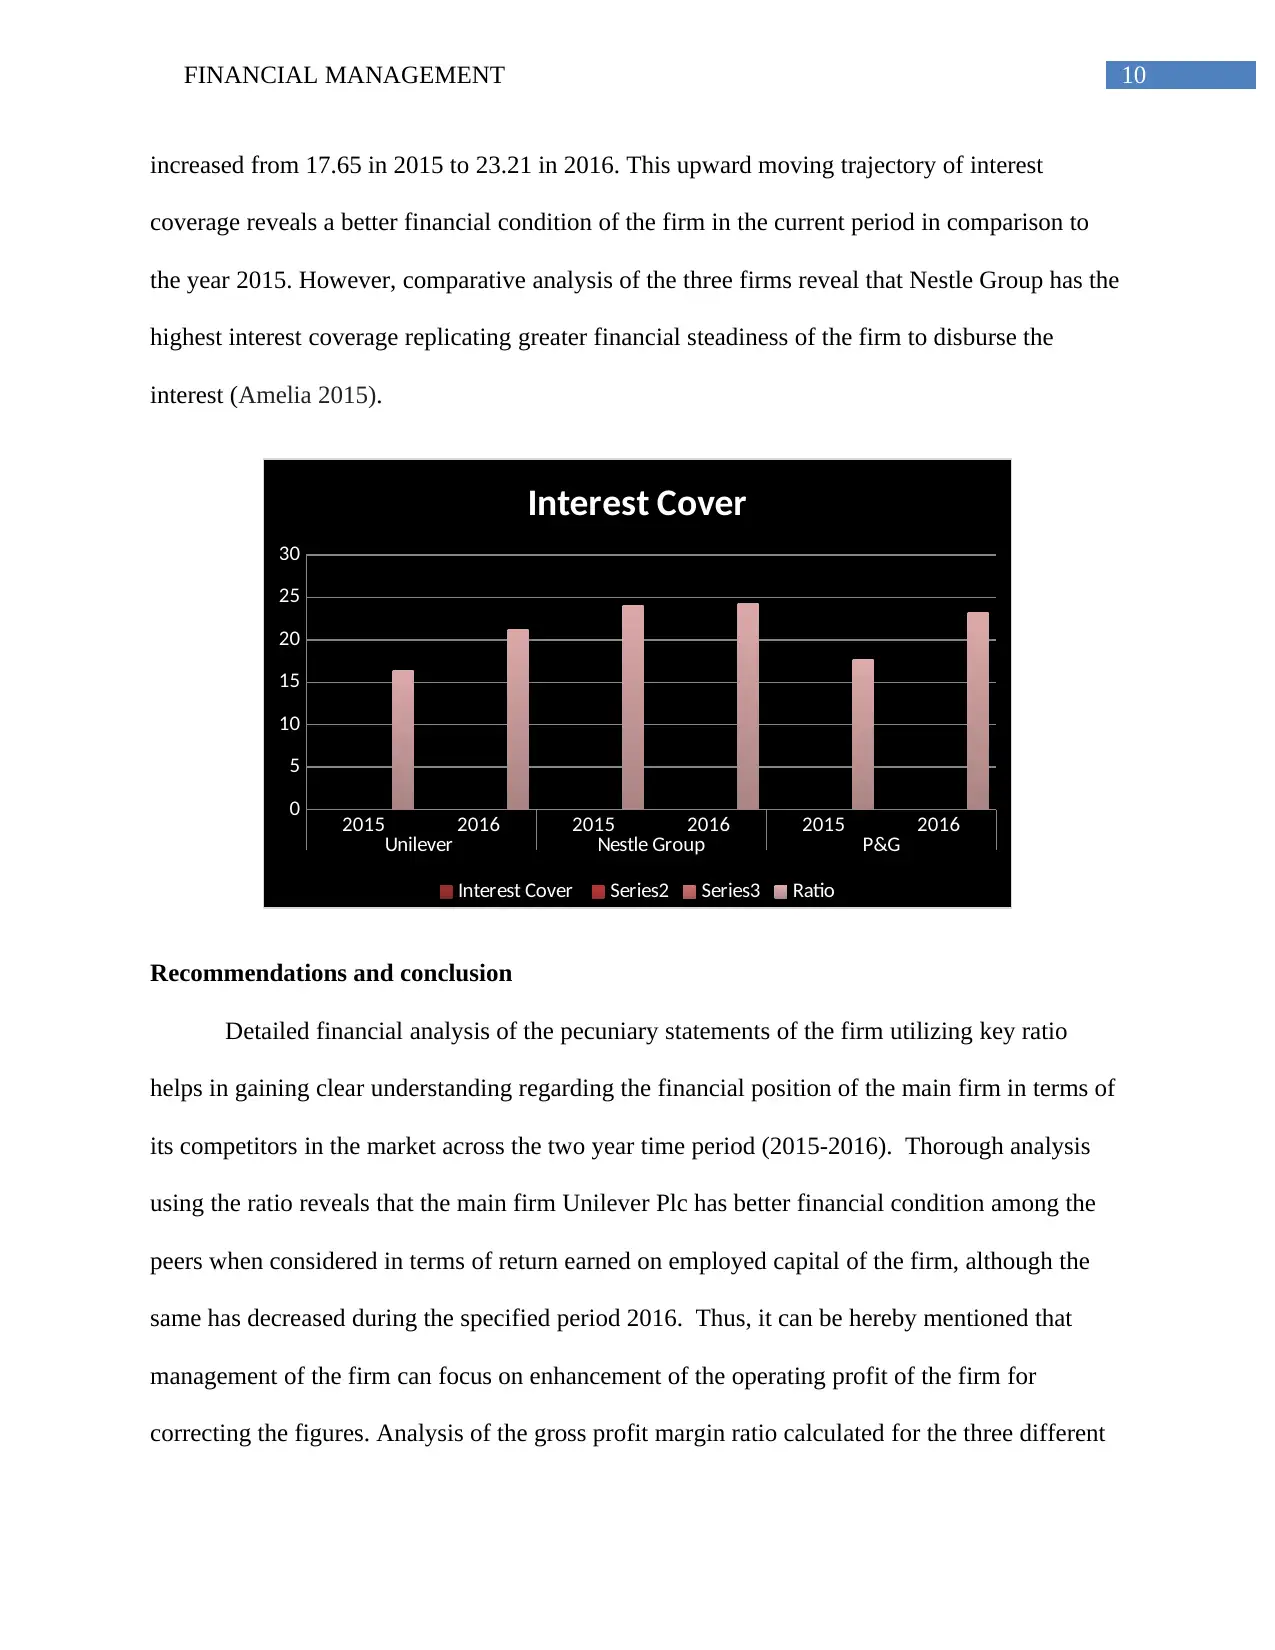
• Interest Cover: Marozzi (2016) suggests that interest coverage ratio is necessarily a financial
ratio that enumerates capability of a business to disburse interest payments on the debt in a well
timed way. Essentially, interest coverage ratio can be enumerated by a formula as mentioned
below:
Interest Coverage Ratio= Earnings before Interest and Tax/Interest Expends
In this case, a higher ratio indicates towards a better financial position as this indicates
the business concern has adequate income to meet all its obligations to pay the interests.
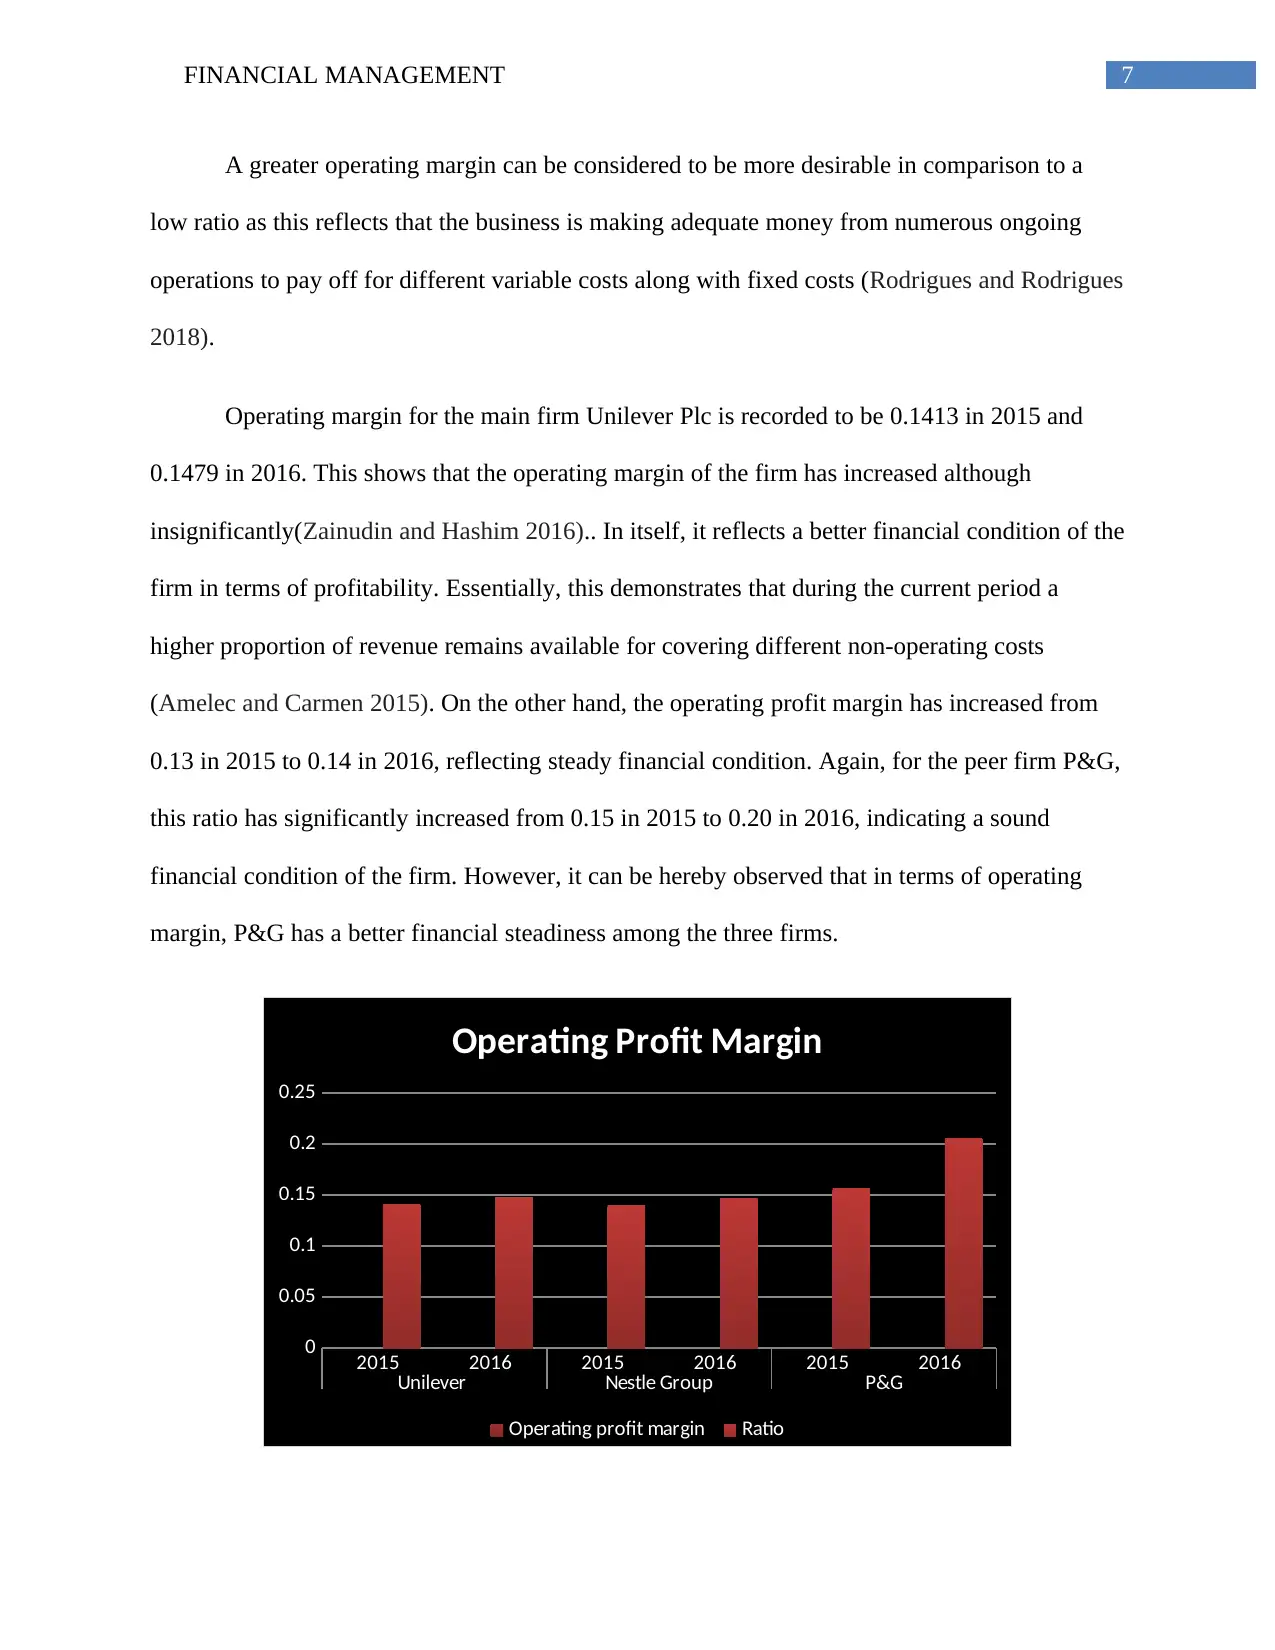
The interest coverage ratio for the firm Unilever Plc is registered to be 16.33 in 2015 and
21.25 in 2016, reflecting an increase in the ratio as compared to the year ago period. This shows
a favourable financial condition for the corporation and financial steadiness to make interest
payments. However, interest coverage ratio for the firm Nestle Plc is registered to be 24 in 2015
and 24.24 in 2016, reflecting an increase in the ratio in comparison to the previous year period.
In essence, this replicates a better financial condition of the corporation as compared to the prior
period. On the other hand, the interest coverage ratio for the firm P&G is observed to have
2015 2016 2015 2016 2015 2016
Unilever Nestle Group P&G
0
0.1
0.2
0.3
0.4
0.5
0.6
0.7
0.8
Gearing
Gearing Series2 Series3 Ratio
• Interest Cover: Marozzi (2016) suggests that interest coverage ratio is necessarily a financial
ratio that enumerates capability of a business to disburse interest payments on the debt in a well
timed way. Essentially, interest coverage ratio can be enumerated by a formula as mentioned
below:
Interest Coverage Ratio= Earnings before Interest and Tax/Interest Expends
In this case, a higher ratio indicates towards a better financial position as this indicates
the business concern has adequate income to meet all its obligations to pay the interests.
The interest coverage ratio for the firm Unilever Plc is registered to be 16.33 in 2015 and
21.25 in 2016, reflecting an increase in the ratio as compared to the year ago period. This shows
a favourable financial condition for the corporation and financial steadiness to make interest
payments. However, interest coverage ratio for the firm Nestle Plc is registered to be 24 in 2015
and 24.24 in 2016, reflecting an increase in the ratio in comparison to the previous year period.
In essence, this replicates a better financial condition of the corporation as compared to the prior
period. On the other hand, the interest coverage ratio for the firm P&G is observed to have
Paraphrase This Document
Need a fresh take? Get an instant paraphrase of this document with our AI Paraphraser
10FINANCIAL MANAGEMENT
increased from 17.65 in 2015 to 23.21 in 2016. This upward moving trajectory of interest
coverage reveals a better financial condition of the firm in the current period in comparison to
the year 2015. However, comparative analysis of the three firms reveal that Nestle Group has the
highest interest coverage replicating greater financial steadiness of the firm to disburse the
interest (Amelia 2015).
2015 2016 2015 2016 2015 2016
Unilever Nestle Group P&G
0
5
10
15
20
25
30
Interest Cover
Interest Cover Series2 Series3 Ratio
Recommendations and conclusion
Detailed financial analysis of the pecuniary statements of the firm utilizing key ratio
helps in gaining clear understanding regarding the financial position of the main firm in terms of
its competitors in the market across the two year time period (2015-2016). Thorough analysis
using the ratio reveals that the main firm Unilever Plc has better financial condition among the
peers when considered in terms of return earned on employed capital of the firm, although the
same has decreased during the specified period 2016. Thus, it can be hereby mentioned that
management of the firm can focus on enhancement of the operating profit of the firm for
correcting the figures. Analysis of the gross profit margin ratio calculated for the three different
11FINANCIAL MANAGEMENT
firms helps in understanding the fact that the main firm Unilever plc has comparatively lower
efficiency to produce as well as sell as compared to its peers, although the same has remained at
the same level during the specified time period. Thus, management of the main firm can
concentrate on tactically enhancing of the efficiency of firm to generate higher profit out of the
sales of the firm. Again, in terms of operating margin, the main firm is said to be in a better
position in terms of Nestle Group whereas it is lagging behind in comparison to P&G. As such,
the gearing ratio is also recorded to be the highest for the main reflecting unfavourable financial
condition in comparison to both the peers. Therefore, the finance managers of the firm can
concentrate on lessening the liabilities of the firm to improve the condition. In terms of interest
coverage, the peer firm Nestle Group is said to have the most favourable condition among the
three. However, the same is said to have increased for the main firm during 2016 as compared to
2015, reflecting a desirable financial condition.
Part 2
Critical discussion of the techniques of budgeting that might be most useful to a large global
company to allow it to best understand the operational performance its divisions.
Introduction
The process of budgeting is a integral part of effective running of the business. They are
the most efficient plan of the future actions for the managers and stand as a point of comparison
of the various yearly performances of the organization.
In a simpler form, budgets refer to the amount of money hat is kept separately to allocate
the various expenses that help in the business operations (Codesso et al.2015). The performance
and operations becomes much easier when it is determined beforehand the questions like how
⊘ This is a preview!⊘
Do you want full access?
Subscribe today to unlock all pages.
Trusted by 1+ million students worldwide
1 out of 35
Related Documents


Your All-in-One AI-Powered Toolkit for Academic Success.
+13062052269
info@desklib.com
Available 24*7 on WhatsApp / Email
![[object Object]](/_next/static/media/star-bottom.7253800d.svg)
Unlock your academic potential
Copyright © 2020–2025 A2Z Services. All Rights Reserved. Developed and managed by ZUCOL.