Financial Management: Comparative Financial Analysis of Unilever Plc Group
Added on 2023-06-13
35 Pages8849 Words183 Views
Running head: FINANCIAL MANAGEMENT
Financial Management
Name of the Student
Name of the University
Author Note
Financial Management
Name of the Student
Name of the University
Author Note
1FINANCIAL MANAGEMENT
Table of Contents
Part 1:...............................................................................................................................................3
Introduction..................................................................................................................................3
Background of the companies.....................................................................................................3
Comparative Financial Analysis of the main firm Unilever Plc Group......................................4
Recommendations and conclusion............................................................................................10
Part 2..............................................................................................................................................11
Introduction................................................................................................................................11
Budget- How it works................................................................................................................12
The different budgetary techniques...........................................................................................12
The comparison between the two main global company budgeting techniques:......................15
The benefits of Incremental Budgeting:....................................................................................15
The disadvantages of incremental budgeting:...........................................................................16
The benefits of zero based budgeting:.......................................................................................16
Conclusion.................................................................................................................................17
Part 3..............................................................................................................................................17
Introduction................................................................................................................................17
Discussion..................................................................................................................................18
Various techniques of performance measurement.....................................................................18
Conclusion.................................................................................................................................21
2FINANCIAL MANAGEMENT
Part 4..............................................................................................................................................22
Introduction................................................................................................................................22
The process of decision making by the managing director in the large global firms................22
The key issues that the manager faces in decision making.......................................................24
Conclusion.................................................................................................................................25
References:....................................................................................................................................26
3FINANCIAL MANAGEMENT
Part 1:
Introduction
The current section elucidates in detail the processes of assessing viability, profitability
as well as stability of a firm to arrive at improved economic decisions. This study at hand utilize
key financial ratio to analytically evaluate financial condition of the main selected company
Unilever Plc in comparison to its peers Nestle and P&G over the time period 2015 and 2016.
Background of the companies
Unilever Plc is essentially a Dutch multinational consumer goods firm headquartered in
Netherland. The products of the company comprises of personal care products, food and
beverages and many others. In spite of operating in the soft markets, the company registered a
sales growth of approximately 3.7% that is ahead of the market and sales enhanced by around
4.3% whilst turnover that is at current rate, decreased 1%(Brooks 2015).. The net profit of the
company has increased by 5.5% to around € 5.5 bn. One of the peers of the main company
Unilever Plc chosen for the study at hand is Nestle Group. Nestle Group is referred to as one of
the world’s leading food and Beverage corporations. This Swiss multinational firm,
headquartered in Switzerland operates more than 2000 brands that range from global icons to
regional favourites across 191 nations around the entire world. In itself, the profit figure of the
company during the current year has declined although sales has enhanced. Another peer firm
selected for the present study is P&G. P&G, an American transnational corporation,
headquartered in Ohio, operates in the section of consumer goods. P&G’s sales in the period
2016 have declined to $65299 million although the operating profit has increased during the
4FINANCIAL MANAGEMENT
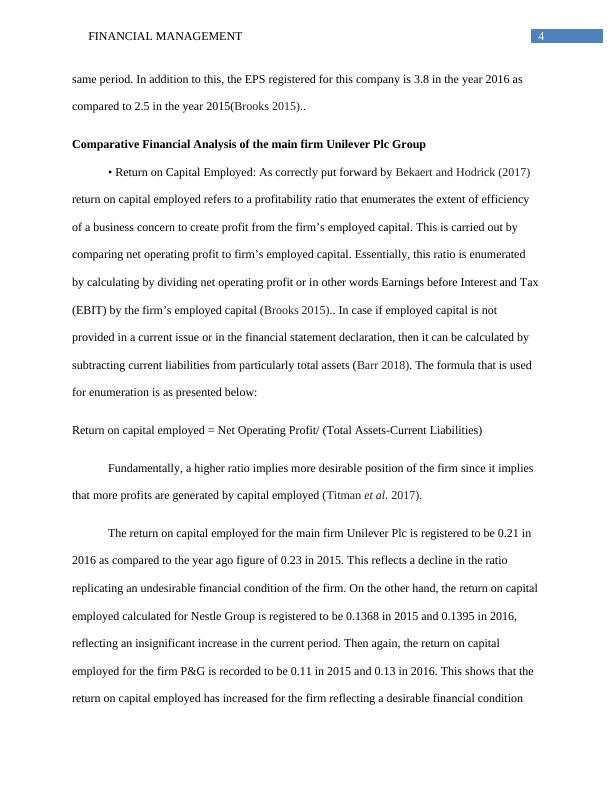
same period. In addition to this, the EPS registered for this company is 3.8 in the year 2016 as
compared to 2.5 in the year 2015(Brooks 2015)..
Comparative Financial Analysis of the main firm Unilever Plc Group
• Return on Capital Employed: As correctly put forward by Bekaert and Hodrick (2017)
return on capital employed refers to a profitability ratio that enumerates the extent of efficiency
of a business concern to create profit from the firm’s employed capital. This is carried out by
comparing net operating profit to firm’s employed capital. Essentially, this ratio is enumerated
by calculating by dividing net operating profit or in other words Earnings before Interest and Tax
(EBIT) by the firm’s employed capital (Brooks 2015).. In case if employed capital is not
provided in a current issue or in the financial statement declaration, then it can be calculated by
subtracting current liabilities from particularly total assets (Barr 2018). The formula that is used
for enumeration is as presented below:
Return on capital employed = Net Operating Profit/ (Total Assets-Current Liabilities)
Fundamentally, a higher ratio implies more desirable position of the firm since it implies
that more profits are generated by capital employed (Titman et al. 2017).
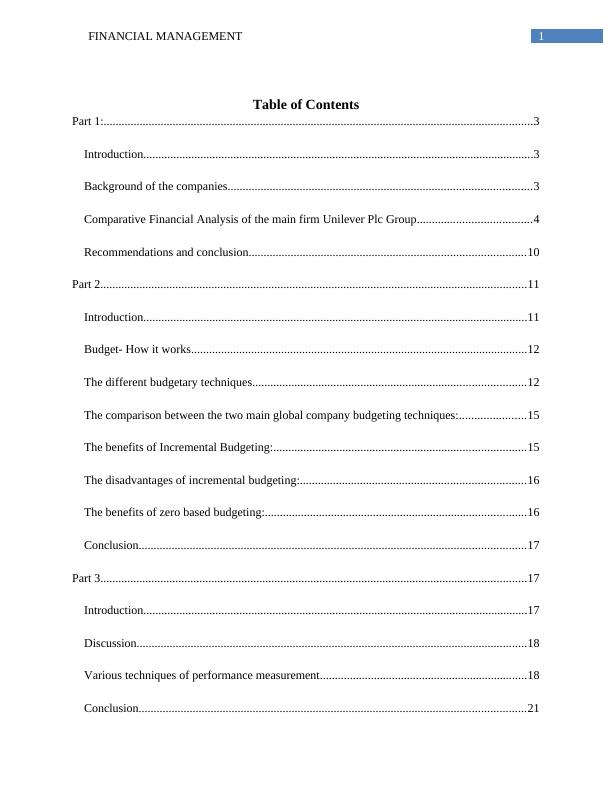
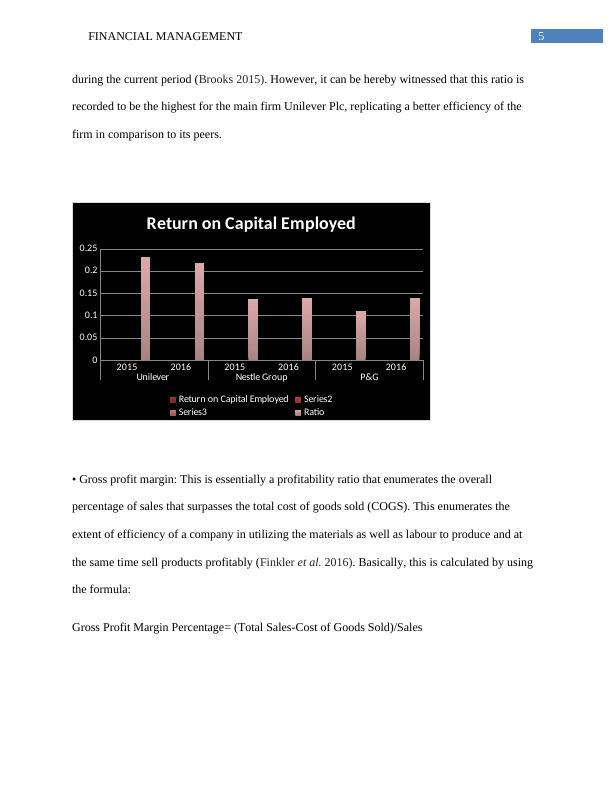
The return on capital employed for the main firm Unilever Plc is registered to be 0.21 in
2016 as compared to the year ago figure of 0.23 in 2015. This reflects a decline in the ratio
replicating an undesirable financial condition of the firm. On the other hand, the return on capital
employed calculated for Nestle Group is registered to be 0.1368 in 2015 and 0.1395 in 2016,
reflecting an insignificant increase in the current period. Then again, the return on capital
employed for the firm P&G is recorded to be 0.11 in 2015 and 0.13 in 2016. This shows that the
return on capital employed has increased for the firm reflecting a desirable financial condition
same period. In addition to this, the EPS registered for this company is 3.8 in the year 2016 as
compared to 2.5 in the year 2015(Brooks 2015)..
Comparative Financial Analysis of the main firm Unilever Plc Group
• Return on Capital Employed: As correctly put forward by Bekaert and Hodrick (2017)
return on capital employed refers to a profitability ratio that enumerates the extent of efficiency
of a business concern to create profit from the firm’s employed capital. This is carried out by
comparing net operating profit to firm’s employed capital. Essentially, this ratio is enumerated
by calculating by dividing net operating profit or in other words Earnings before Interest and Tax
(EBIT) by the firm’s employed capital (Brooks 2015).. In case if employed capital is not
provided in a current issue or in the financial statement declaration, then it can be calculated by
subtracting current liabilities from particularly total assets (Barr 2018). The formula that is used
for enumeration is as presented below:
Return on capital employed = Net Operating Profit/ (Total Assets-Current Liabilities)
Fundamentally, a higher ratio implies more desirable position of the firm since it implies
that more profits are generated by capital employed (Titman et al. 2017).
The return on capital employed for the main firm Unilever Plc is registered to be 0.21 in
2016 as compared to the year ago figure of 0.23 in 2015. This reflects a decline in the ratio
replicating an undesirable financial condition of the firm. On the other hand, the return on capital
employed calculated for Nestle Group is registered to be 0.1368 in 2015 and 0.1395 in 2016,
reflecting an insignificant increase in the current period. Then again, the return on capital
employed for the firm P&G is recorded to be 0.11 in 2015 and 0.13 in 2016. This shows that the
return on capital employed has increased for the firm reflecting a desirable financial condition
5FINANCIAL MANAGEMENT
during the current period (Brooks 2015). However, it can be hereby witnessed that this ratio is
recorded to be the highest for the main firm Unilever Plc, replicating a better efficiency of the
firm in comparison to its peers.
2015 2016 2015 2016 2015 2016
Unilever Nestle Group P&G
0
0.05
0.1
0.15
0.2
0.25
Return on Capital Employed
Return on Capital Employed Series2
Series3 Ratio
• Gross profit margin: This is essentially a profitability ratio that enumerates the overall
percentage of sales that surpasses the total cost of goods sold (COGS). This enumerates the
extent of efficiency of a company in utilizing the materials as well as labour to produce and at
the same time sell products profitably (Finkler et al. 2016). Basically, this is calculated by using
the formula:
Gross Profit Margin Percentage= (Total Sales-Cost of Goods Sold)/Sales
6FINANCIAL MANAGEMENT
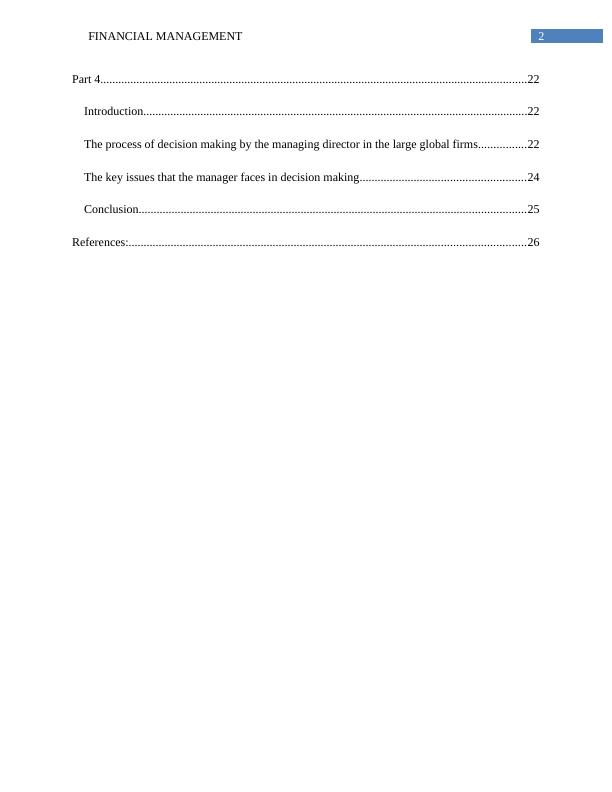
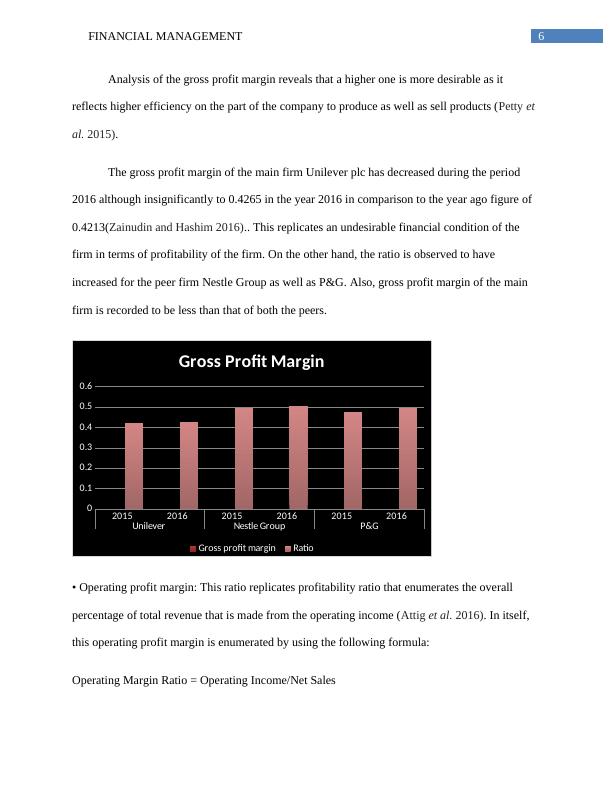
Analysis of the gross profit margin reveals that a higher one is more desirable as it
reflects higher efficiency on the part of the company to produce as well as sell products (Petty et
al. 2015).
The gross profit margin of the main firm Unilever plc has decreased during the period
2016 although insignificantly to 0.4265 in the year 2016 in comparison to the year ago figure of
0.4213(Zainudin and Hashim 2016).. This replicates an undesirable financial condition of the
firm in terms of profitability of the firm. On the other hand, the ratio is observed to have
increased for the peer firm Nestle Group as well as P&G. Also, gross profit margin of the main
firm is recorded to be less than that of both the peers.
2015 2016 2015 2016 2015 2016
Unilever Nestle Group P&G
0
0.1
0.2
0.3
0.4
0.5
0.6
Gross Profit Margin
Gross profit margin Ratio
• Operating profit margin: This ratio replicates profitability ratio that enumerates the overall
percentage of total revenue that is made from the operating income (Attig et al. 2016). In itself,
this operating profit margin is enumerated by using the following formula:
Operating Margin Ratio = Operating Income/Net Sales
7FINANCIAL MANAGEMENT
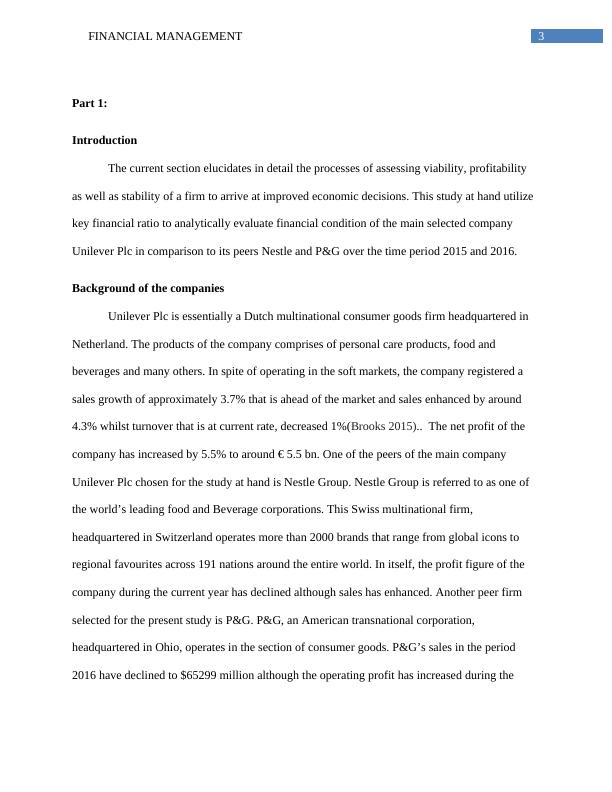
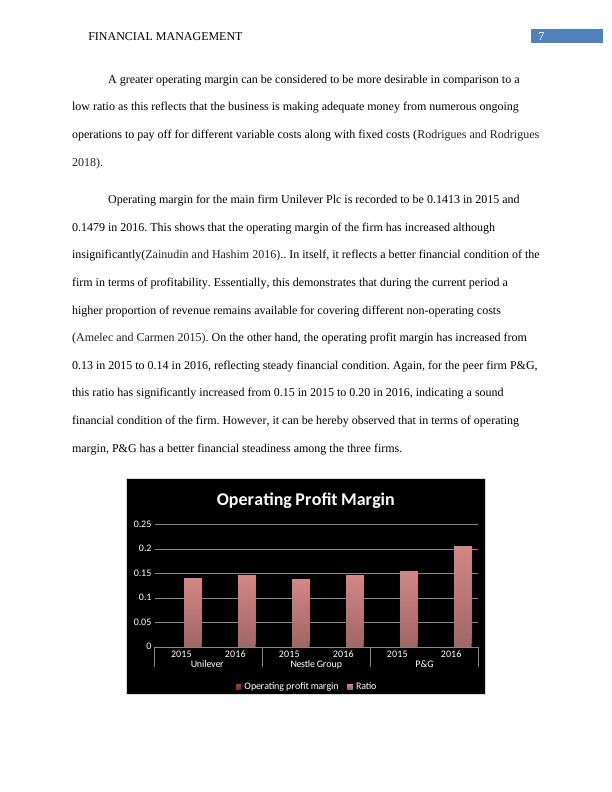
A greater operating margin can be considered to be more desirable in comparison to a
low ratio as this reflects that the business is making adequate money from numerous ongoing
operations to pay off for different variable costs along with fixed costs (Rodrigues and Rodrigues
2018).
Operating margin for the main firm Unilever Plc is recorded to be 0.1413 in 2015 and
0.1479 in 2016. This shows that the operating margin of the firm has increased although
insignificantly(Zainudin and Hashim 2016).. In itself, it reflects a better financial condition of the
firm in terms of profitability. Essentially, this demonstrates that during the current period a
higher proportion of revenue remains available for covering different non-operating costs
(Amelec and Carmen 2015). On the other hand, the operating profit margin has increased from
0.13 in 2015 to 0.14 in 2016, reflecting steady financial condition. Again, for the peer firm P&G,
this ratio has significantly increased from 0.15 in 2015 to 0.20 in 2016, indicating a sound
financial condition of the firm. However, it can be hereby observed that in terms of operating
margin, P&G has a better financial steadiness among the three firms.
2015 2016 2015 2016 2015 2016
Unilever Nestle Group P&G
0
0.05
0.1
0.15
0.2
0.25
Operating Profit Margin
Operating profit margin Ratio
End of preview
Want to access all the pages? Upload your documents or become a member.
Related Documents
Presentation of Financial Analysislg...
|13
|3216
|342
Managing Financial Performance Researchlg...
|32
|10730
|47
Assignment : Financial Decision Makinglg...
|22
|5001
|41
PGBM12 Accounting and Financial Management Assessment January 2019 cohortlg...
|23
|4322
|184
Financial Decision Makinglg...
|23
|4571
|320
Financial Analysis of Sainsbury Plclg...
|15
|3437
|37