Financial Mathematics and Business Statistics
VerifiedAdded on 2023/06/09
|17
|2448
|156
AI Summary
This document contains solutions to problems related to financial mathematics and business statistics. It includes computations of monthly payments, linear programming, descriptive statistics, regression analysis, and capital budgeting tools. The subject is not mentioned, but it is assumed to be related to finance or business. The document also includes references.
Contribute Materials
Your contribution can guide someone’s learning journey. Share your
documents today.
Running head: FINANCIAL MATHEMATICS AND BUSINESS STATISTICS
Financial Mathematics and Business Statistics
Name of Student:
Name of University:
Author’s Note:
Financial Mathematics and Business Statistics
Name of Student:
Name of University:
Author’s Note:
Secure Best Marks with AI Grader
Need help grading? Try our AI Grader for instant feedback on your assignments.
1FINANCIAL MATHEMATICS AND BUSINESS STATISTICS
Table of Contents
Question 1........................................................................................................................................2
Question 2........................................................................................................................................3
Question 3........................................................................................................................................6
Question 4........................................................................................................................................9
Question 5......................................................................................................................................11
References......................................................................................................................................15
2FINANCIAL MATHEMATICS AND BUSINESS STATISTICS
Question 1
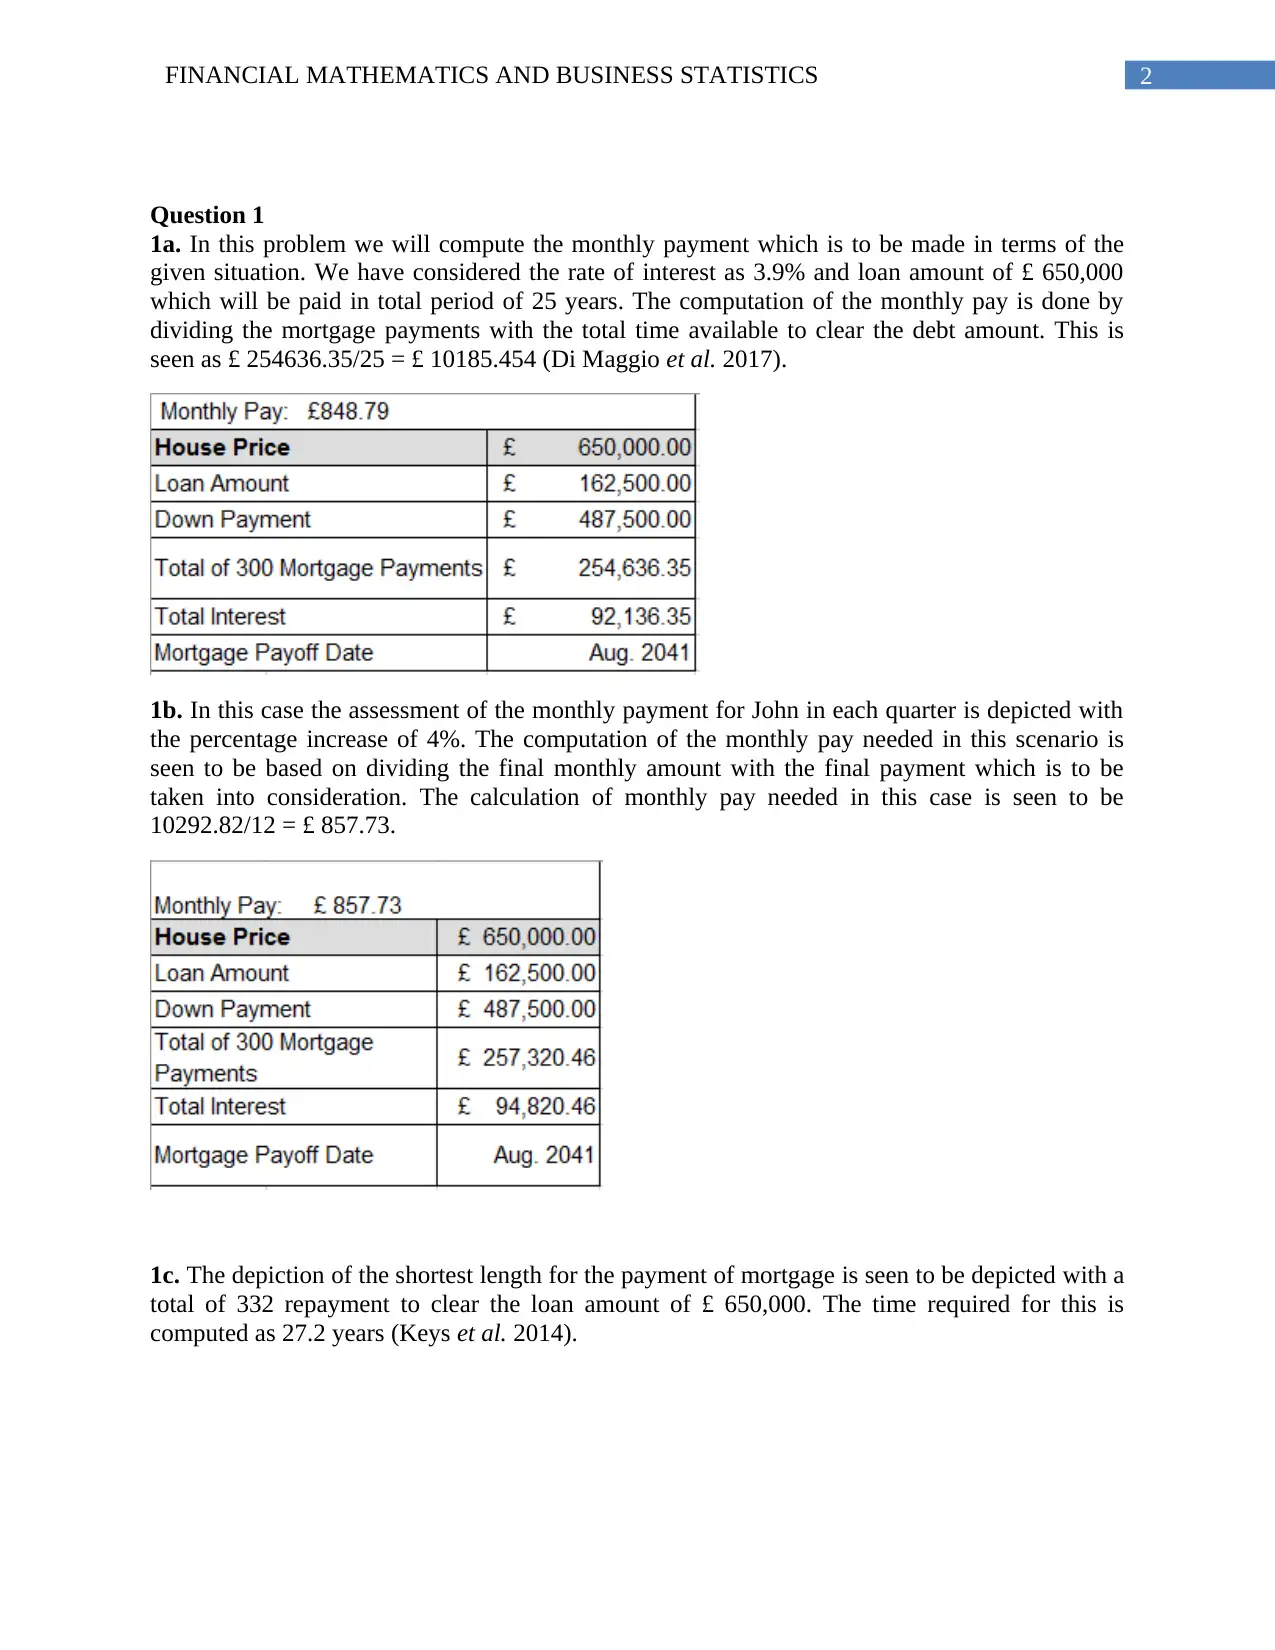
1a. In this problem we will compute the monthly payment which is to be made in terms of the
given situation. We have considered the rate of interest as 3.9% and loan amount of £ 650,000
which will be paid in total period of 25 years. The computation of the monthly pay is done by
dividing the mortgage payments with the total time available to clear the debt amount. This is
seen as £ 254636.35/25 = £ 10185.454 (Di Maggio et al. 2017).
1b. In this case the assessment of the monthly payment for John in each quarter is depicted with
the percentage increase of 4%. The computation of the monthly pay needed in this scenario is
seen to be based on dividing the final monthly amount with the final payment which is to be
taken into consideration. The calculation of monthly pay needed in this case is seen to be
10292.82/12 = £ 857.73.
1c. The depiction of the shortest length for the payment of mortgage is seen to be depicted with a
total of 332 repayment to clear the loan amount of £ 650,000. The time required for this is
computed as 27.2 years (Keys et al. 2014).
Question 1
1a. In this problem we will compute the monthly payment which is to be made in terms of the
given situation. We have considered the rate of interest as 3.9% and loan amount of £ 650,000
which will be paid in total period of 25 years. The computation of the monthly pay is done by
dividing the mortgage payments with the total time available to clear the debt amount. This is
seen as £ 254636.35/25 = £ 10185.454 (Di Maggio et al. 2017).
1b. In this case the assessment of the monthly payment for John in each quarter is depicted with
the percentage increase of 4%. The computation of the monthly pay needed in this scenario is
seen to be based on dividing the final monthly amount with the final payment which is to be
taken into consideration. The calculation of monthly pay needed in this case is seen to be
10292.82/12 = £ 857.73.
1c. The depiction of the shortest length for the payment of mortgage is seen to be depicted with a
total of 332 repayment to clear the loan amount of £ 650,000. The time required for this is
computed as 27.2 years (Keys et al. 2014).
3FINANCIAL MATHEMATICS AND BUSINESS STATISTICS
Question 2
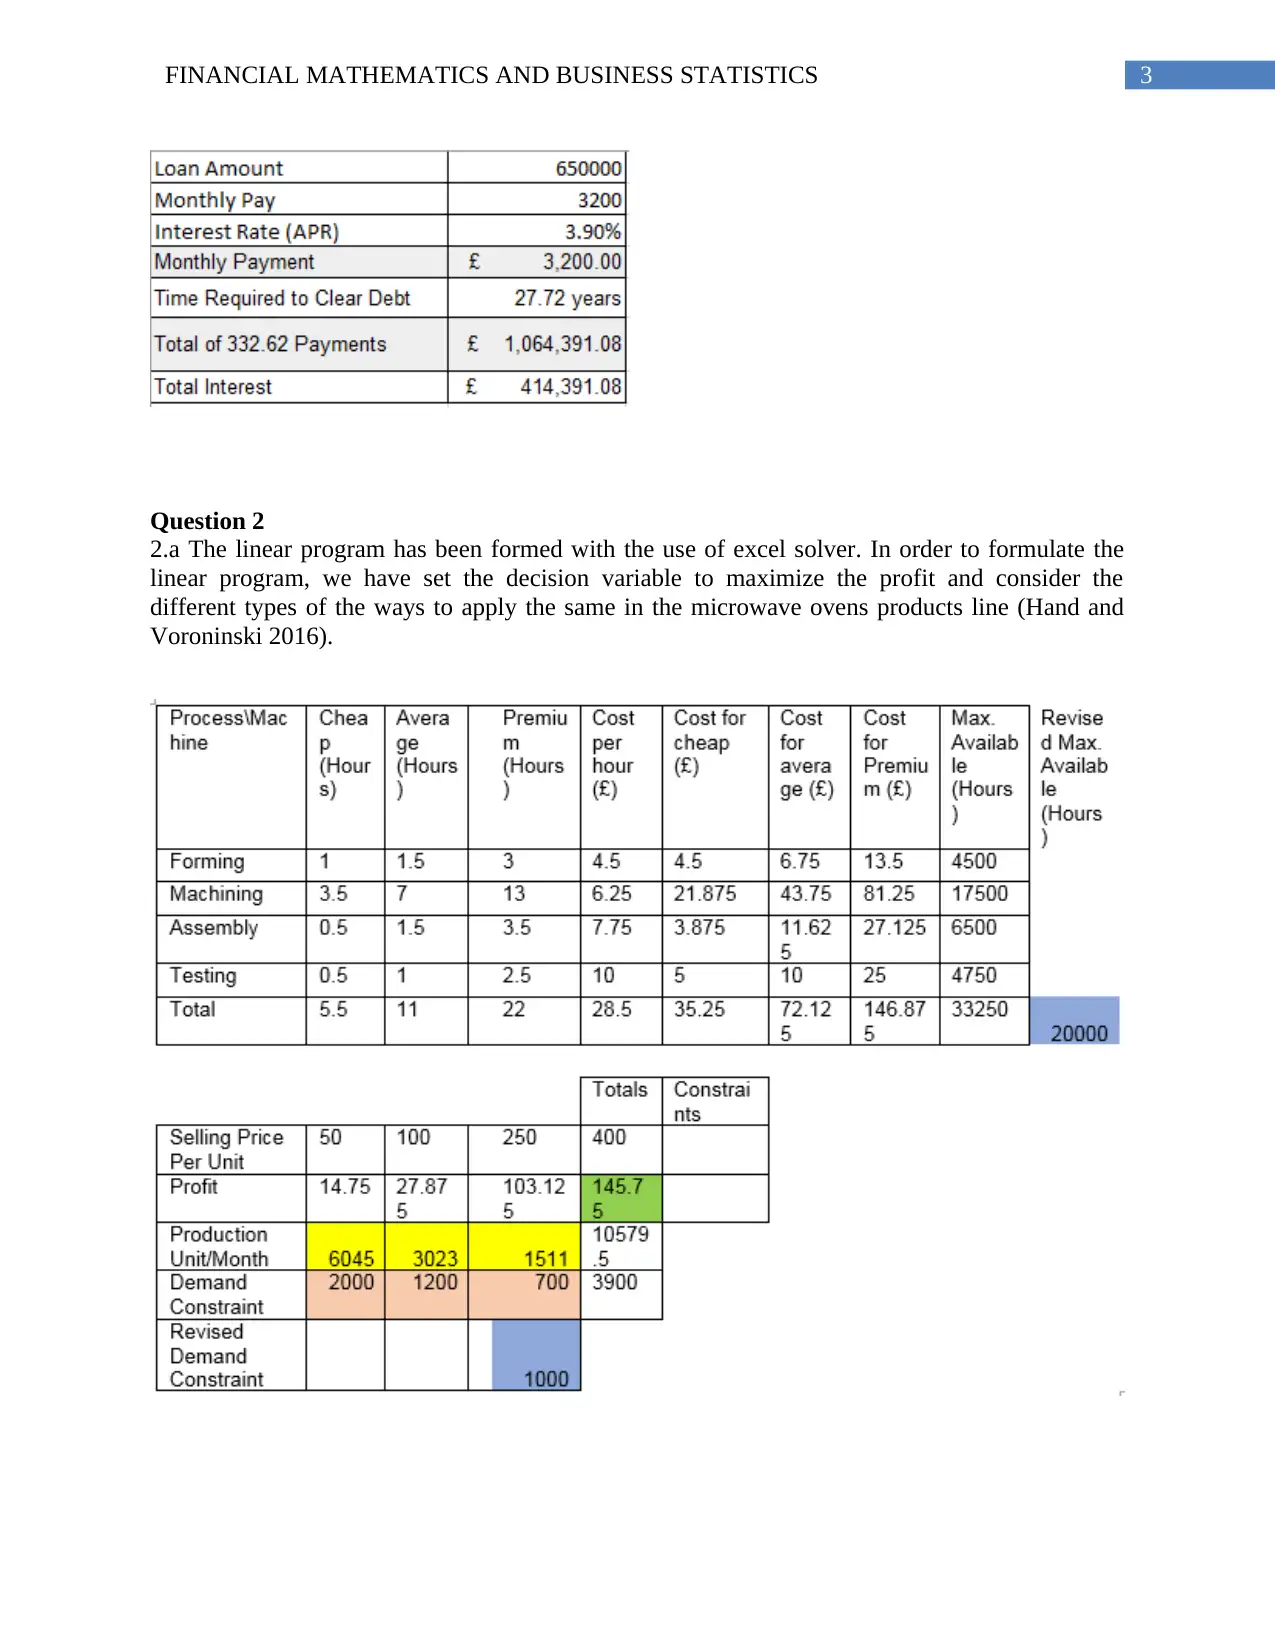
2.a The linear program has been formed with the use of excel solver. In order to formulate the
linear program, we have set the decision variable to maximize the profit and consider the
different types of the ways to apply the same in the microwave ovens products line (Hand and
Voroninski 2016).
Question 2
2.a The linear program has been formed with the use of excel solver. In order to formulate the
linear program, we have set the decision variable to maximize the profit and consider the
different types of the ways to apply the same in the microwave ovens products line (Hand and
Voroninski 2016).
Secure Best Marks with AI Grader
Need help grading? Try our AI Grader for instant feedback on your assignments.
4FINANCIAL MATHEMATICS AND BUSINESS STATISTICS
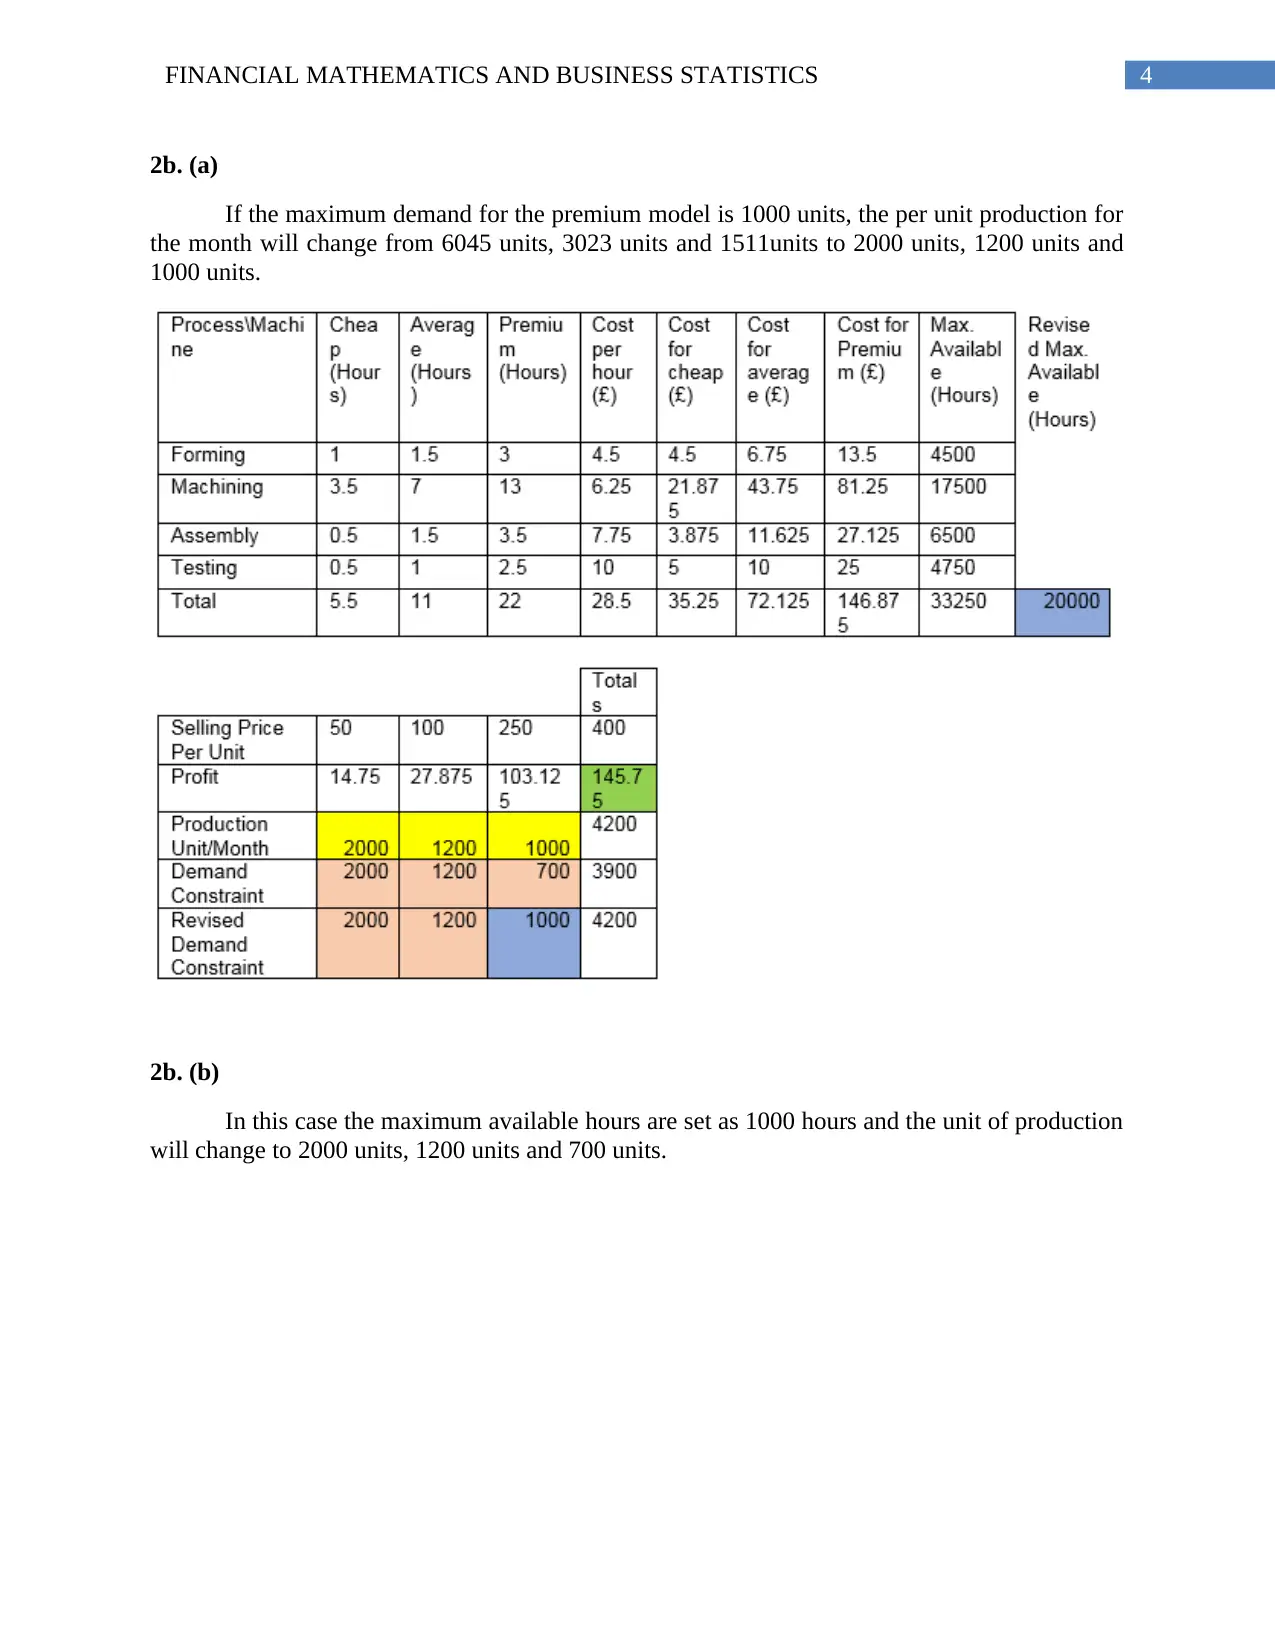
2b. (a)
If the maximum demand for the premium model is 1000 units, the per unit production for
the month will change from 6045 units, 3023 units and 1511units to 2000 units, 1200 units and
1000 units.
2b. (b)
In this case the maximum available hours are set as 1000 hours and the unit of production
will change to 2000 units, 1200 units and 700 units.
5FINANCIAL MATHEMATICS AND BUSINESS STATISTICS
2c.
As per the given situation the problem formulated has been considered with the
overproduction of the materials. The product demand has been seen to be 2000 units for the
cheap, 1200 units for the average and 700 units for the premium process. Despite of this, the
production of the materials is seen as 6045 units, 3023 units and 1511 units. It shows that there is
a significant need for optimization for the monthly production units and maximize the overall
profit of the company (Ware, Singh and Banwet 2014).
If the premium model’s demand was 1000 units, it would have been adequate for the
company for producing 2000 units for the cheaper variant of the product, 1200 for the average
variant and 1000 for the premium variant of product. Moreover, the if available machine hours
are seen to be 2000 units then the company is required to produce 2000 of the cheap ovens, 1200
of the average ovens and 700 of the premium ovens. Henceforth, it is recommended for the
company to maintain a production level of 2000 units of the cheap variant, 1000 units of the
premium variant and 1200 units for the average variant.
The marketing of the product needs to be further based on the motto of earning the
maximum profit and strategy formulation aimed at promoting the products in the cheap and
average category. The rationale for the decision is further taken into consideration with the
demand constraint. It seen that the demand for the average and cheap product is highest in
6FINANCIAL MATHEMATICS AND BUSINESS STATISTICS
nature. This strategy will be able to reduce the costs and increase the profit ( Gallego, Ratliff and
Shebalov 2014).
Question 3
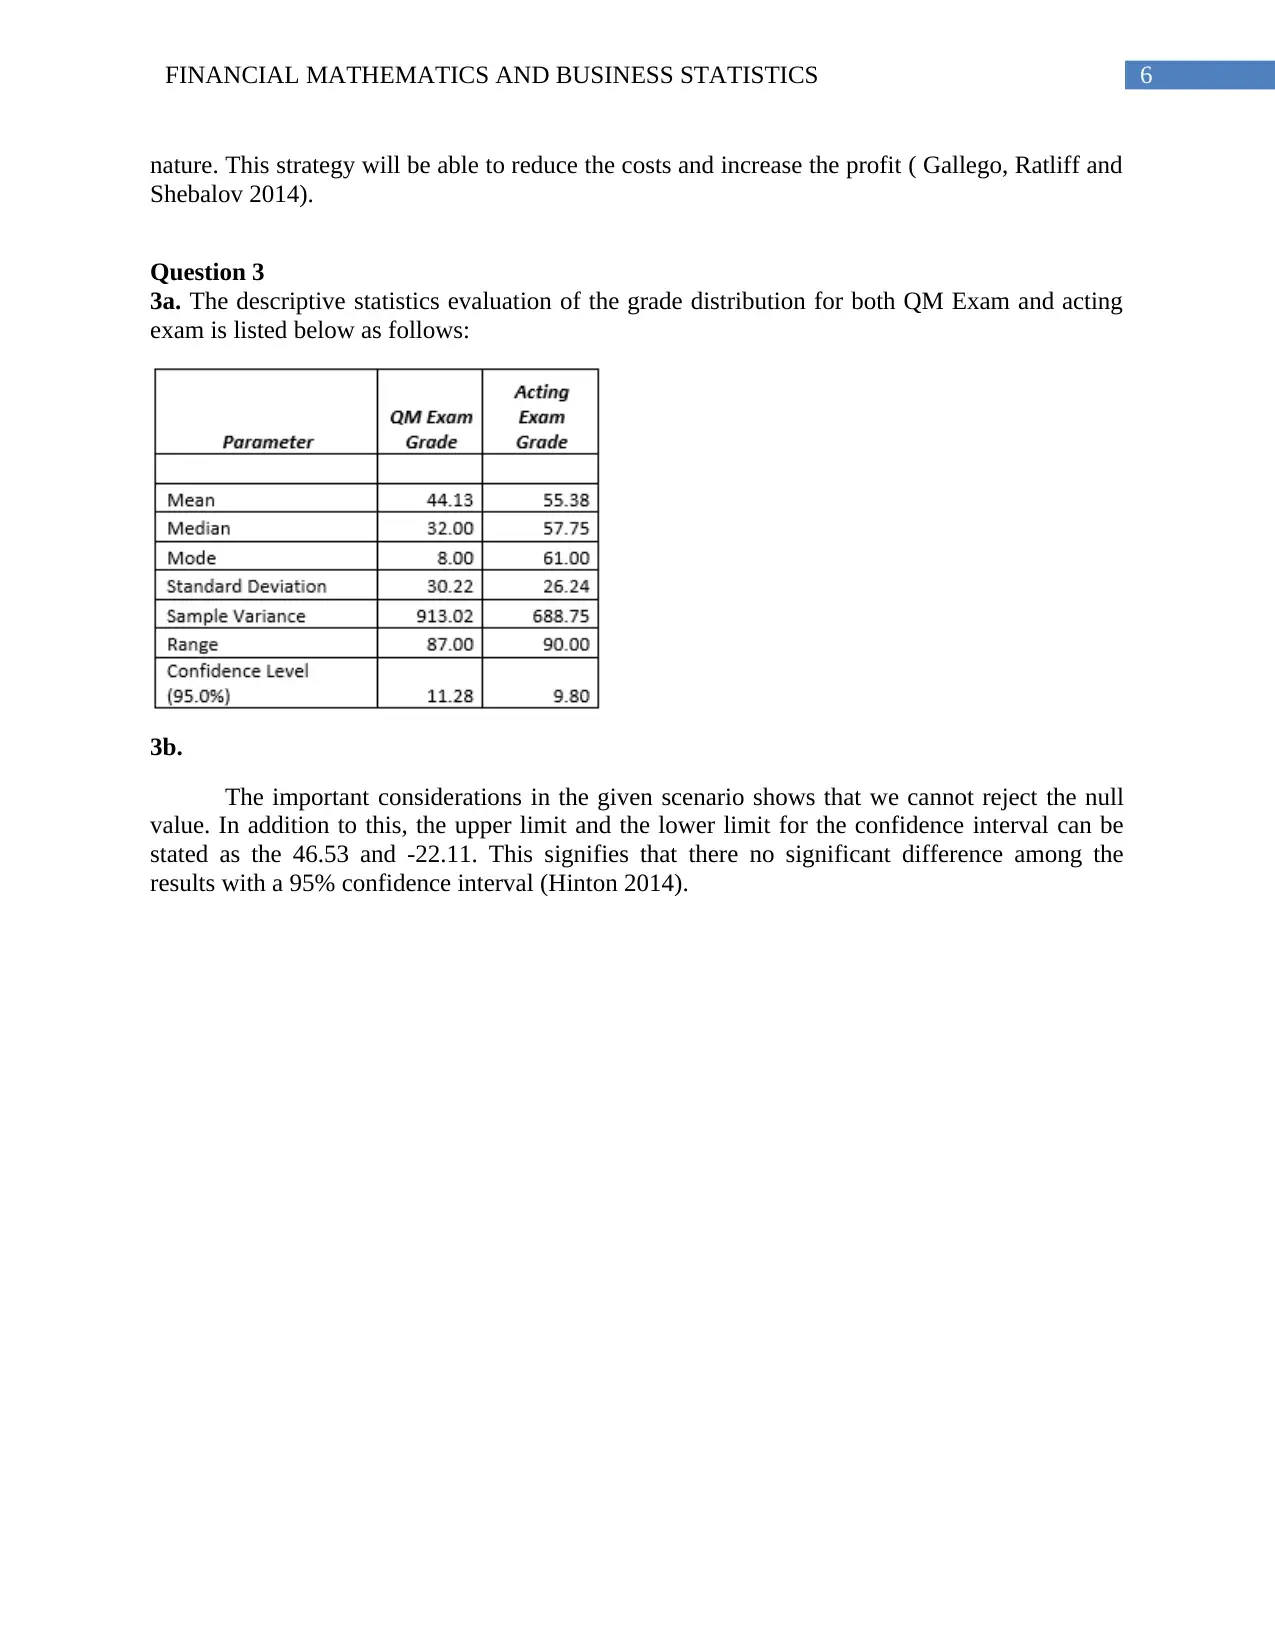
3a. The descriptive statistics evaluation of the grade distribution for both QM Exam and acting
exam is listed below as follows:
3b.
The important considerations in the given scenario shows that we cannot reject the null
value. In addition to this, the upper limit and the lower limit for the confidence interval can be
stated as the 46.53 and -22.11. This signifies that there no significant difference among the
results with a 95% confidence interval (Hinton 2014).
nature. This strategy will be able to reduce the costs and increase the profit ( Gallego, Ratliff and
Shebalov 2014).
Question 3
3a. The descriptive statistics evaluation of the grade distribution for both QM Exam and acting
exam is listed below as follows:
3b.
The important considerations in the given scenario shows that we cannot reject the null
value. In addition to this, the upper limit and the lower limit for the confidence interval can be
stated as the 46.53 and -22.11. This signifies that there no significant difference among the
results with a 95% confidence interval (Hinton 2014).
Paraphrase This Document
Need a fresh take? Get an instant paraphrase of this document with our AI Paraphraser
7FINANCIAL MATHEMATICS AND BUSINESS STATISTICS
3c. The summarization of the various output for the regression analysis of QM study is depicted
as 0.35. The comparison of the value of the summary output pertaining to the acting exam is
determined as 0.4. Henceforth, it can be stated that the acting exam study hours is having more
impact on the grades of the exams. The computed result is also seen to be significant in nature
(Meret, Hellström and Hagelund 2015).
8FINANCIAL MATHEMATICS AND BUSINESS STATISTICS
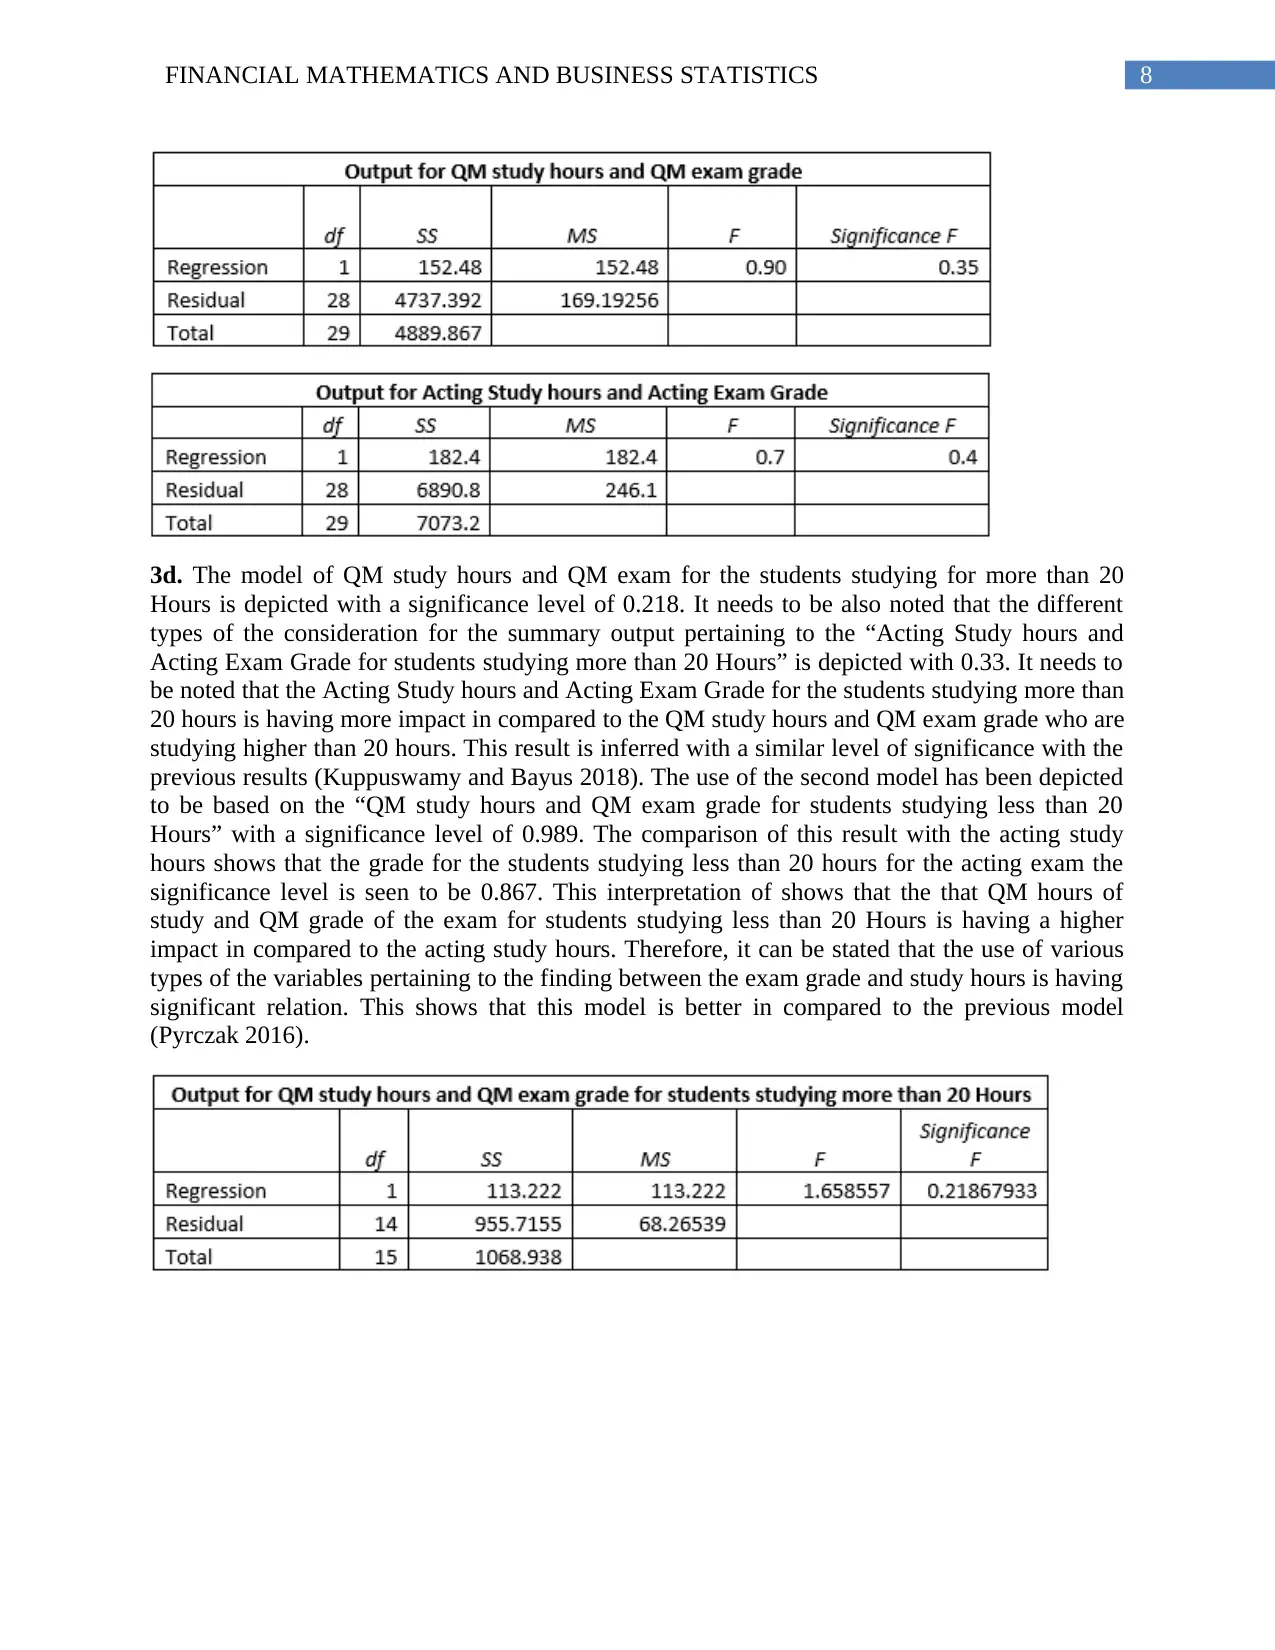
3d. The model of QM study hours and QM exam for the students studying for more than 20
Hours is depicted with a significance level of 0.218. It needs to be also noted that the different
types of the consideration for the summary output pertaining to the “Acting Study hours and
Acting Exam Grade for students studying more than 20 Hours” is depicted with 0.33. It needs to
be noted that the Acting Study hours and Acting Exam Grade for the students studying more than
20 hours is having more impact in compared to the QM study hours and QM exam grade who are
studying higher than 20 hours. This result is inferred with a similar level of significance with the
previous results (Kuppuswamy and Bayus 2018). The use of the second model has been depicted
to be based on the “QM study hours and QM exam grade for students studying less than 20
Hours” with a significance level of 0.989. The comparison of this result with the acting study
hours shows that the grade for the students studying less than 20 hours for the acting exam the
significance level is seen to be 0.867. This interpretation of shows that the that QM hours of
study and QM grade of the exam for students studying less than 20 Hours is having a higher
impact in compared to the acting study hours. Therefore, it can be stated that the use of various
types of the variables pertaining to the finding between the exam grade and study hours is having
significant relation. This shows that this model is better in compared to the previous model
(Pyrczak 2016).
9FINANCIAL MATHEMATICS AND BUSINESS STATISTICS
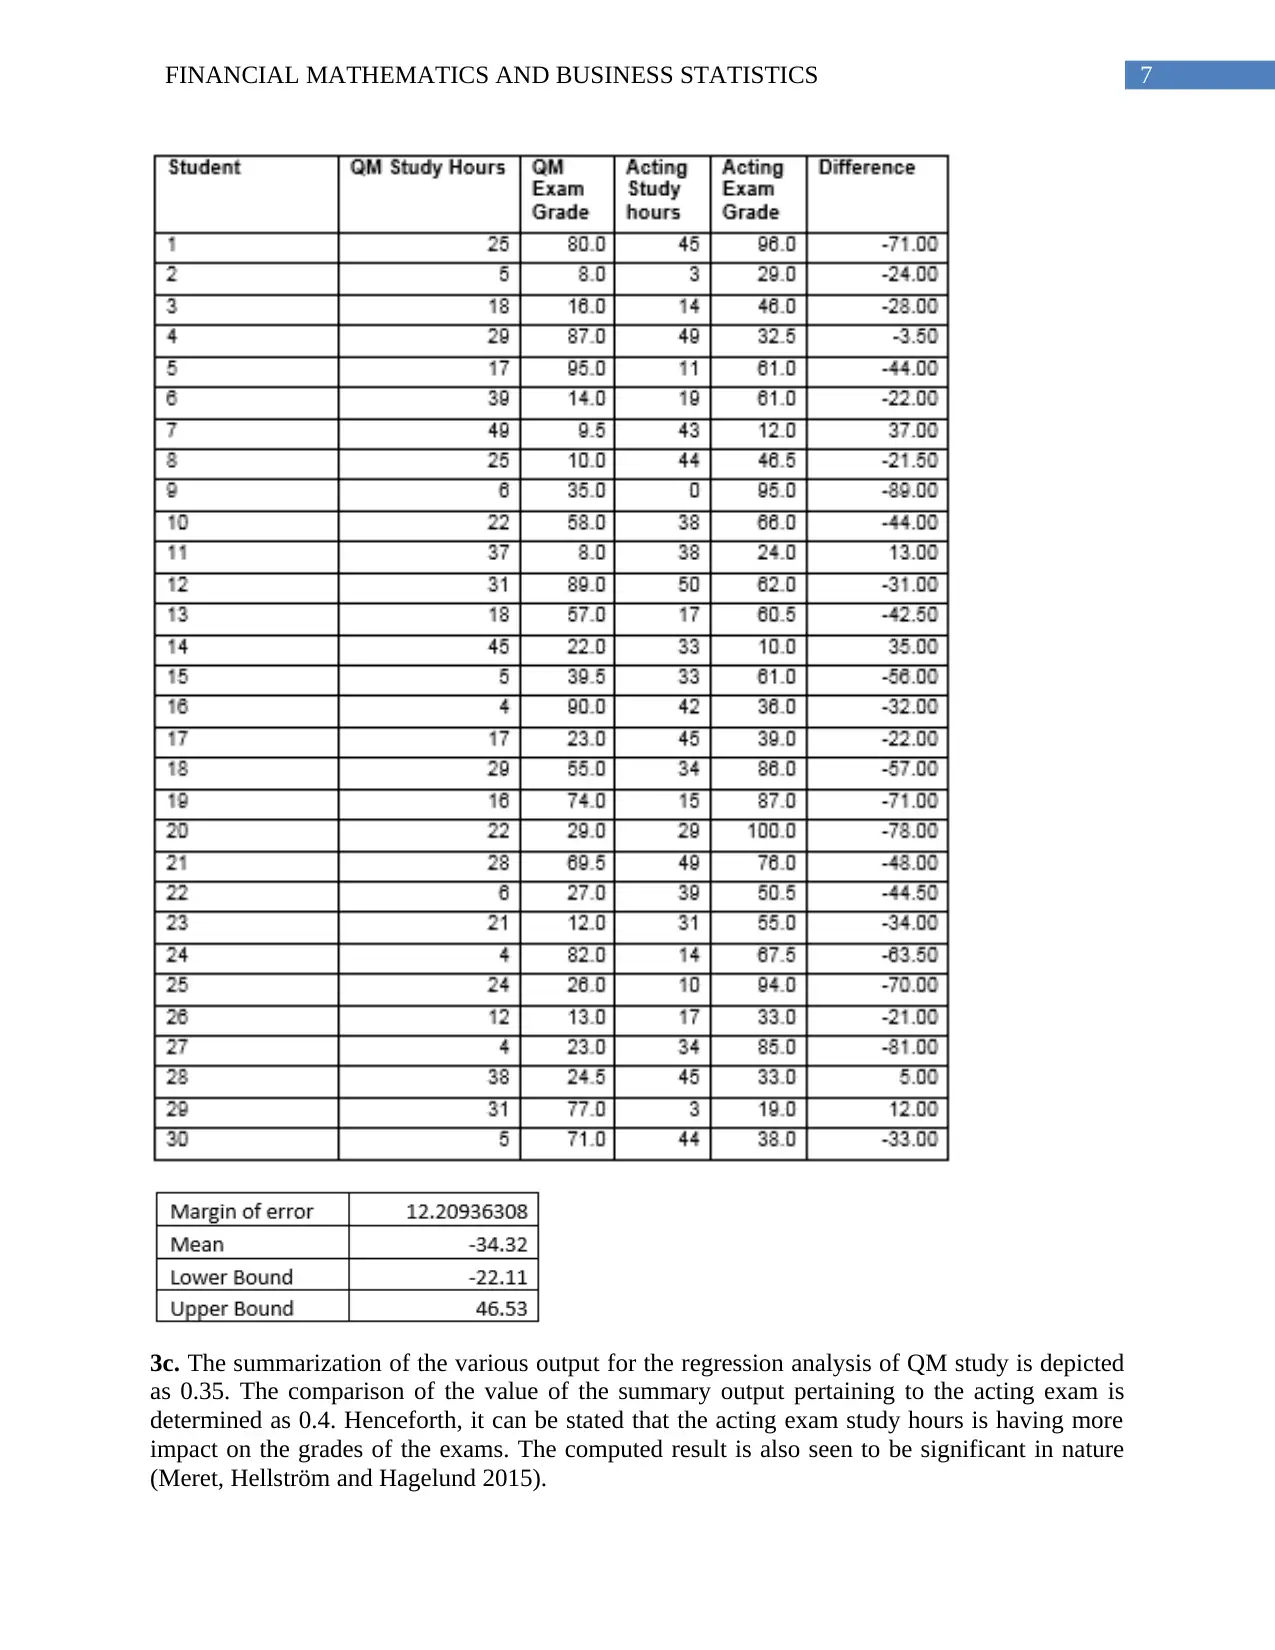
3e.
I have found inconsistencies within the data in many occasions. The most noteworthy
occasions relating to this needs to be seen with the fact that despite there is less number of the
study hours, the students are able to achieve high grades. However, such a scenario is unrealistic
in a real examination. For example, if a student is specialised in the acting exam with zero hours
of study then also a grade of 95 is achieved by the student. Similarly, in case of considering the
QM exam, a student studying for four hours and five hours has also achieved a grade of 82 and
71. In contrast to this result, student studying for the 49 hours and 45 hours has still achieved a
grade of only 9.5 and 22 in the exam. This shows that the replication of the results will not be
possible in a real exam (Plesinger et al. 2015).
Question 4
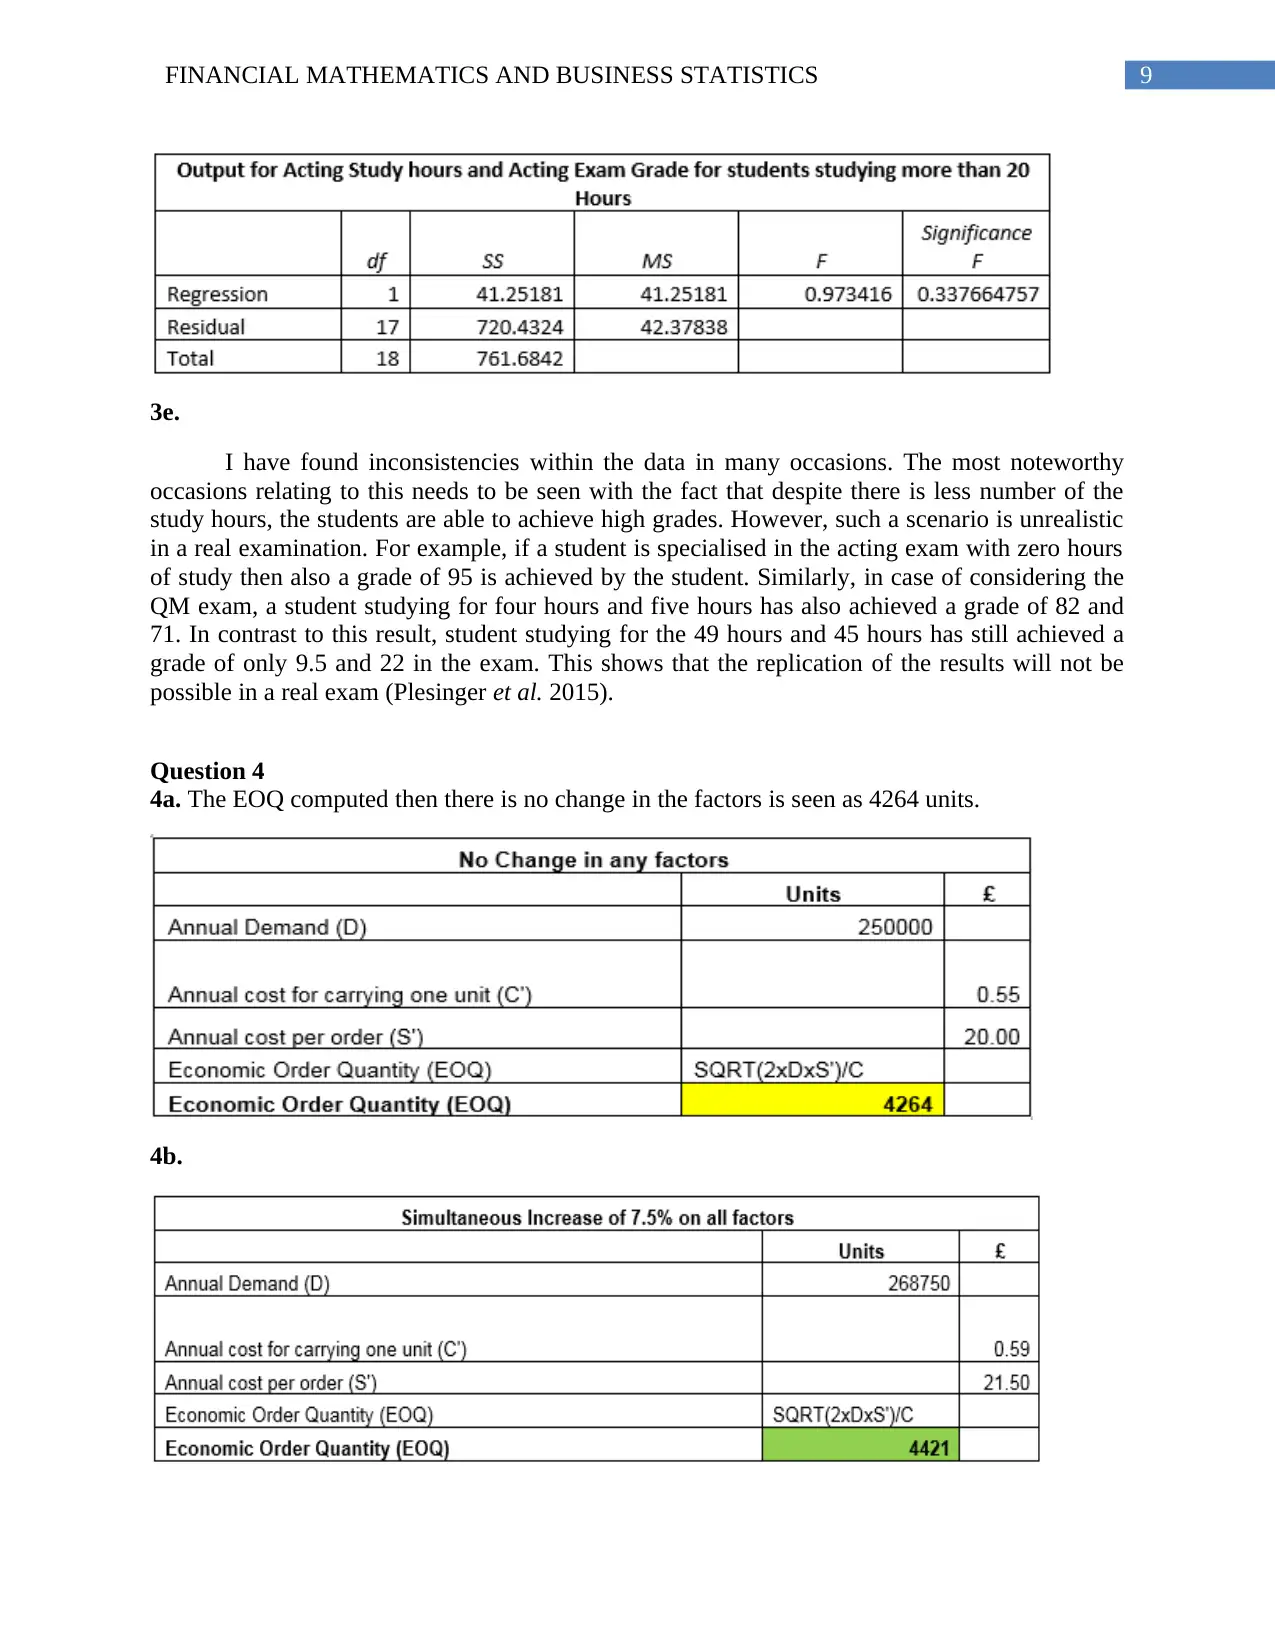
4a. The EOQ computed then there is no change in the factors is seen as 4264 units.
4b.
3e.
I have found inconsistencies within the data in many occasions. The most noteworthy
occasions relating to this needs to be seen with the fact that despite there is less number of the
study hours, the students are able to achieve high grades. However, such a scenario is unrealistic
in a real examination. For example, if a student is specialised in the acting exam with zero hours
of study then also a grade of 95 is achieved by the student. Similarly, in case of considering the
QM exam, a student studying for four hours and five hours has also achieved a grade of 82 and
71. In contrast to this result, student studying for the 49 hours and 45 hours has still achieved a
grade of only 9.5 and 22 in the exam. This shows that the replication of the results will not be
possible in a real exam (Plesinger et al. 2015).
Question 4
4a. The EOQ computed then there is no change in the factors is seen as 4264 units.
4b.
Secure Best Marks with AI Grader
Need help grading? Try our AI Grader for instant feedback on your assignments.
10FINANCIAL MATHEMATICS AND BUSINESS STATISTICS
11FINANCIAL MATHEMATICS AND BUSINESS STATISTICS
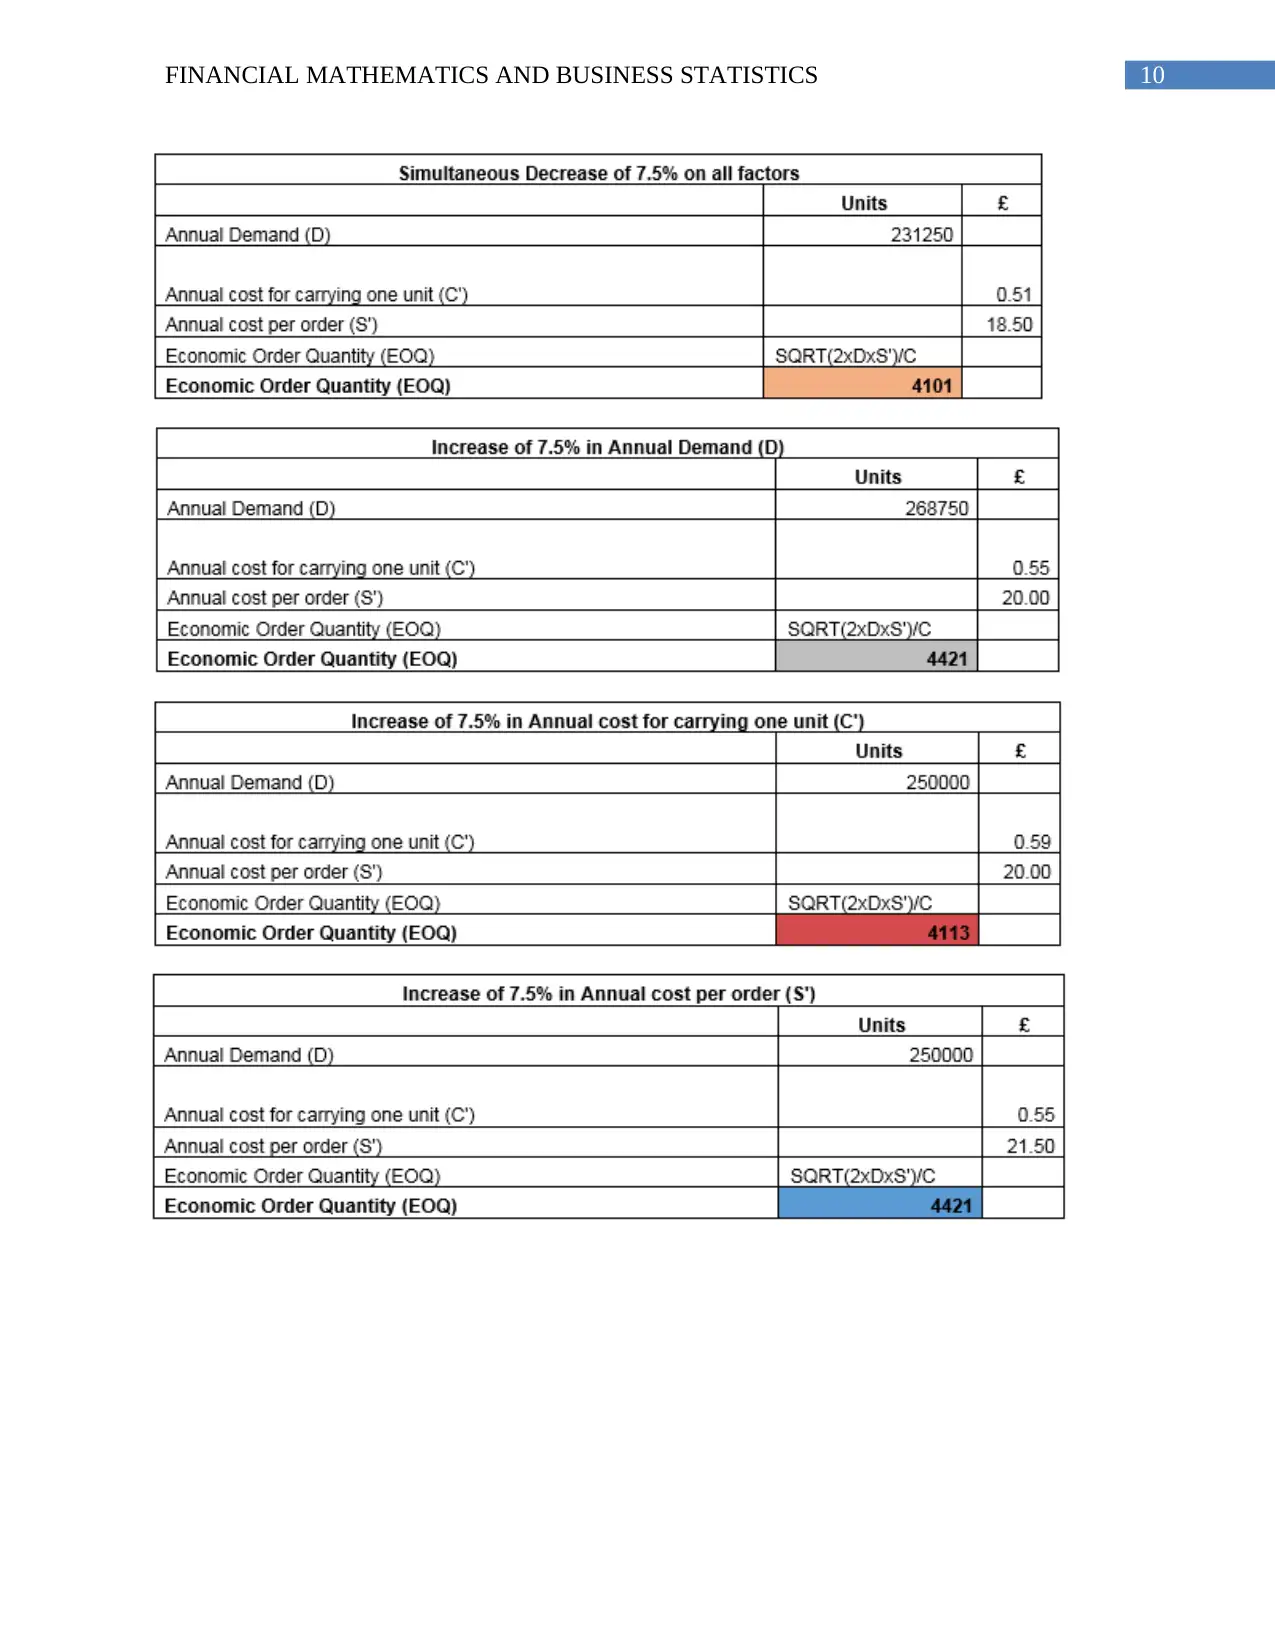
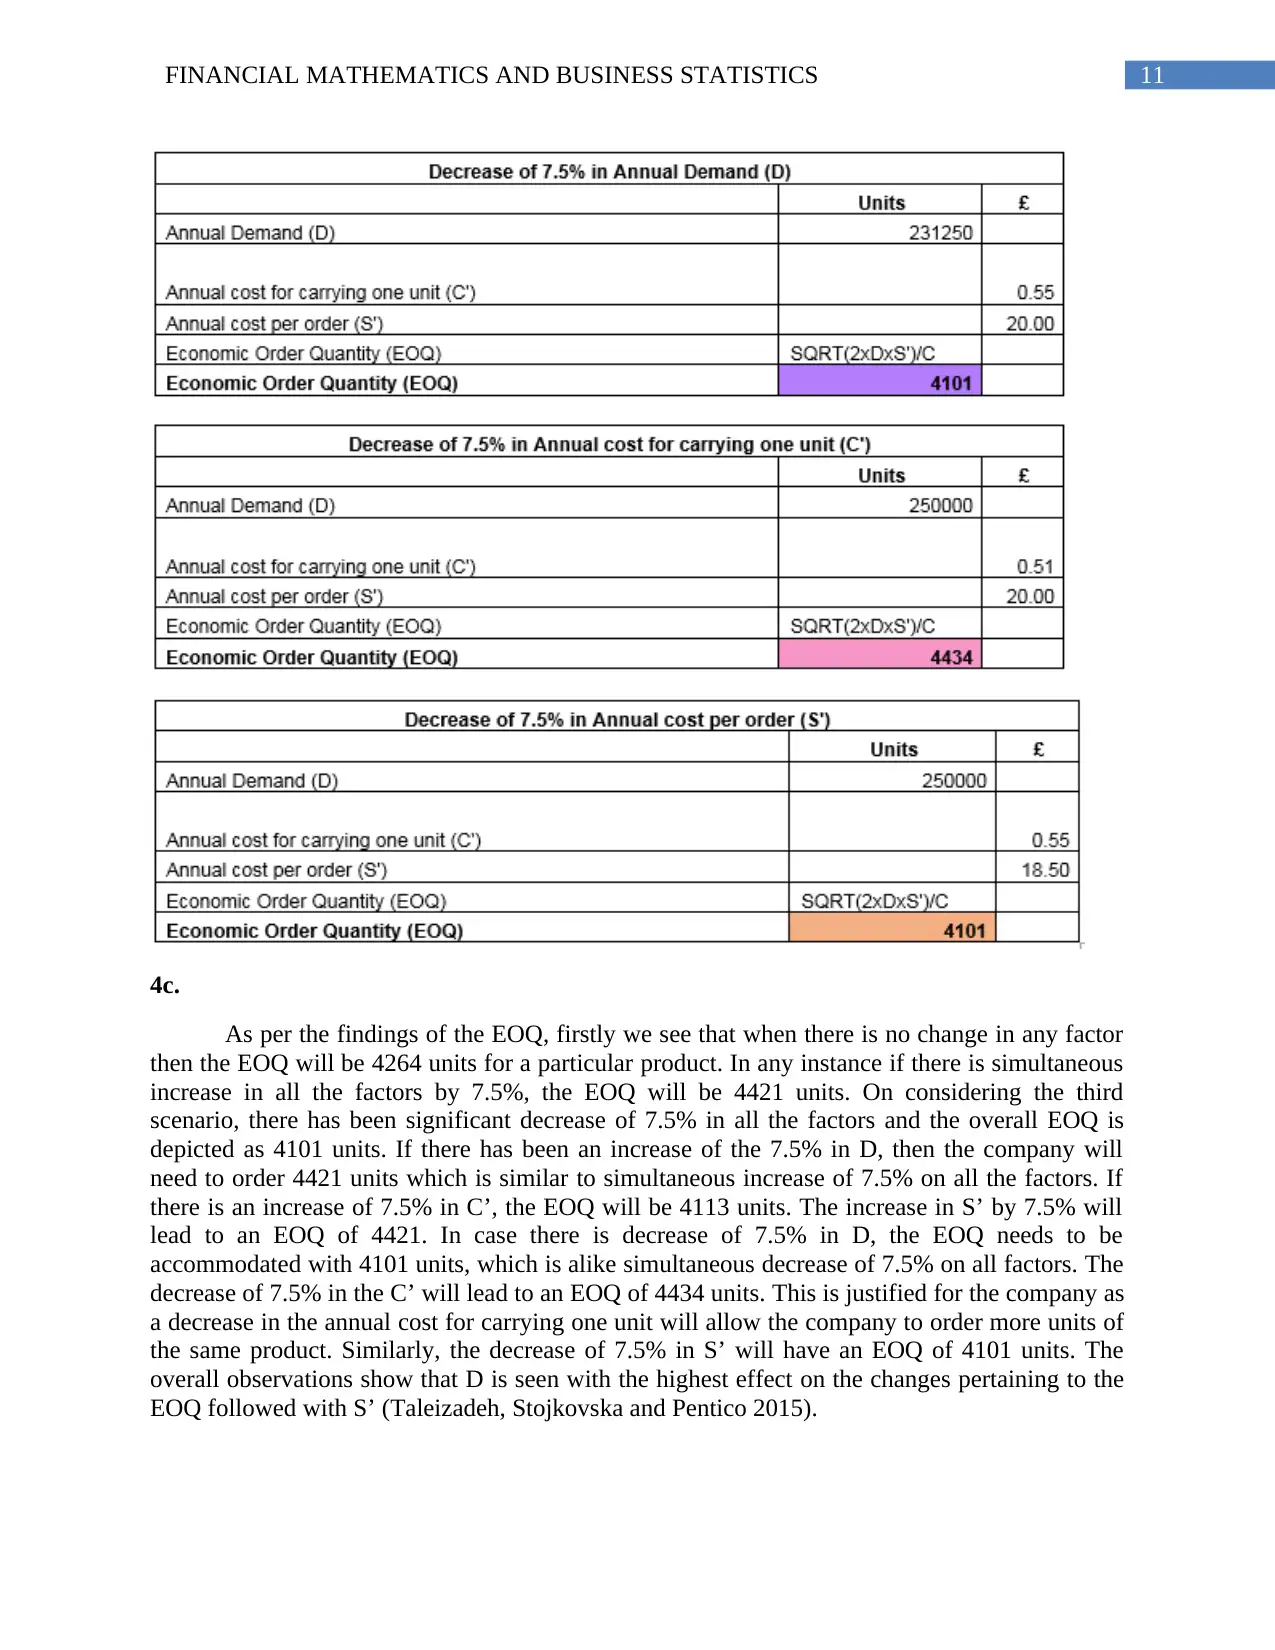
4c.
As per the findings of the EOQ, firstly we see that when there is no change in any factor
then the EOQ will be 4264 units for a particular product. In any instance if there is simultaneous
increase in all the factors by 7.5%, the EOQ will be 4421 units. On considering the third
scenario, there has been significant decrease of 7.5% in all the factors and the overall EOQ is
depicted as 4101 units. If there has been an increase of the 7.5% in D, then the company will
need to order 4421 units which is similar to simultaneous increase of 7.5% on all the factors. If
there is an increase of 7.5% in C’, the EOQ will be 4113 units. The increase in S’ by 7.5% will
lead to an EOQ of 4421. In case there is decrease of 7.5% in D, the EOQ needs to be
accommodated with 4101 units, which is alike simultaneous decrease of 7.5% on all factors. The
decrease of 7.5% in the C’ will lead to an EOQ of 4434 units. This is justified for the company as
a decrease in the annual cost for carrying one unit will allow the company to order more units of
the same product. Similarly, the decrease of 7.5% in S’ will have an EOQ of 4101 units. The
overall observations show that D is seen with the highest effect on the changes pertaining to the
EOQ followed with S’ (Taleizadeh, Stojkovska and Pentico 2015).
12FINANCIAL MATHEMATICS AND BUSINESS STATISTICS
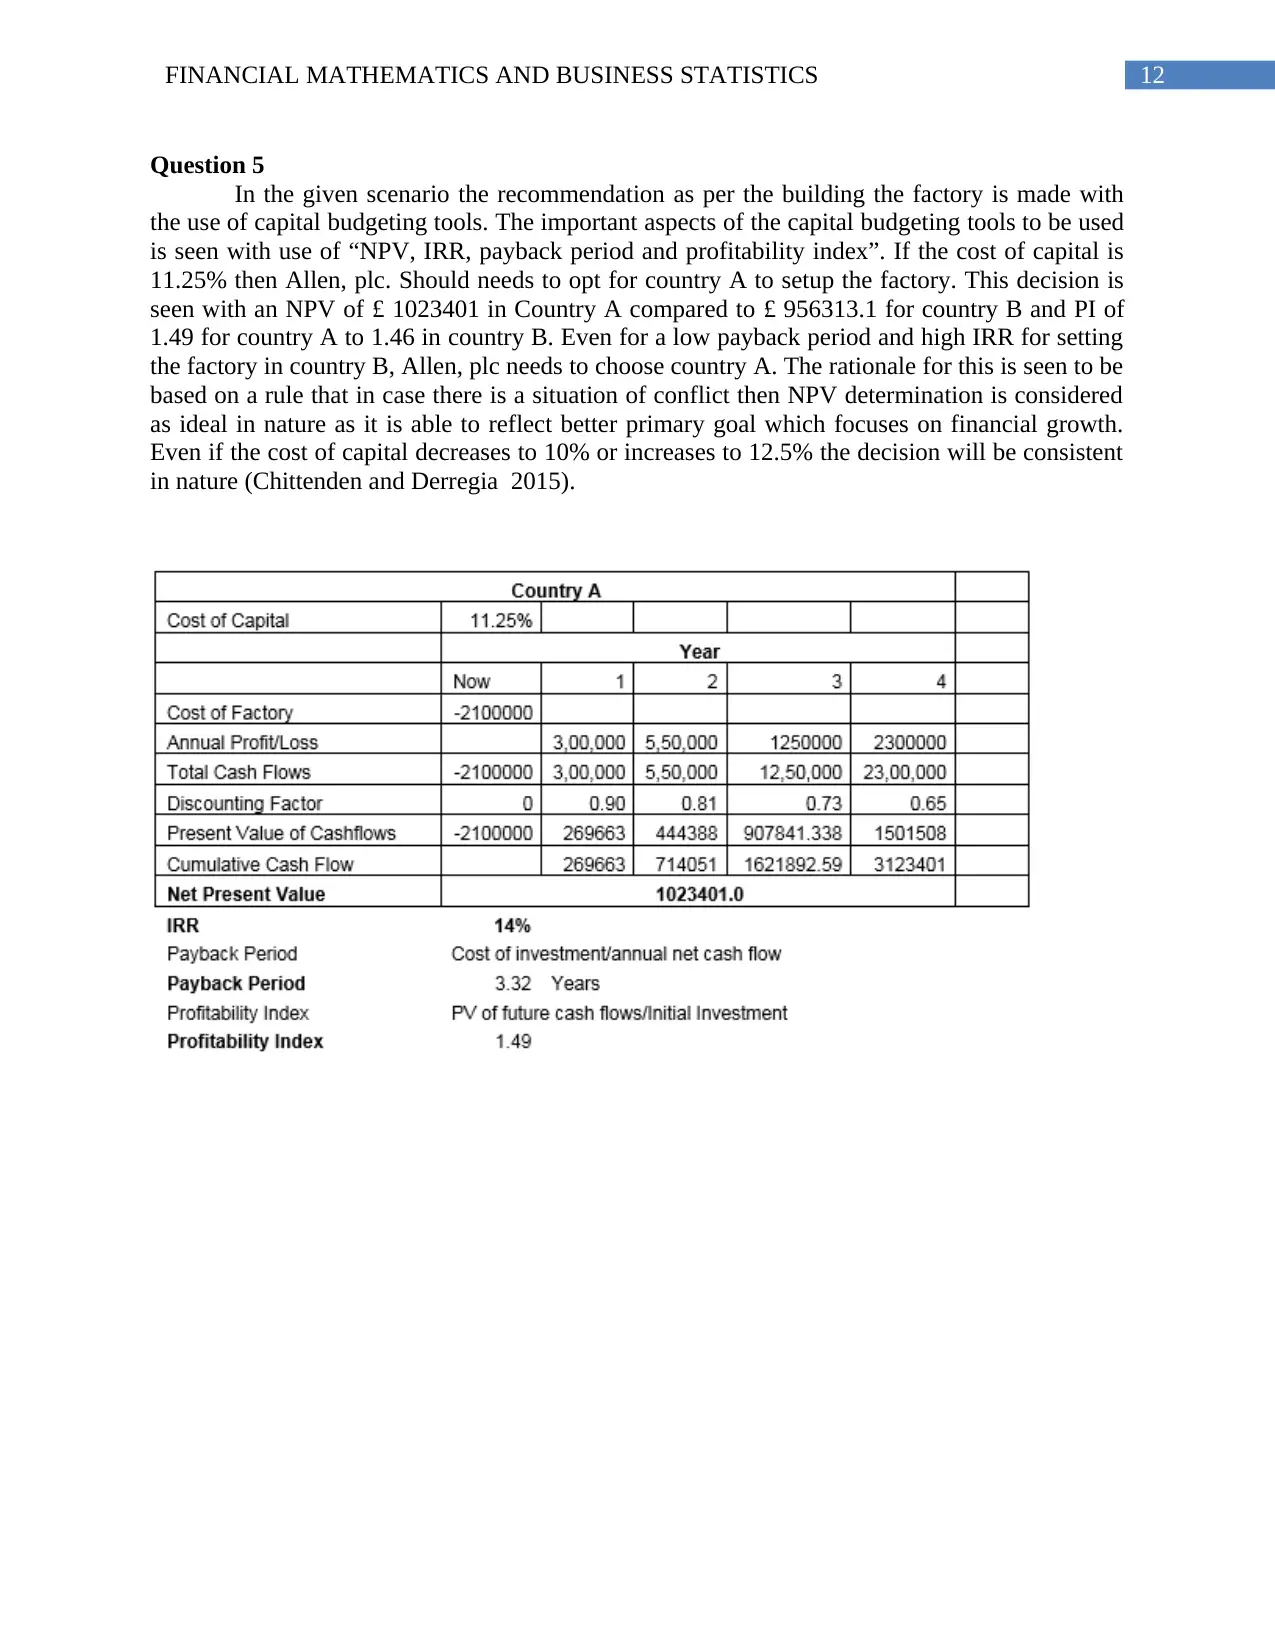
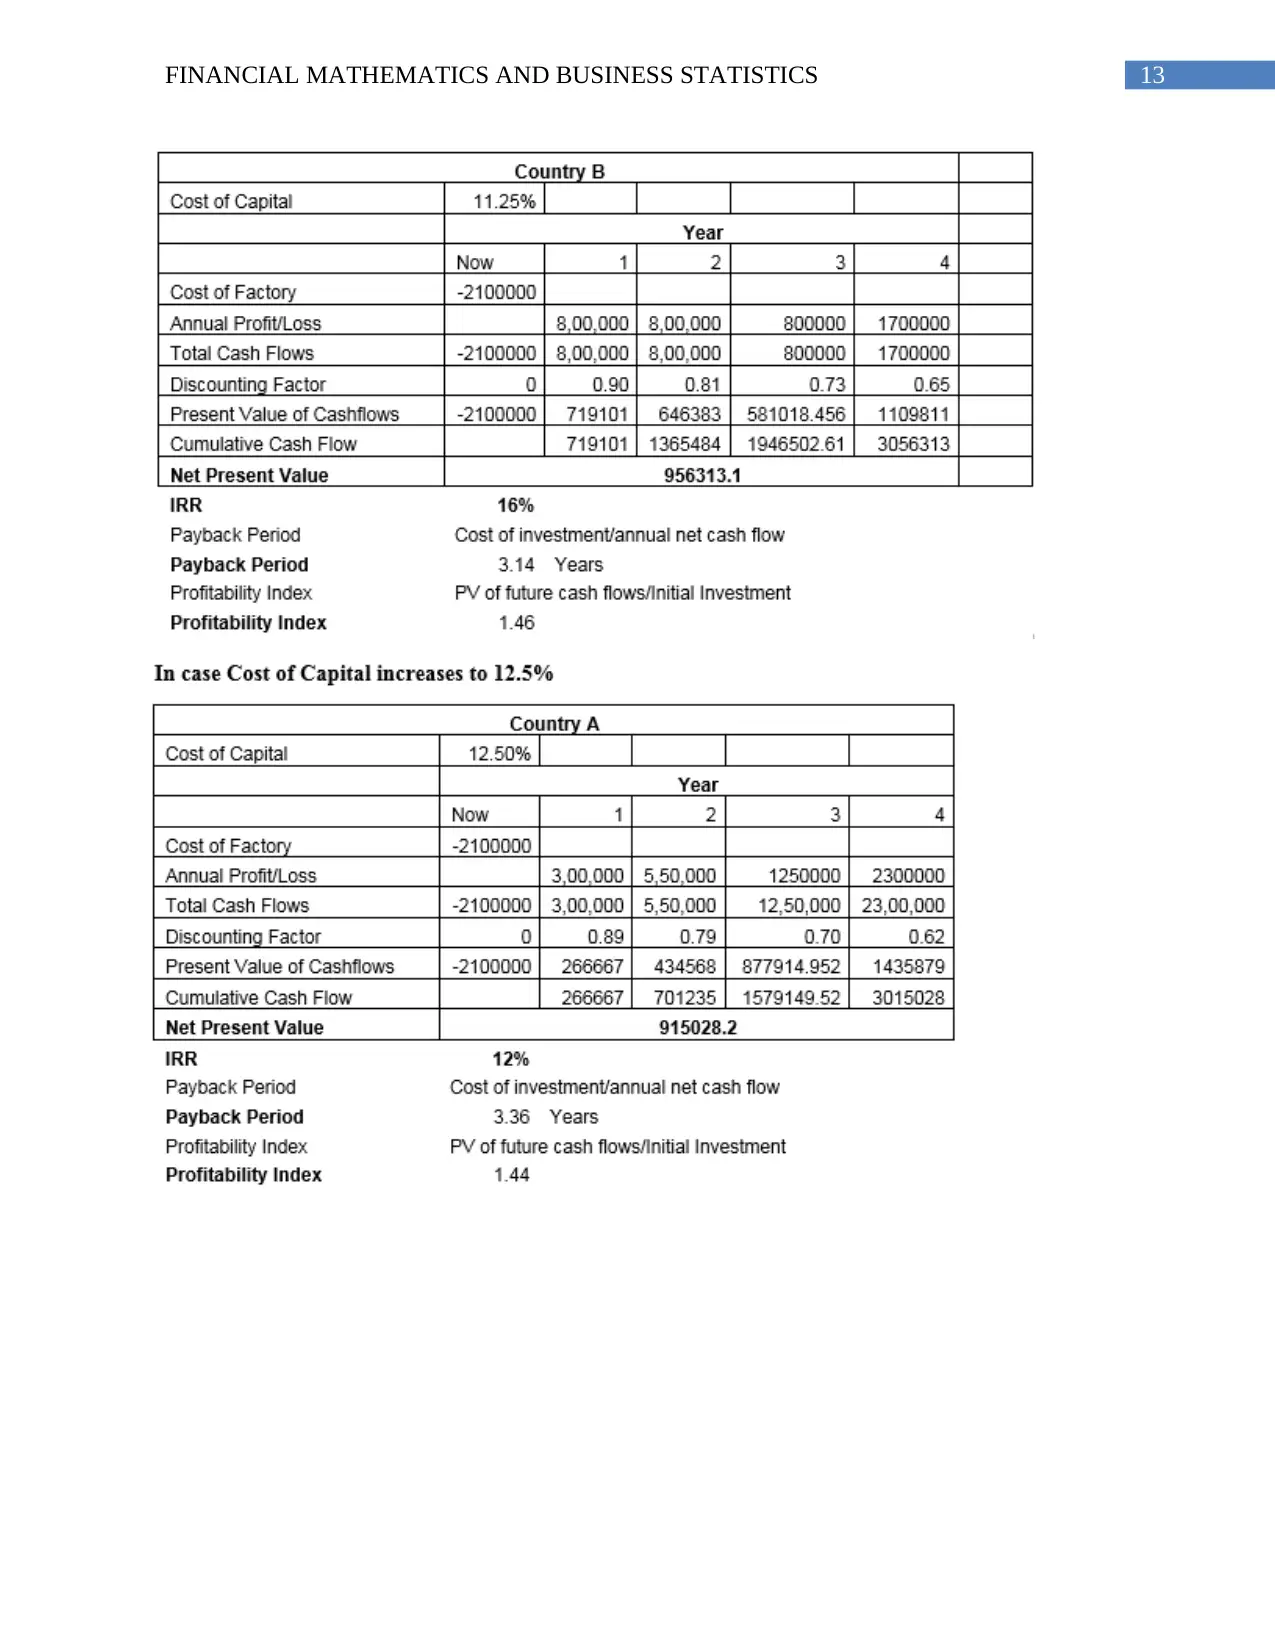
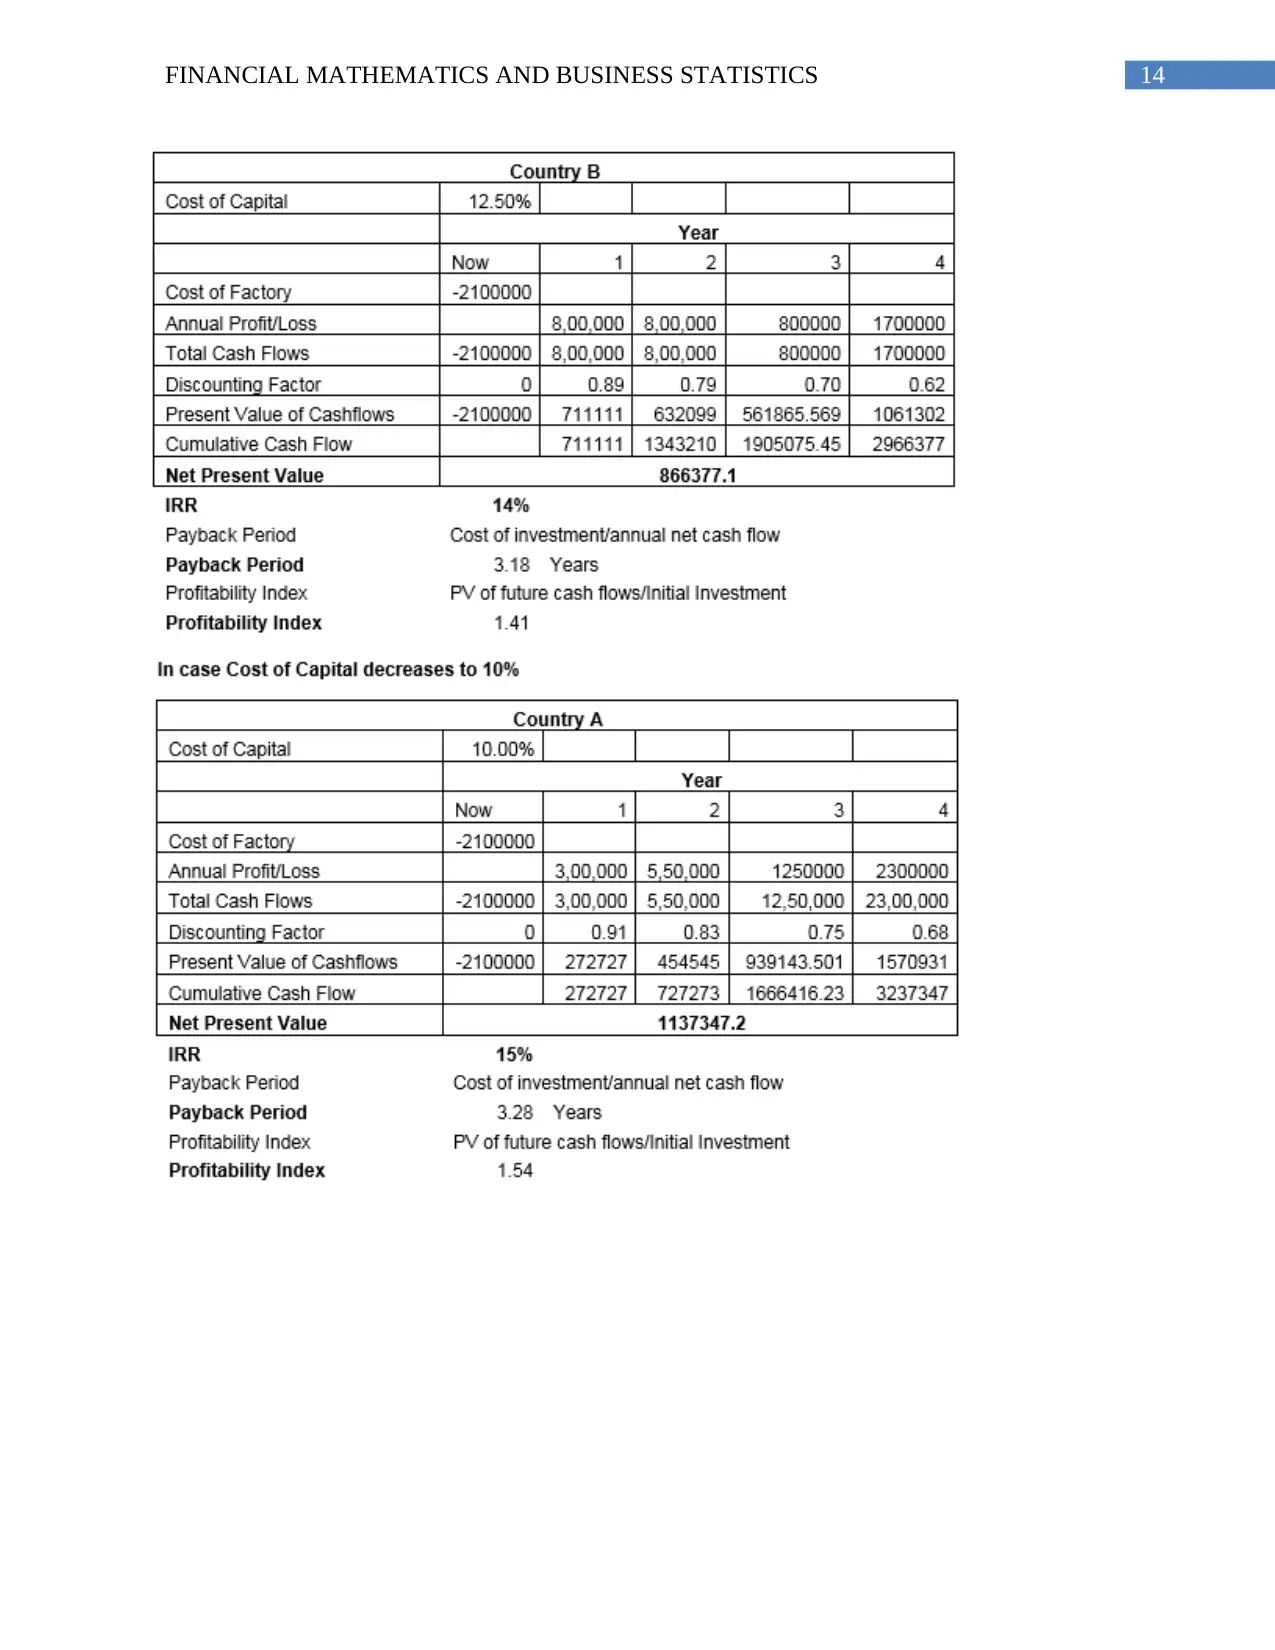
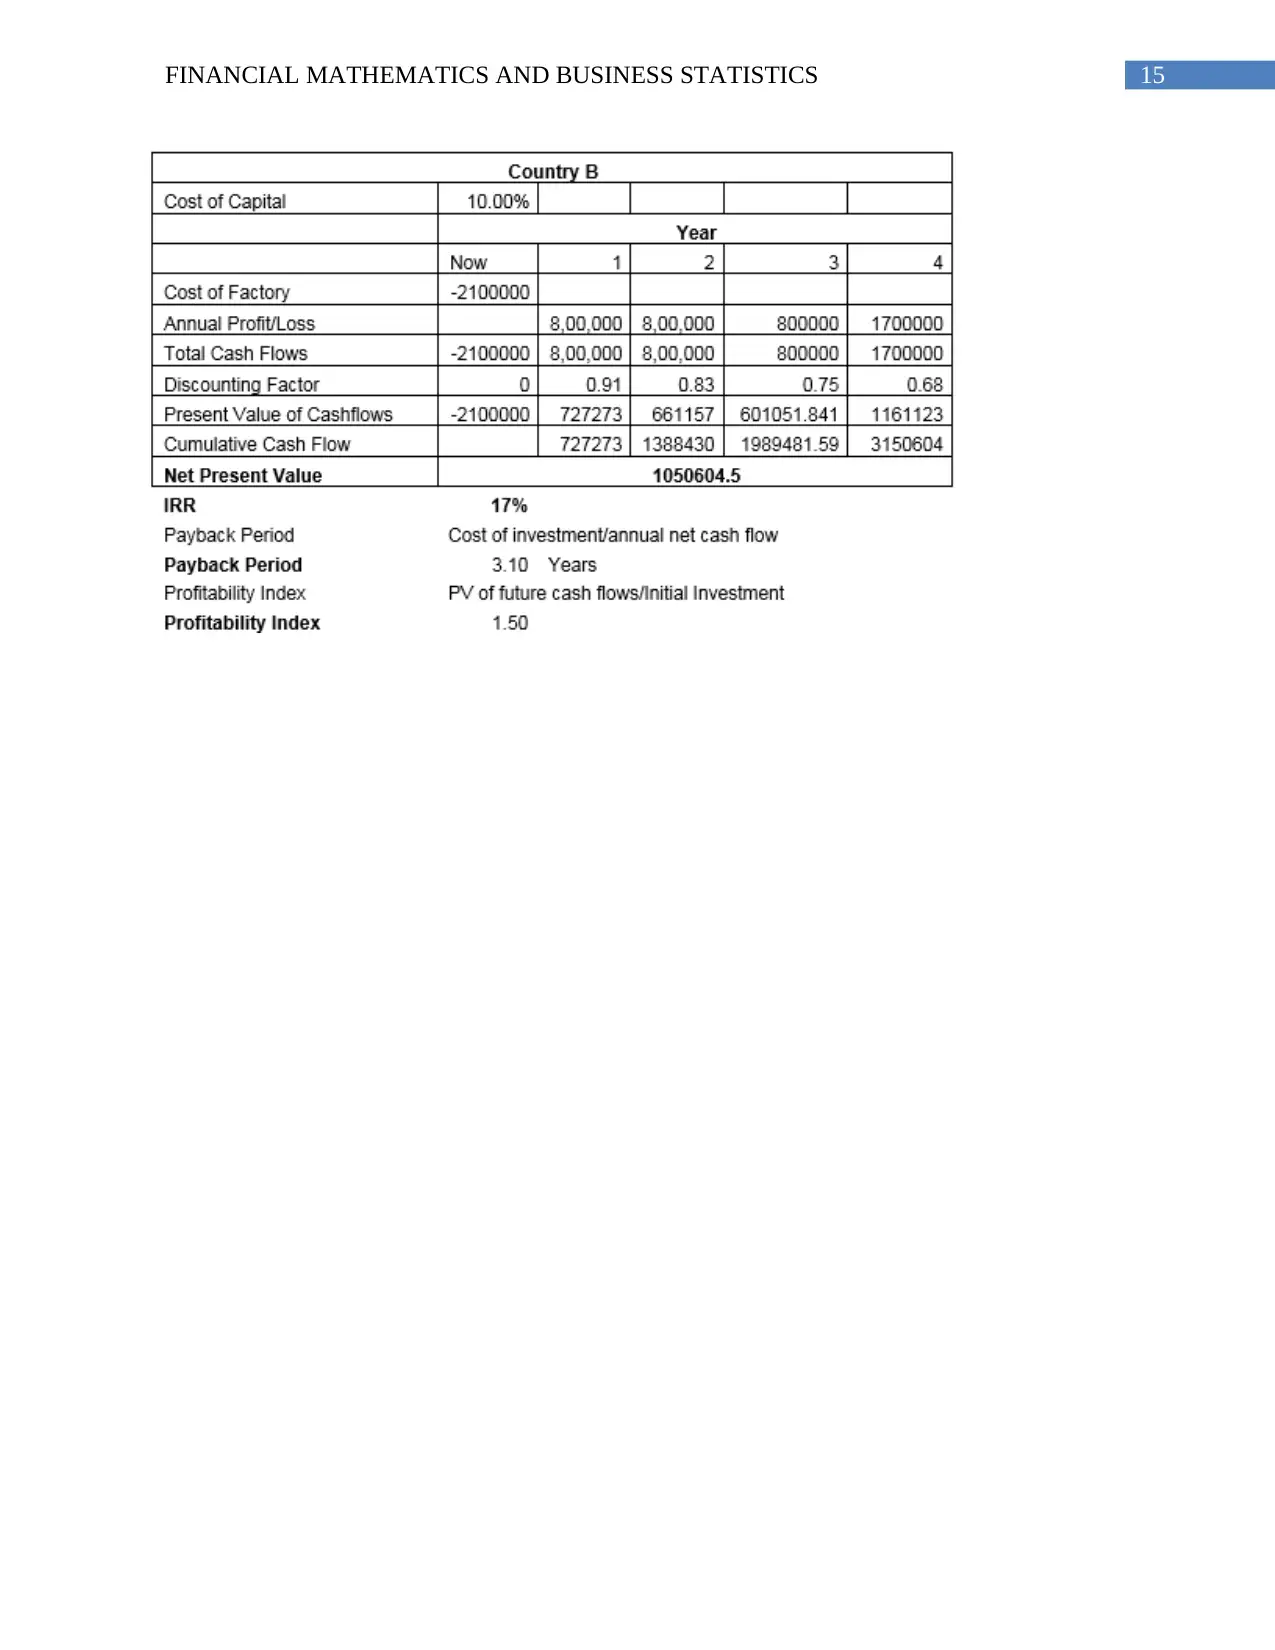
Question 5
In the given scenario the recommendation as per the building the factory is made with
the use of capital budgeting tools. The important aspects of the capital budgeting tools to be used
is seen with use of “NPV, IRR, payback period and profitability index”. If the cost of capital is
11.25% then Allen, plc. Should needs to opt for country A to setup the factory. This decision is
seen with an NPV of £ 1023401 in Country A compared to £ 956313.1 for country B and PI of
1.49 for country A to 1.46 in country B. Even for a low payback period and high IRR for setting
the factory in country B, Allen, plc needs to choose country A. The rationale for this is seen to be
based on a rule that in case there is a situation of conflict then NPV determination is considered
as ideal in nature as it is able to reflect better primary goal which focuses on financial growth.
Even if the cost of capital decreases to 10% or increases to 12.5% the decision will be consistent
in nature (Chittenden and Derregia 2015).
Paraphrase This Document
Need a fresh take? Get an instant paraphrase of this document with our AI Paraphraser
13FINANCIAL MATHEMATICS AND BUSINESS STATISTICS
14FINANCIAL MATHEMATICS AND BUSINESS STATISTICS
15FINANCIAL MATHEMATICS AND BUSINESS STATISTICS
Secure Best Marks with AI Grader
Need help grading? Try our AI Grader for instant feedback on your assignments.
16FINANCIAL MATHEMATICS AND BUSINESS STATISTICS
References
Chittenden, F. and Derregia, M., 2015. Uncertainty, irreversibility and the use of ‘rules of
thumb’in capital budgeting. The British Accounting Review, 47(3), pp.225-236.
Di Maggio, M., Kermani, A., Keys, B.J., Piskorski, T., Ramcharan, R., Seru, A. and Yao, V.,
2017. Interest rate pass-through: Mortgage rates, household consumption, and voluntary
deleveraging. American Economic Review, 107(11), pp.3550-88.
Gallego, G., Ratliff, R. and Shebalov, S., 2014. A general attraction model and sales-based linear
program for network revenue management under customer choice. Operations Research, 63(1),
pp.212-232.
Hand, P. and Voroninski, V., 2016. An elementary proof of convex phase retrieval in the natural
parameter space via the linear program phasemax. arXiv preprint arXiv:1611.03935.
Hinton, P.R., 2014. Statistics explained. Routledge.
Keys, B.J., Piskorski, T., Seru, A. and Yao, V., 2014. Mortgage rates, household balance sheets,
and the real economy (No. w20561). National Bureau of Economic Research.
Kuppuswamy, V. and Bayus, B.L., 2018. Crowdfunding creative ideas: The dynamics of project
backers. In The Economics of Crowdfunding (pp. 151-182). Palgrave Macmillan, Cham.
Meret, S., Hellström, A. and Hagelund, A., 2015. Friend, Foe, or Tolerated Guest? Role and
Position of the Sweden Democrats, the Danish People's Party and the Progress Party in
Mainstream Press Editorials. Part I Descriptive Statistics. In Trust Us! the Sweden Democrats in
Sweden, the Progress Party in Norway and the Danish People´ s Party in Denmark. Berghahn
Books.
Plesinger, F., Klimes, P., Halamek, J. and Jurak, P., 2015, September. False alarms in intensive
care unit monitors: detection of life-threatening arrhythmias using elementary algebra,
descriptive statistics and fuzzy logic. In Computing in Cardiology Conference (CinC), 2015 (pp.
281-284). IEEE.
Pyrczak, F., 2016. Making sense of statistics: A conceptual overview. Routledge.
Taleizadeh, A.A., Stojkovska, I. and Pentico, D.W., 2015. An economic order quantity model
with partial backordering and incremental discount. Computers & Industrial Engineering, 82,
pp.21-32.
Ware, N.R., Singh, S.P. and Banwet, D.K., 2014. A mixed-integer non-linear program to model
dynamic supplier selection problem. Expert Systems with Applications, 41(2), pp.671-678.
1 out of 17


Your All-in-One AI-Powered Toolkit for Academic Success.
+13062052269
info@desklib.com
Available 24*7 on WhatsApp / Email
![[object Object]](/_next/static/media/star-bottom.7253800d.svg)
Unlock your academic potential
© 2024 | Zucol Services PVT LTD | All rights reserved.