logo

Financial Performance Analysis of GlaxoSmithKline, AstraZeneca and Shire PLC

The assignment requires students to complete two time-constrained online tests and a final written assessment, demonstrating wider and deeper learning in the field of Accounting and Finance for Managers.

29 Pages6102 Words177 Views
   

Added on  2023-06-12

About This Document

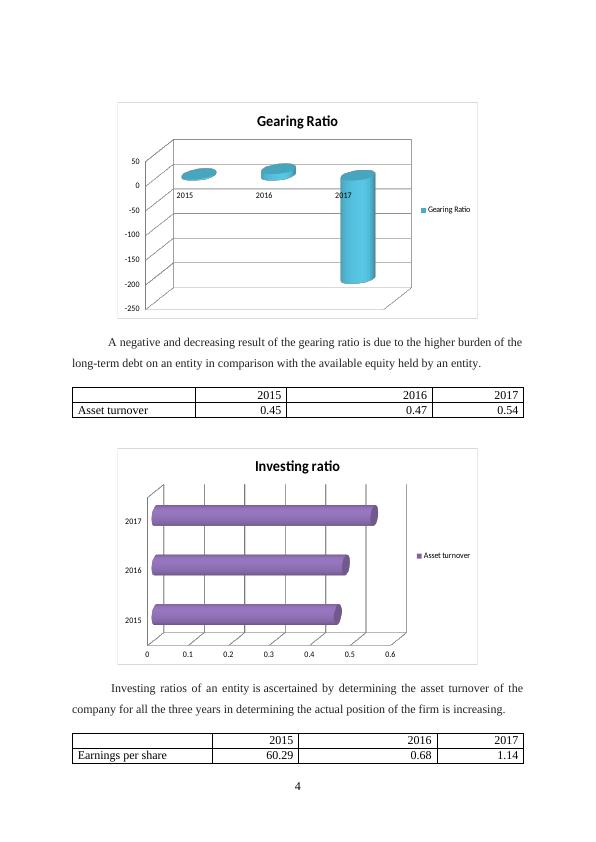
This report analyzes the financial performance of GlaxoSmithKline, AstraZeneca and Shire PLC using 10 financial ratios and 2 non-financial ratios. It identifies the best and worst performing companies and provides recommendations for improvement. The report also explains the key stages in the capital investment decision-making process and the role of investment appraisal in the process.

Financial Performance Analysis of GlaxoSmithKline, AstraZeneca and Shire PLC

The assignment requires students to complete two time-constrained online tests and a final written assessment, demonstrating wider and deeper learning in the field of Accounting and Finance for Managers.

   Added on 2023-06-12

ShareRelated Documents
ACCOUNTING FOR MANAGERS
TABLE OF CONTENT
Financial Performance Analysis of GlaxoSmithKline, AstraZeneca and Shire PLC_1
S
Section A....................................................................................................................................1
Question 1...............................................................................................................................1
a) Select and justify 10 financial ratios and 2 non-financial ratios in analyzing the financial
performance of the three companies.......................................................................................1
b) Identify the best performing company and state the reasons if the company would be
consider as a positive investment opportunity......................................................................17
c) Identify worst performing company and discuss the recommendations of how the
financial performance of the firm can be improved.............................................................18
Section B..................................................................................................................................18
Question 2................................................................................................................................18
a) Identify and explain the key stages in the capital investment decision-making process
and the role of investment appraisal in the process..............................................................18
b) Identify and explain the main methods of investment appraisal used in practice with the
help of numerical examples..................................................................................................21
REFERENCES.........................................................................................................................26
Financial Performance Analysis of GlaxoSmithKline, AstraZeneca and Shire PLC_2
SECTION A
Question 1
a) Select and justify 10 financial ratios and 2 non-financial ratios in analyzing the financial
performance of the three companies.
GlaxoSmithKline Plc
Particulars Formula 2015 2016 2017
Profitability
Sales
2392
3
2788
9 30186
GP
1507
0
1859
9 19844
Gross Profit Ratio GP/Sales*100 63% 67% 66%
Operating profit 2628 6026 6061
Operating profit
ratio Operating Profit/Sales*100 11% 22% 20%
Net profit 8422 912 1532
Net profit Ratio Net profit/sales*100 35% 3% 5%
Total assets
5344
6
5908
1 56381
Return on assets 0.158 0.015 0.027
Stockholder’s equity 5114 1124 -68
Return on Equity Net profit/Stockholder's equity 0.16 0.02 0.03
Liquidity ratios
Current assets
1658
7
1671
1 15907
Current liabilities
1341
7
1900
1 26569
Current ratio Current assets/current liability 1.24 0.88 0.60
Inventory 4716 5102 5557
Quick ratio
(current assets-inventory)/current
liabilities 0.88 0.61 0.39
Gearing ratios
Long term debt
1527
7
1462
0 14221
Equity capital 5114 1124 -68
Gearing ratio Long term debt/equity capital 2.99 13.01
-
209.13
Investing Ratios
Sales
2392
3
2788
9 30186
Total assets
5344
6
5908
1 56381
Asset turnover ratio Sales/total assets 0.45 0.47 0.54
Share performance ratios
Net income 8422 912 1532
No. of outstanding shares 1340 1342 1343
1
Financial Performance Analysis of GlaxoSmithKline, AstraZeneca and Shire PLC_3
Earnings per share Net income/no. of outstanding shares 6.29 0.68 1.14
Source: GSK, 2017
2015 2016 2017
GP 63% 67% 66%
Operating Profit 11% 22% 20%
NP 35% 3% 5%
2015 2016 2017
0%
10%
20%
30%
40%
50%
60%
70%
GLAXOSMITHSKLINE
GP
Operating Profit
NP
Higher gross profit is due to lower cost of goods sold and higher sales earned by the
firm in all the three years due to good marketing of the company’s products. Operating
expenses of this enterprise are higher which decreases the operating profit and so as for the
net profit.
2015 2016 2017
Return on assets 0.158 0.015 0.027
Return on equity 0.16 0.02 0.03
2
Financial Performance Analysis of GlaxoSmithKline, AstraZeneca and Shire PLC_4
2015
2016
2017
0 0.02 0.04 0.06 0.08 0.1 0.12 0.14 0.16
Return on equity
Return on assets
In 2015, return on equity is higher than the return on assets which further decreased
till 2017 due to decreasing earnings of an entity.
2015 2016 2017
Current ratio 1.24 0.88 0.6
Quick Ratio 0.88 0.61 0.39
2015 2016 2017
0
0.2
0.4
0.6
0.8
1
1.2
1.4
Current ratio
Quick Ratio
The position of both the ratios are not good as this ratio shows neck to neck position
but its performance is declining at the same time due to higher current liabilities (Ratio
analysis, 2017).
2015 2016 2017
Gearing Ratio 2.99 13.01 -209.31
3
Financial Performance Analysis of GlaxoSmithKline, AstraZeneca and Shire PLC_5
2015 2016 2017
-250
-200
-150
-100
-50
0
50
Gearing Ratio
Gearing Ratio
A negative and decreasing result of the gearing ratio is due to the higher burden of the
long-term debt on an entity in comparison with the available equity held by an entity.
2015 2016 2017
Asset turnover 0.45 0.47 0.54
2015
2016
2017
0 0.1 0.2 0.3 0.4 0.5 0.6
Investing ratio
Asset turnover
Investing ratios of an entity is ascertained by determining the asset turnover of the
company for all the three years in determining the actual position of the firm is increasing.
2015 2016 2017
Earnings per share 60.29 0.68 1.14
4
Financial Performance Analysis of GlaxoSmithKline, AstraZeneca and Shire PLC_6

End of preview

Want to access all the pages? Upload your documents or become a member.

Related Documents
Accounting Finance Analysis 2022
|16
|3172
|17

Financial Analysis of Caltex Australia Limited
|13
|3278
|78