Financial Management Project: NADEC and Almarai Performance Analysis
VerifiedAdded on 2023/05/30
|10
|1917
|411
Project
AI Summary
This project analyzes the financial performance of NADEC (National Agricultural Development Company) and Almarai, both in the dairy industry, using financial statements from 2016 and 2017. The analysis includes common-size and common-base income statements and balance sheets, highlighting changes in profitability, liquidity, solvency, and efficiency ratios. Ratio analysis reveals that Almarai outperformed NADEC in 2017. The project also examines the capital structures of both companies, noting NADEC's higher debt proportion and its impact on profitability and liquidity. The conclusion emphasizes Almarai's superior financial standing based on the analysis.
FINANCIAL MANAGEMENT
STUDENT ID:
[Pick the date]
STUDENT ID:
[Pick the date]
Secure Best Marks with AI Grader
Need help grading? Try our AI Grader for instant feedback on your assignments.
Introduction
The objective is to analyse the financial performance of two companies based in the same
sector using ratio analysis along with analysis of financial statements for 2016 and 2017. The
two companies that have been selected for this task are NADEC (National Agricultural
Development Company) and Almarai. Both these companies belong to the dairy industry
even though Almarai in the recent years has diversified into a food and beverage company
with a significant chunk of the business from dairy segment. For comparing the financial
performance of these two companies, ratio analysis along with financial statement analysis
has been done. Additionally, capital structures of the two companies are compared and
impact of this on the profitability and liquidity has been highlighted.
Financial Statement Analysis
In order to analyse the financial performance of the two companies in 2017 as compared to
2016, common size and common base income statement and balance sheet has been prepared
for both the companies. These are analysed below.
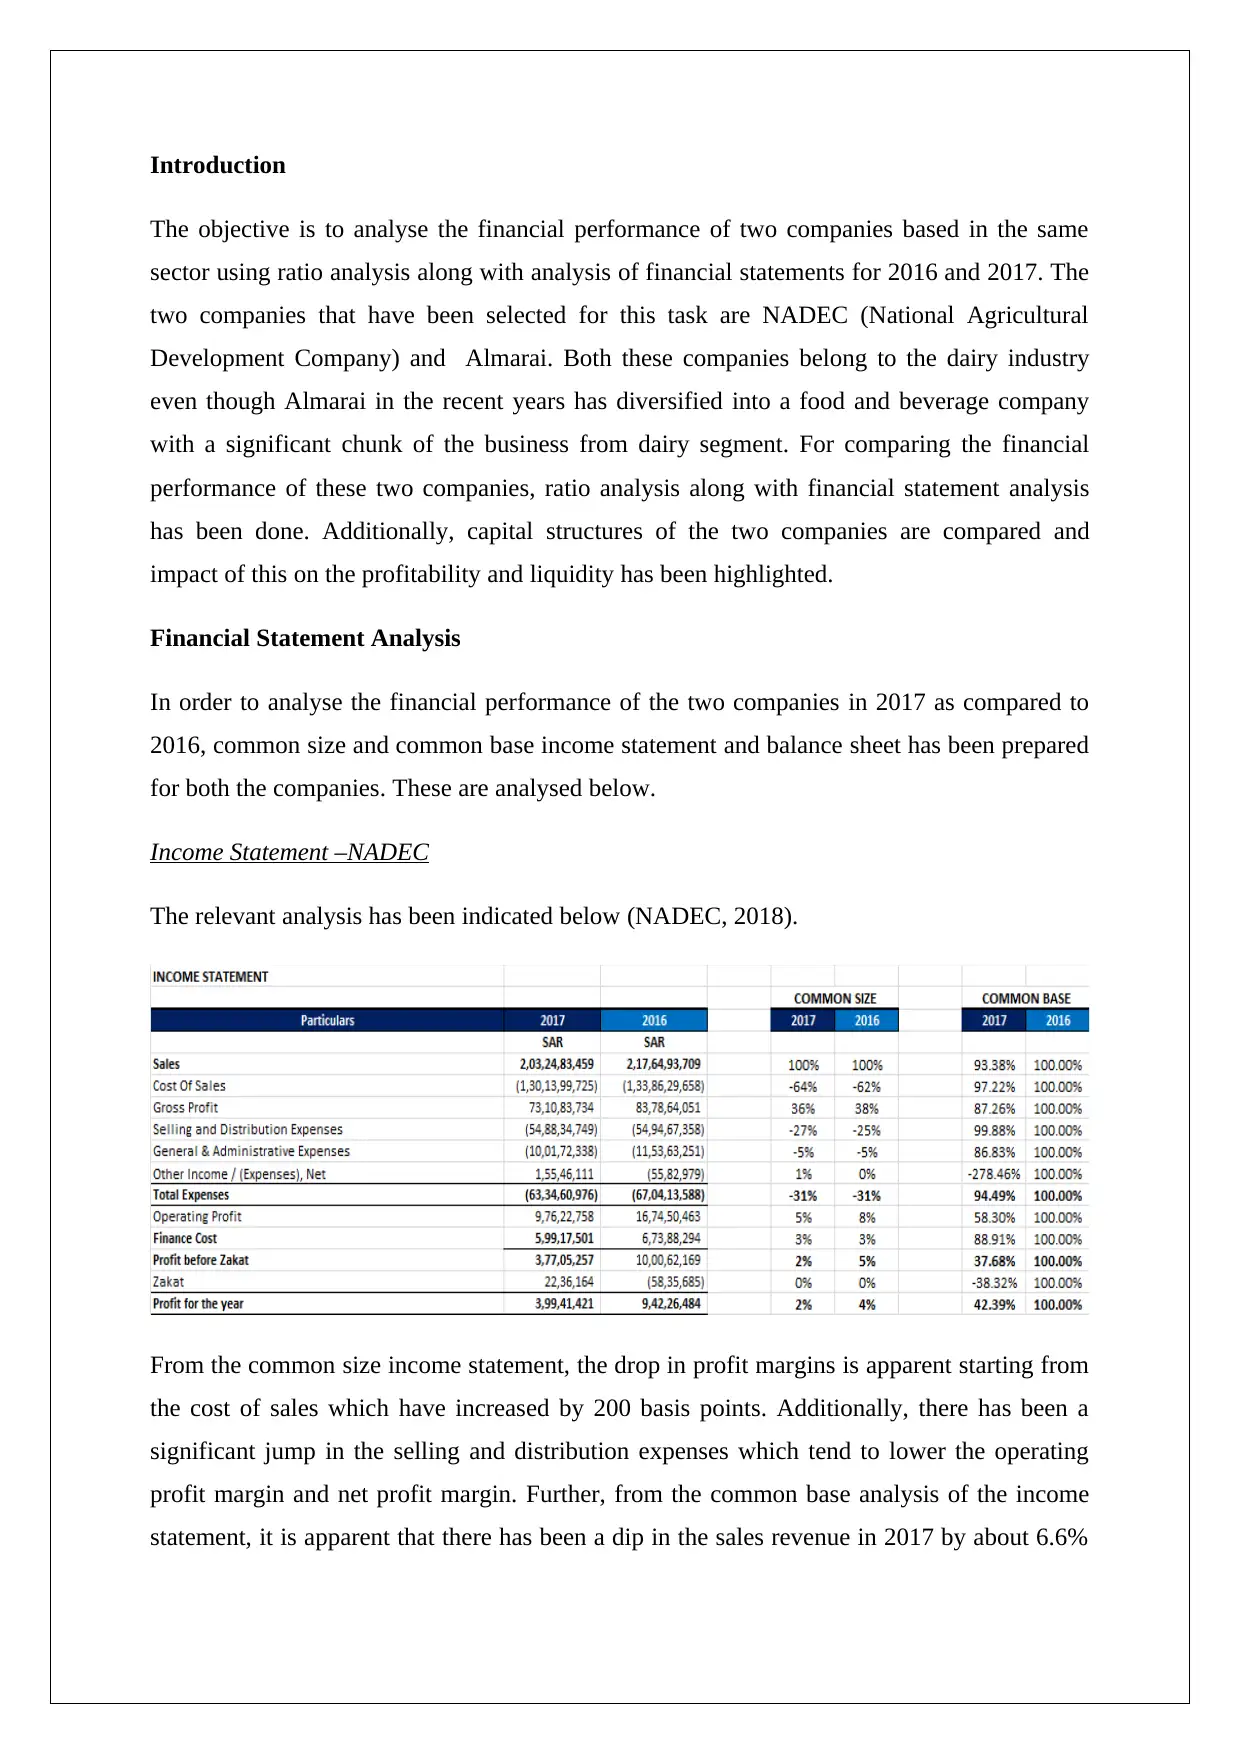
Income Statement –NADEC
The relevant analysis has been indicated below (NADEC, 2018).
From the common size income statement, the drop in profit margins is apparent starting from
the cost of sales which have increased by 200 basis points. Additionally, there has been a
significant jump in the selling and distribution expenses which tend to lower the operating
profit margin and net profit margin. Further, from the common base analysis of the income
statement, it is apparent that there has been a dip in the sales revenue in 2017 by about 6.6%
The objective is to analyse the financial performance of two companies based in the same
sector using ratio analysis along with analysis of financial statements for 2016 and 2017. The
two companies that have been selected for this task are NADEC (National Agricultural
Development Company) and Almarai. Both these companies belong to the dairy industry
even though Almarai in the recent years has diversified into a food and beverage company
with a significant chunk of the business from dairy segment. For comparing the financial
performance of these two companies, ratio analysis along with financial statement analysis
has been done. Additionally, capital structures of the two companies are compared and
impact of this on the profitability and liquidity has been highlighted.
Financial Statement Analysis
In order to analyse the financial performance of the two companies in 2017 as compared to
2016, common size and common base income statement and balance sheet has been prepared
for both the companies. These are analysed below.
Income Statement –NADEC
The relevant analysis has been indicated below (NADEC, 2018).
From the common size income statement, the drop in profit margins is apparent starting from
the cost of sales which have increased by 200 basis points. Additionally, there has been a
significant jump in the selling and distribution expenses which tend to lower the operating
profit margin and net profit margin. Further, from the common base analysis of the income
statement, it is apparent that there has been a dip in the sales revenue in 2017 by about 6.6%
which along with diminishing profit margins has led to the decline in the bet profits by about
57.6% on a y-o-y basis.
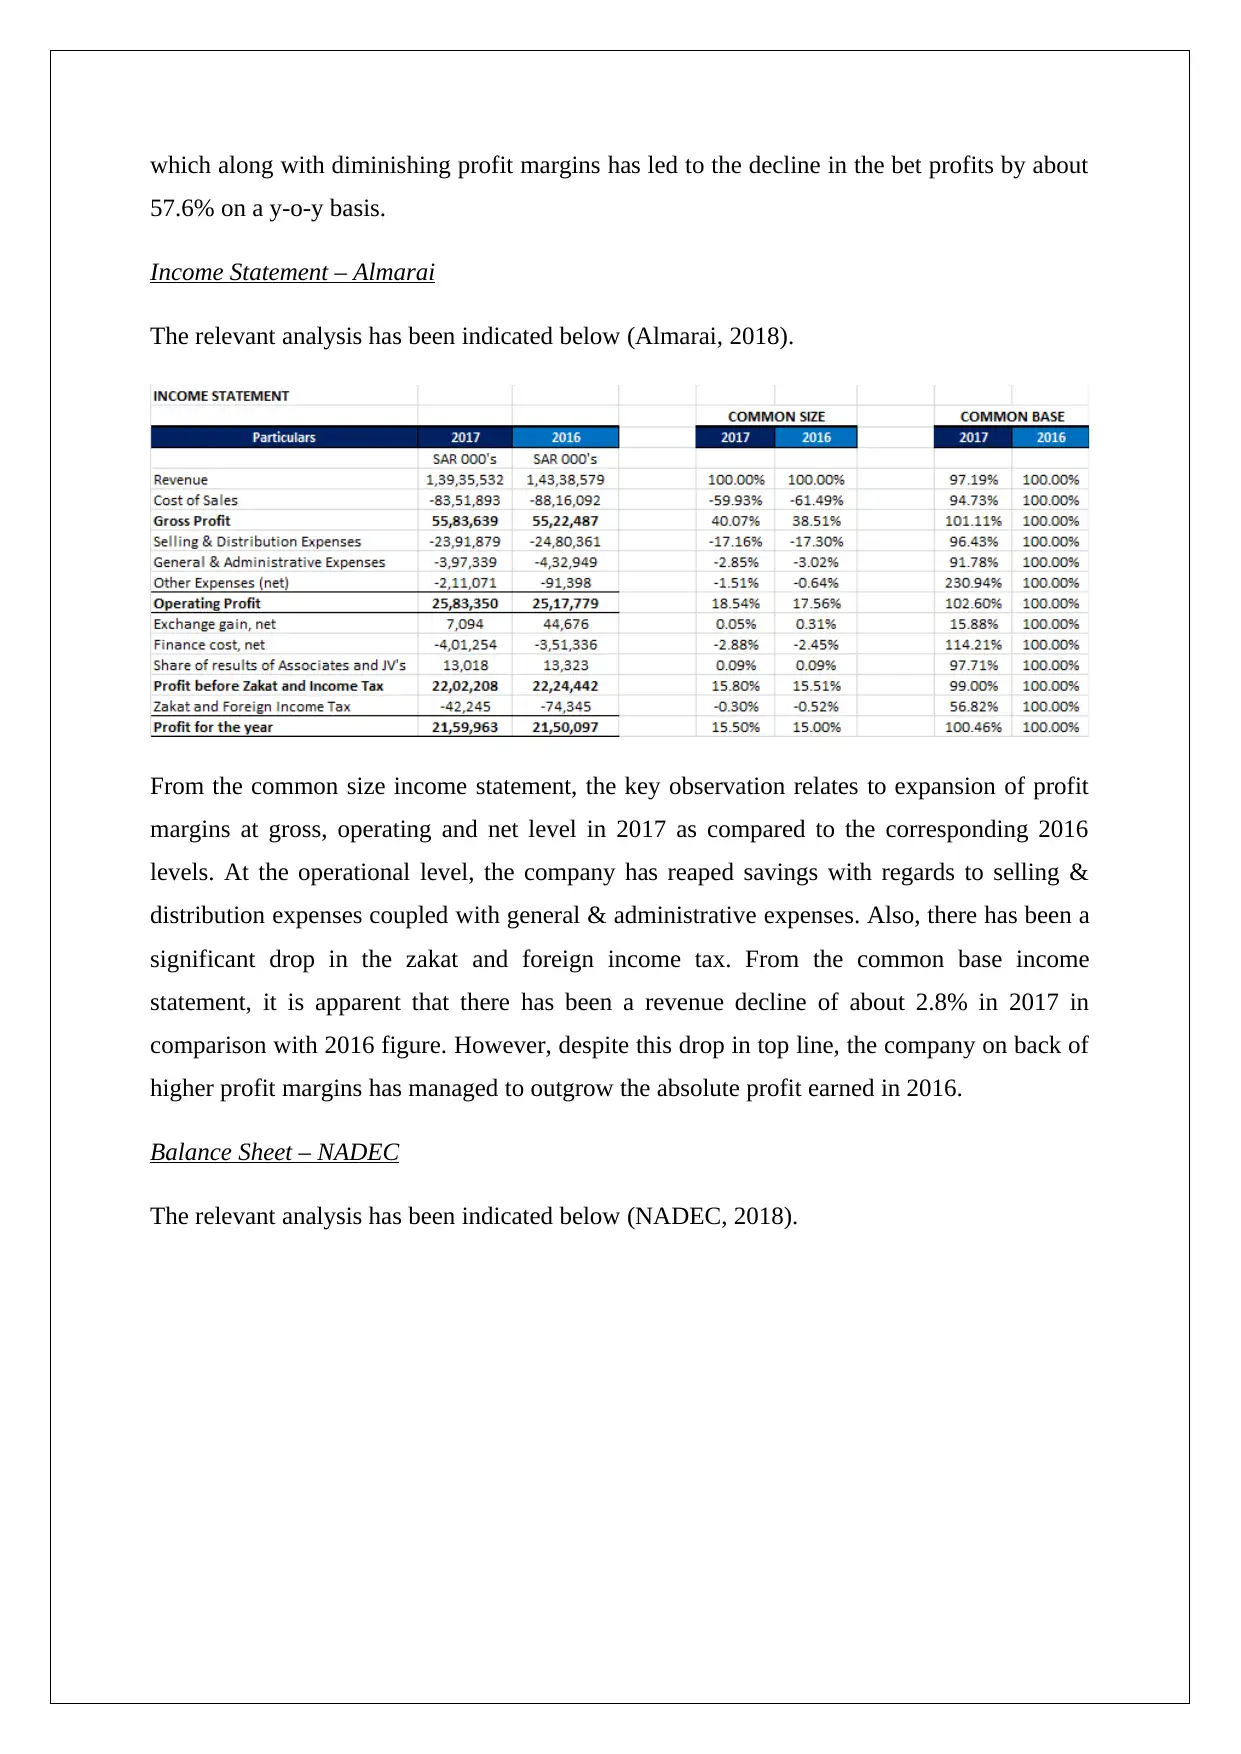
Income Statement – Almarai
The relevant analysis has been indicated below (Almarai, 2018).
From the common size income statement, the key observation relates to expansion of profit
margins at gross, operating and net level in 2017 as compared to the corresponding 2016
levels. At the operational level, the company has reaped savings with regards to selling &
distribution expenses coupled with general & administrative expenses. Also, there has been a
significant drop in the zakat and foreign income tax. From the common base income
statement, it is apparent that there has been a revenue decline of about 2.8% in 2017 in
comparison with 2016 figure. However, despite this drop in top line, the company on back of
higher profit margins has managed to outgrow the absolute profit earned in 2016.
Balance Sheet – NADEC
The relevant analysis has been indicated below (NADEC, 2018).
57.6% on a y-o-y basis.
Income Statement – Almarai
The relevant analysis has been indicated below (Almarai, 2018).
From the common size income statement, the key observation relates to expansion of profit
margins at gross, operating and net level in 2017 as compared to the corresponding 2016
levels. At the operational level, the company has reaped savings with regards to selling &
distribution expenses coupled with general & administrative expenses. Also, there has been a
significant drop in the zakat and foreign income tax. From the common base income
statement, it is apparent that there has been a revenue decline of about 2.8% in 2017 in
comparison with 2016 figure. However, despite this drop in top line, the company on back of
higher profit margins has managed to outgrow the absolute profit earned in 2016.
Balance Sheet – NADEC
The relevant analysis has been indicated below (NADEC, 2018).
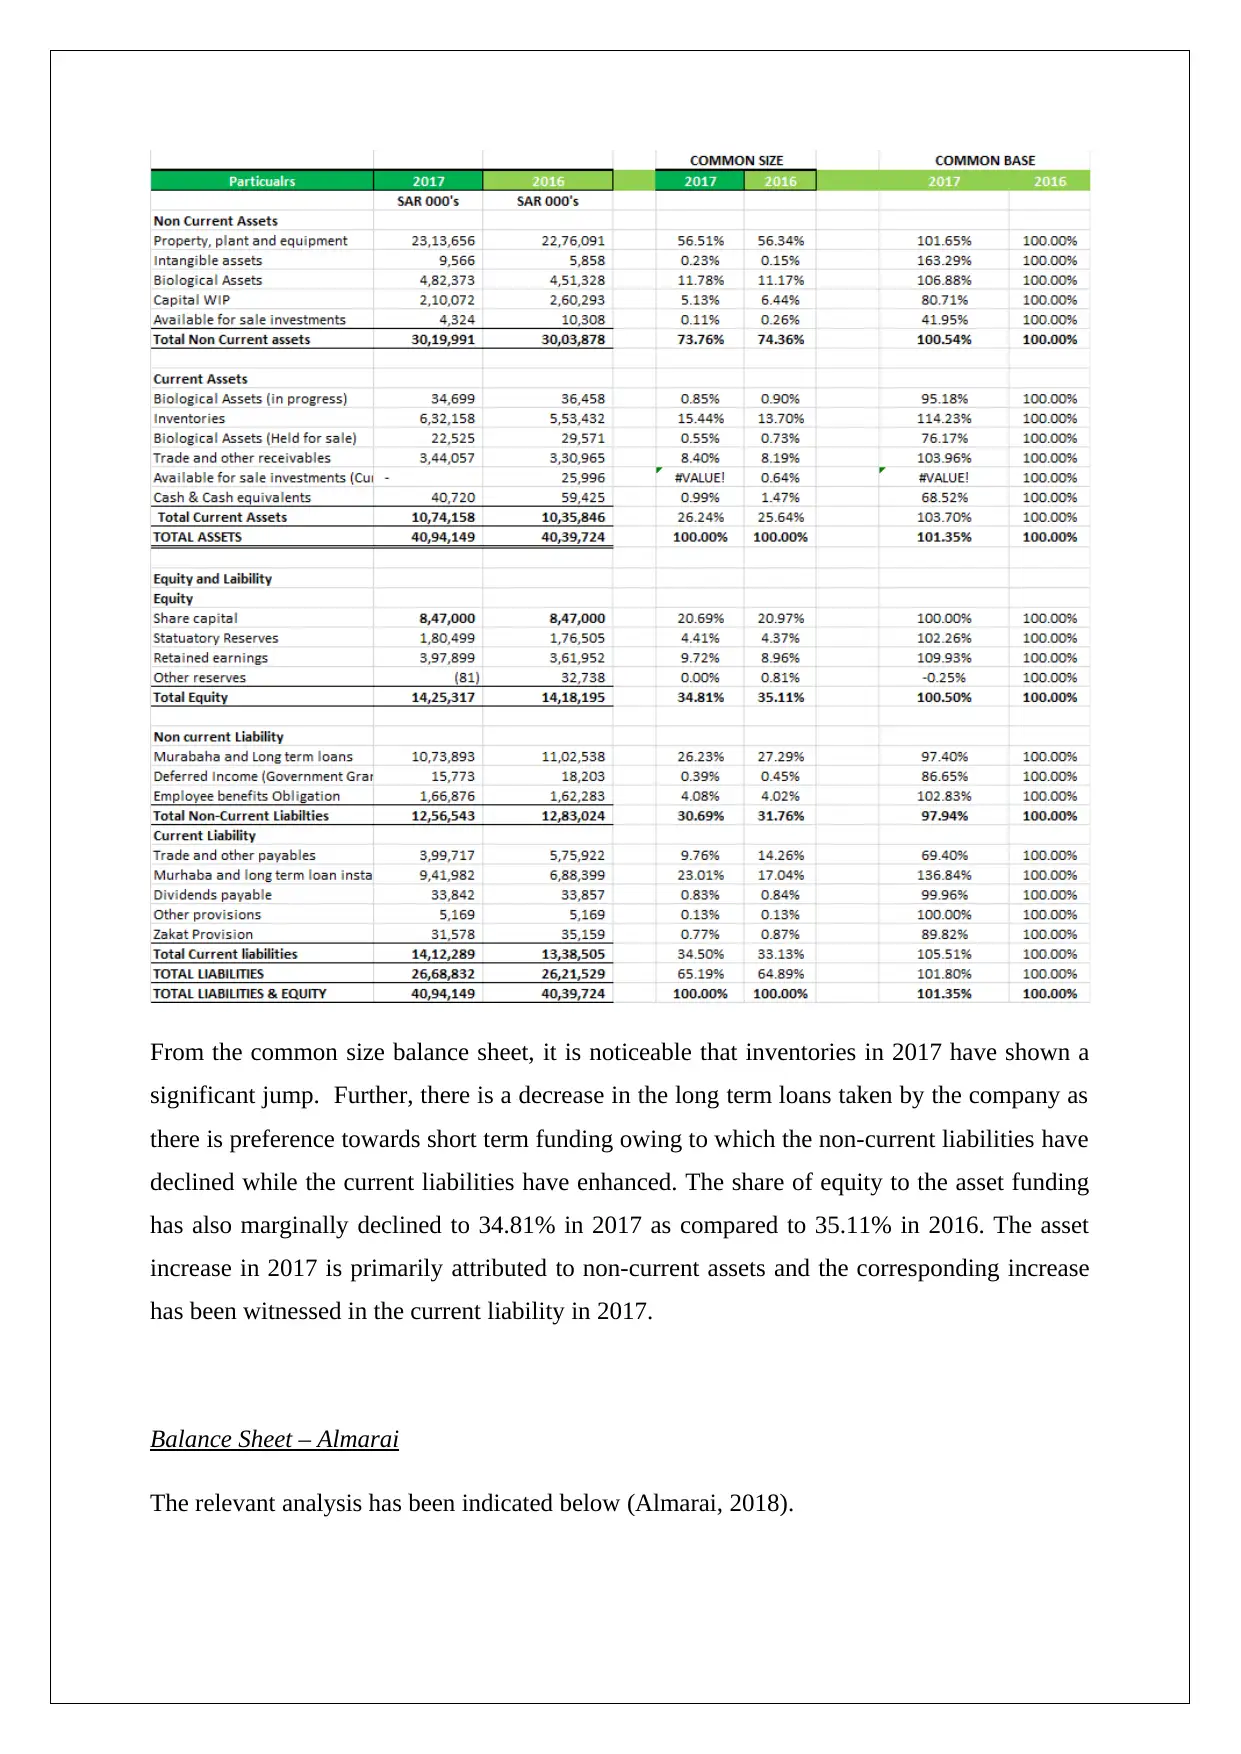
From the common size balance sheet, it is noticeable that inventories in 2017 have shown a
significant jump. Further, there is a decrease in the long term loans taken by the company as
there is preference towards short term funding owing to which the non-current liabilities have
declined while the current liabilities have enhanced. The share of equity to the asset funding
has also marginally declined to 34.81% in 2017 as compared to 35.11% in 2016. The asset
increase in 2017 is primarily attributed to non-current assets and the corresponding increase
has been witnessed in the current liability in 2017.
Balance Sheet – Almarai
The relevant analysis has been indicated below (Almarai, 2018).
Secure Best Marks with AI Grader
Need help grading? Try our AI Grader for instant feedback on your assignments.
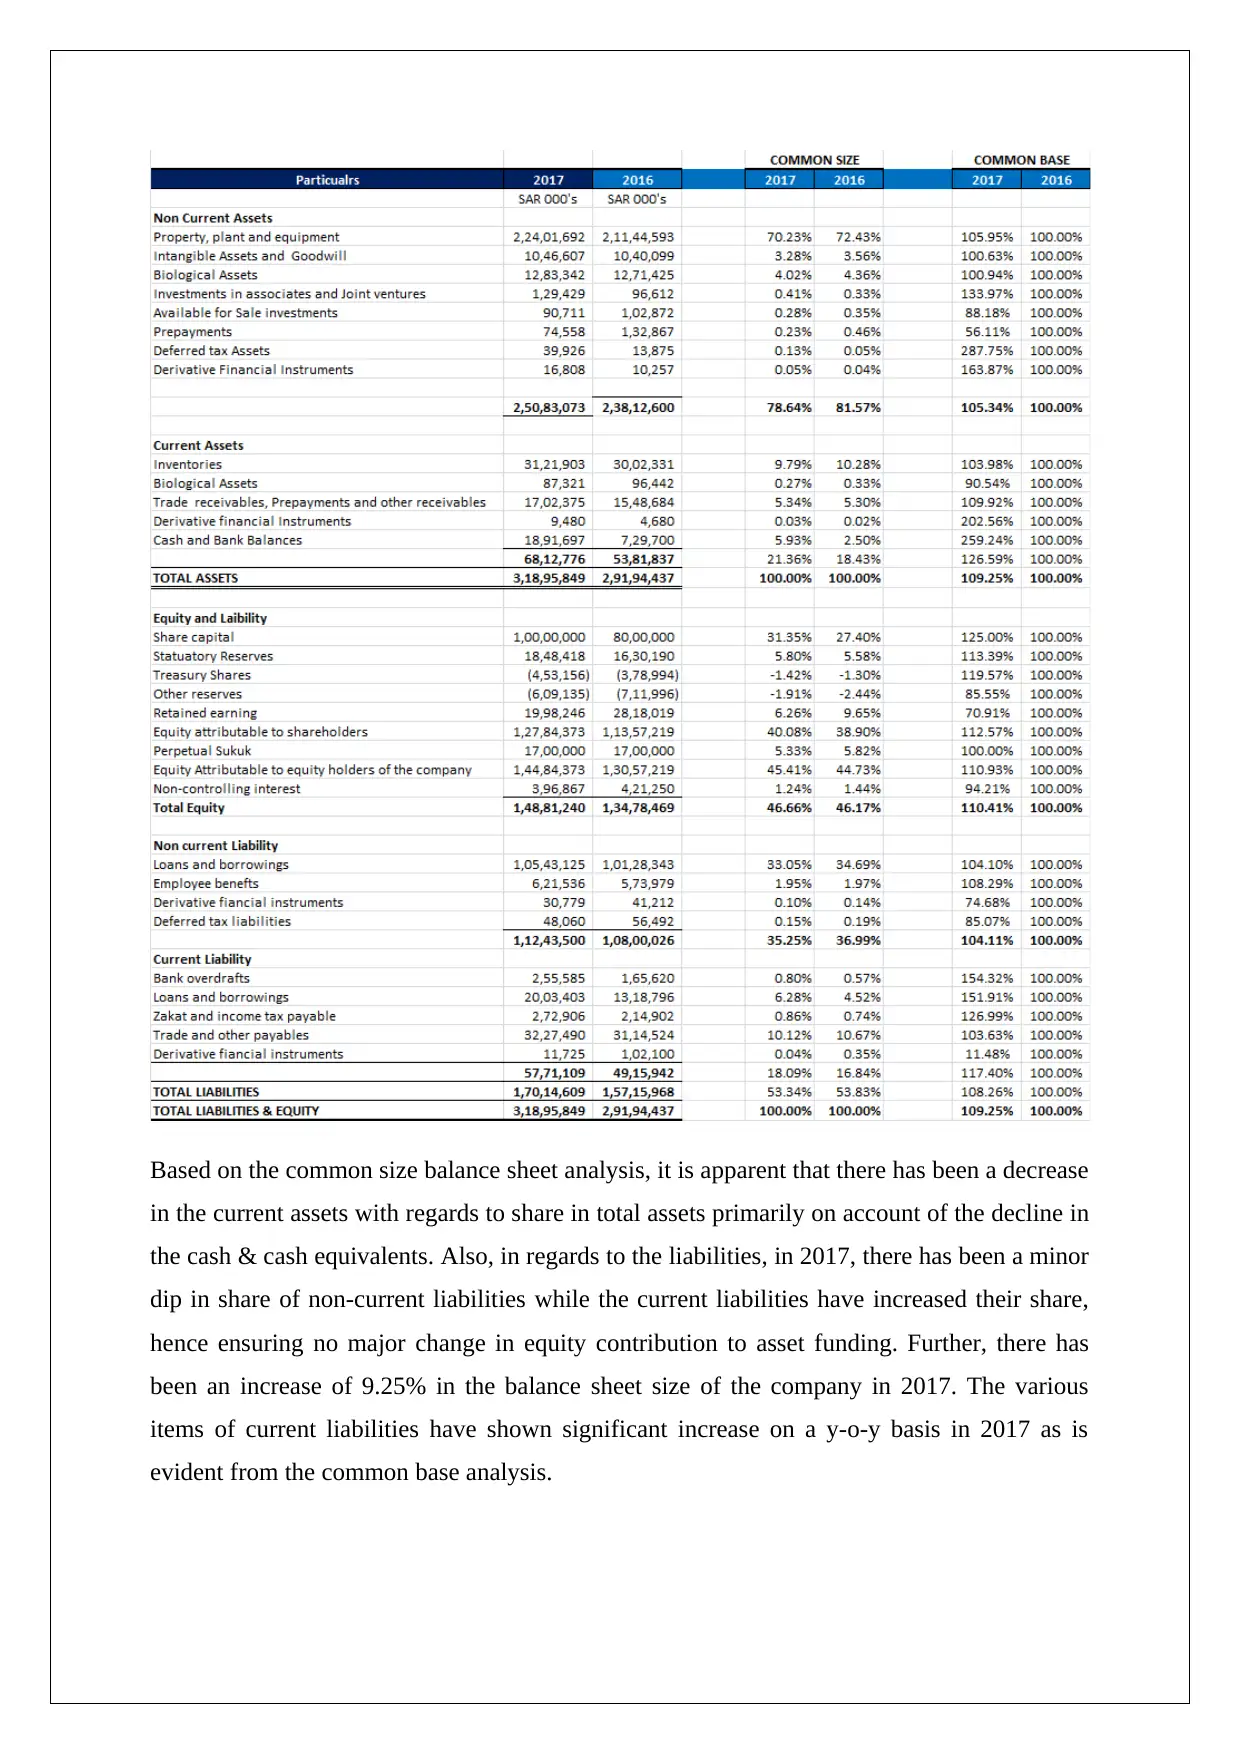
Based on the common size balance sheet analysis, it is apparent that there has been a decrease
in the current assets with regards to share in total assets primarily on account of the decline in
the cash & cash equivalents. Also, in regards to the liabilities, in 2017, there has been a minor
dip in share of non-current liabilities while the current liabilities have increased their share,
hence ensuring no major change in equity contribution to asset funding. Further, there has
been an increase of 9.25% in the balance sheet size of the company in 2017. The various
items of current liabilities have shown significant increase on a y-o-y basis in 2017 as is
evident from the common base analysis.
Ratio Analysis
The financial performance of the two companies has been analysed using ratio analysis as
indicated below.
Profitability Ratios
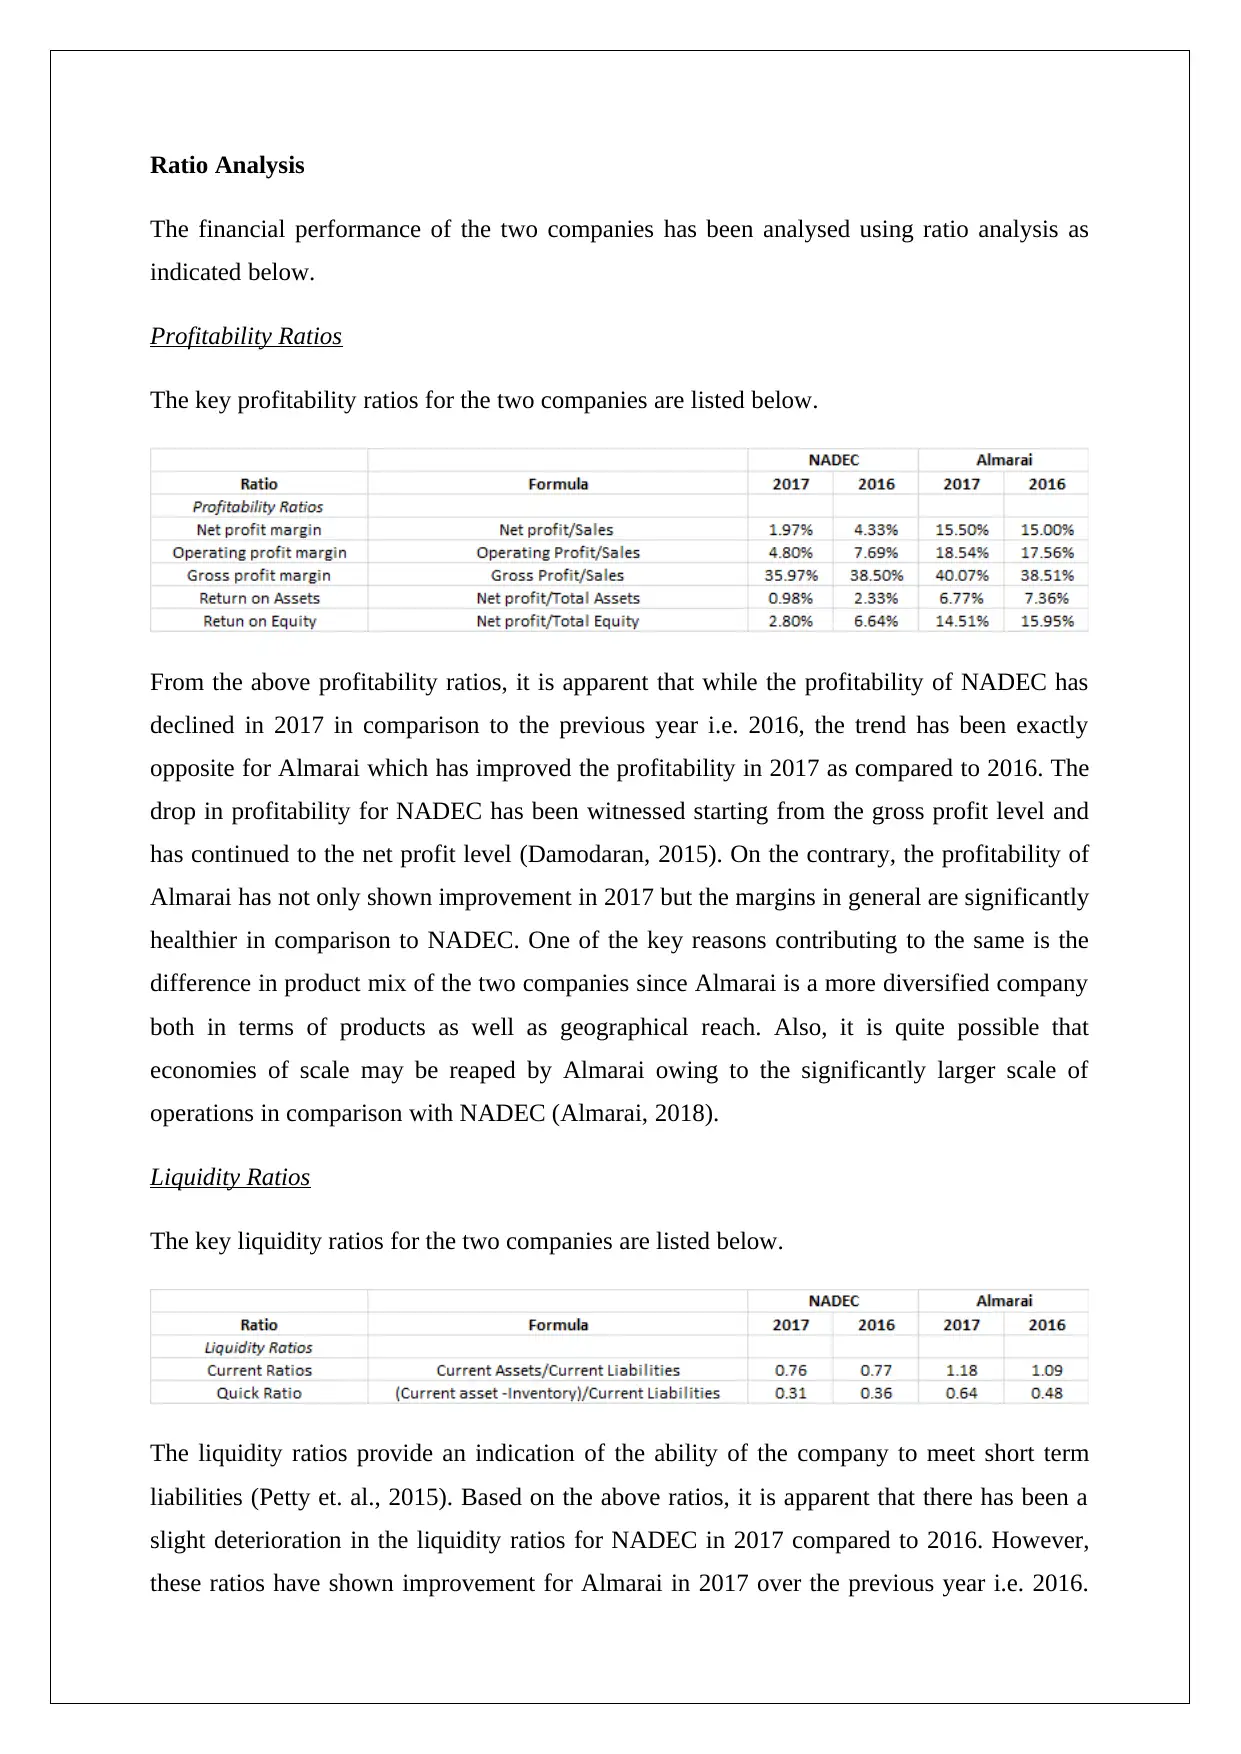
The key profitability ratios for the two companies are listed below.
From the above profitability ratios, it is apparent that while the profitability of NADEC has
declined in 2017 in comparison to the previous year i.e. 2016, the trend has been exactly
opposite for Almarai which has improved the profitability in 2017 as compared to 2016. The
drop in profitability for NADEC has been witnessed starting from the gross profit level and
has continued to the net profit level (Damodaran, 2015). On the contrary, the profitability of
Almarai has not only shown improvement in 2017 but the margins in general are significantly
healthier in comparison to NADEC. One of the key reasons contributing to the same is the
difference in product mix of the two companies since Almarai is a more diversified company
both in terms of products as well as geographical reach. Also, it is quite possible that
economies of scale may be reaped by Almarai owing to the significantly larger scale of
operations in comparison with NADEC (Almarai, 2018).
Liquidity Ratios
The key liquidity ratios for the two companies are listed below.
The liquidity ratios provide an indication of the ability of the company to meet short term
liabilities (Petty et. al., 2015). Based on the above ratios, it is apparent that there has been a
slight deterioration in the liquidity ratios for NADEC in 2017 compared to 2016. However,
these ratios have shown improvement for Almarai in 2017 over the previous year i.e. 2016.
The financial performance of the two companies has been analysed using ratio analysis as
indicated below.
Profitability Ratios
The key profitability ratios for the two companies are listed below.
From the above profitability ratios, it is apparent that while the profitability of NADEC has
declined in 2017 in comparison to the previous year i.e. 2016, the trend has been exactly
opposite for Almarai which has improved the profitability in 2017 as compared to 2016. The
drop in profitability for NADEC has been witnessed starting from the gross profit level and
has continued to the net profit level (Damodaran, 2015). On the contrary, the profitability of
Almarai has not only shown improvement in 2017 but the margins in general are significantly
healthier in comparison to NADEC. One of the key reasons contributing to the same is the
difference in product mix of the two companies since Almarai is a more diversified company
both in terms of products as well as geographical reach. Also, it is quite possible that
economies of scale may be reaped by Almarai owing to the significantly larger scale of
operations in comparison with NADEC (Almarai, 2018).
Liquidity Ratios
The key liquidity ratios for the two companies are listed below.
The liquidity ratios provide an indication of the ability of the company to meet short term
liabilities (Petty et. al., 2015). Based on the above ratios, it is apparent that there has been a
slight deterioration in the liquidity ratios for NADEC in 2017 compared to 2016. However,
these ratios have shown improvement for Almarai in 2017 over the previous year i.e. 2016.
Otherwise also the liquidity ratios of Almarai are significantly superior to that of NADEC.
Even though the inferior ratios of NADEC do raise some concern but considering the backing
of Saudi government, liquidity crisis are highly unlikely going forward.
Solvency Ratios
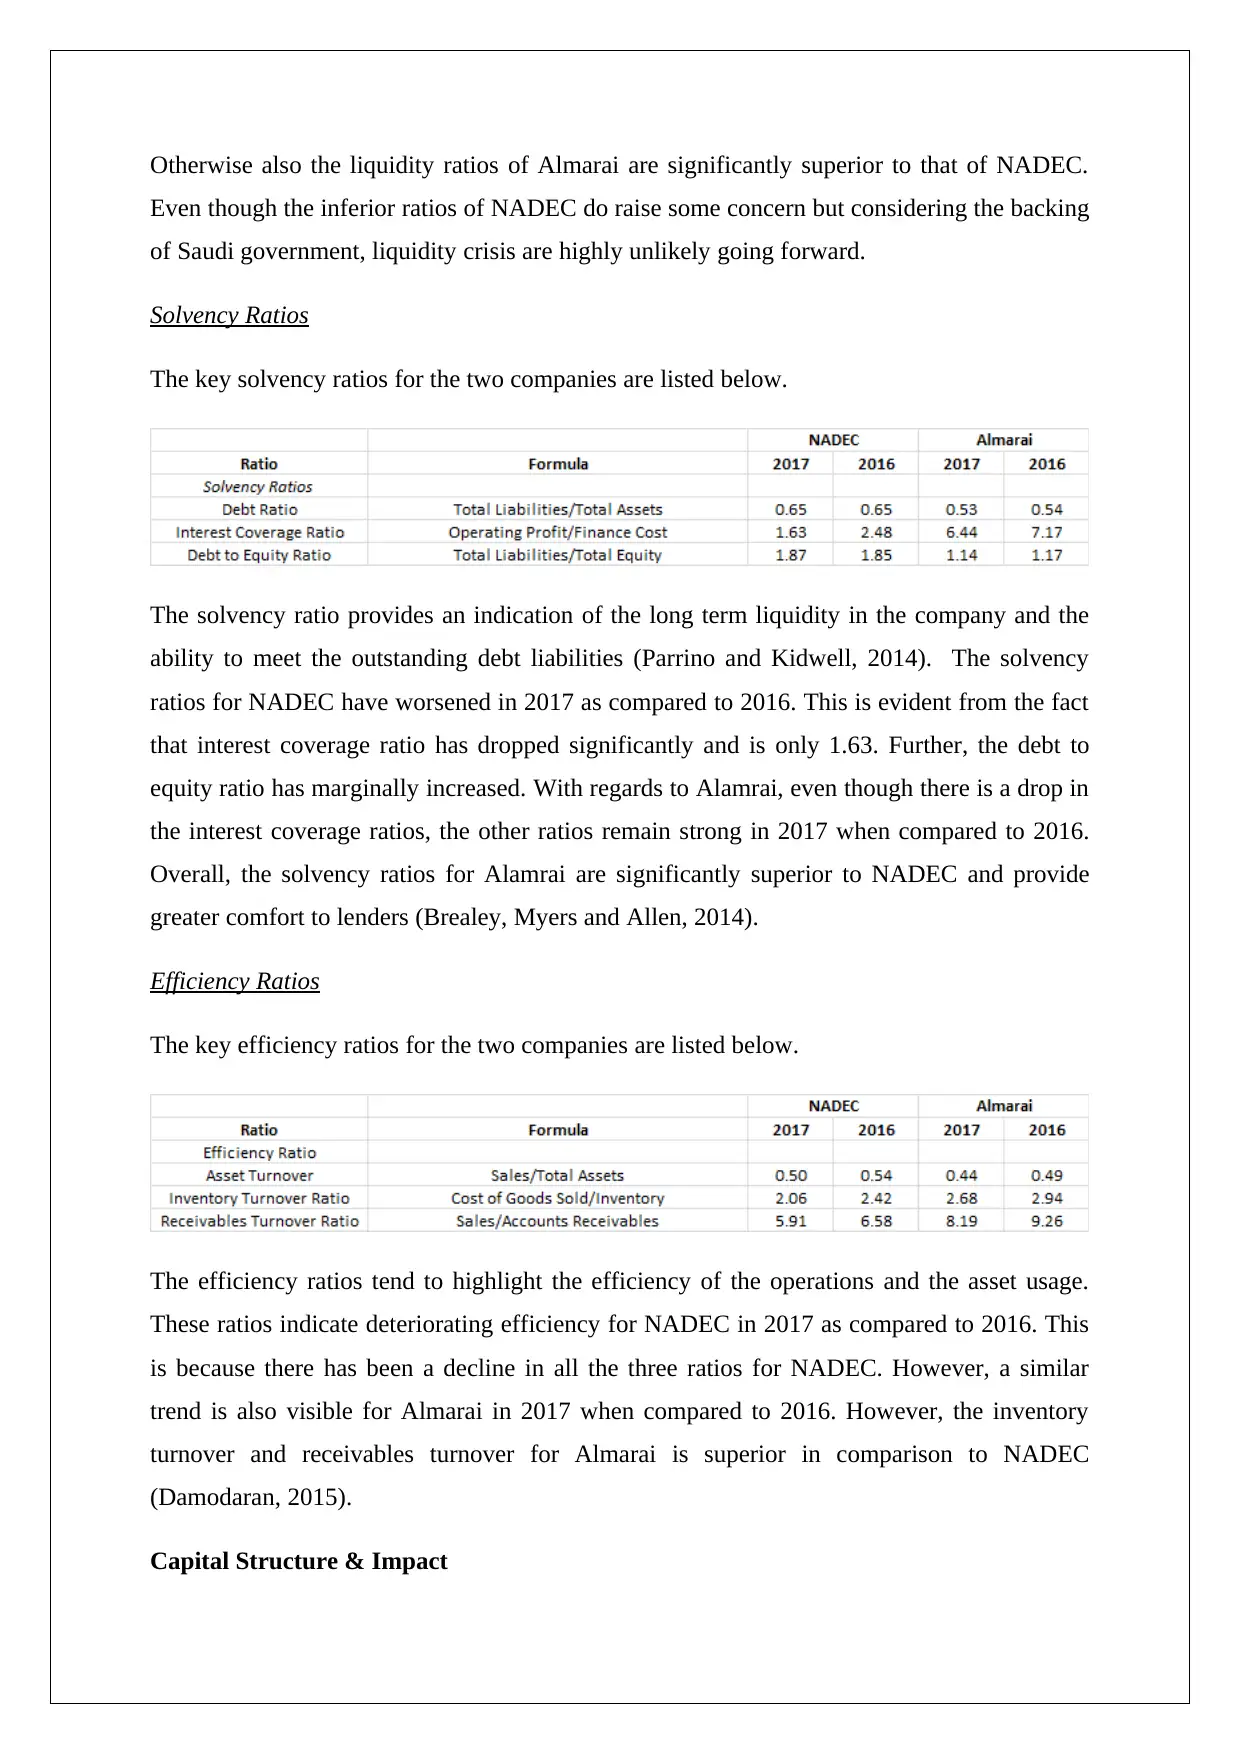
The key solvency ratios for the two companies are listed below.
The solvency ratio provides an indication of the long term liquidity in the company and the
ability to meet the outstanding debt liabilities (Parrino and Kidwell, 2014). The solvency
ratios for NADEC have worsened in 2017 as compared to 2016. This is evident from the fact
that interest coverage ratio has dropped significantly and is only 1.63. Further, the debt to
equity ratio has marginally increased. With regards to Alamrai, even though there is a drop in
the interest coverage ratios, the other ratios remain strong in 2017 when compared to 2016.
Overall, the solvency ratios for Alamrai are significantly superior to NADEC and provide
greater comfort to lenders (Brealey, Myers and Allen, 2014).
Efficiency Ratios
The key efficiency ratios for the two companies are listed below.
The efficiency ratios tend to highlight the efficiency of the operations and the asset usage.
These ratios indicate deteriorating efficiency for NADEC in 2017 as compared to 2016. This
is because there has been a decline in all the three ratios for NADEC. However, a similar
trend is also visible for Almarai in 2017 when compared to 2016. However, the inventory
turnover and receivables turnover for Almarai is superior in comparison to NADEC
(Damodaran, 2015).
Capital Structure & Impact
Even though the inferior ratios of NADEC do raise some concern but considering the backing
of Saudi government, liquidity crisis are highly unlikely going forward.
Solvency Ratios
The key solvency ratios for the two companies are listed below.
The solvency ratio provides an indication of the long term liquidity in the company and the
ability to meet the outstanding debt liabilities (Parrino and Kidwell, 2014). The solvency
ratios for NADEC have worsened in 2017 as compared to 2016. This is evident from the fact
that interest coverage ratio has dropped significantly and is only 1.63. Further, the debt to
equity ratio has marginally increased. With regards to Alamrai, even though there is a drop in
the interest coverage ratios, the other ratios remain strong in 2017 when compared to 2016.
Overall, the solvency ratios for Alamrai are significantly superior to NADEC and provide
greater comfort to lenders (Brealey, Myers and Allen, 2014).
Efficiency Ratios
The key efficiency ratios for the two companies are listed below.
The efficiency ratios tend to highlight the efficiency of the operations and the asset usage.
These ratios indicate deteriorating efficiency for NADEC in 2017 as compared to 2016. This
is because there has been a decline in all the three ratios for NADEC. However, a similar
trend is also visible for Almarai in 2017 when compared to 2016. However, the inventory
turnover and receivables turnover for Almarai is superior in comparison to NADEC
(Damodaran, 2015).
Capital Structure & Impact
Paraphrase This Document
Need a fresh take? Get an instant paraphrase of this document with our AI Paraphraser
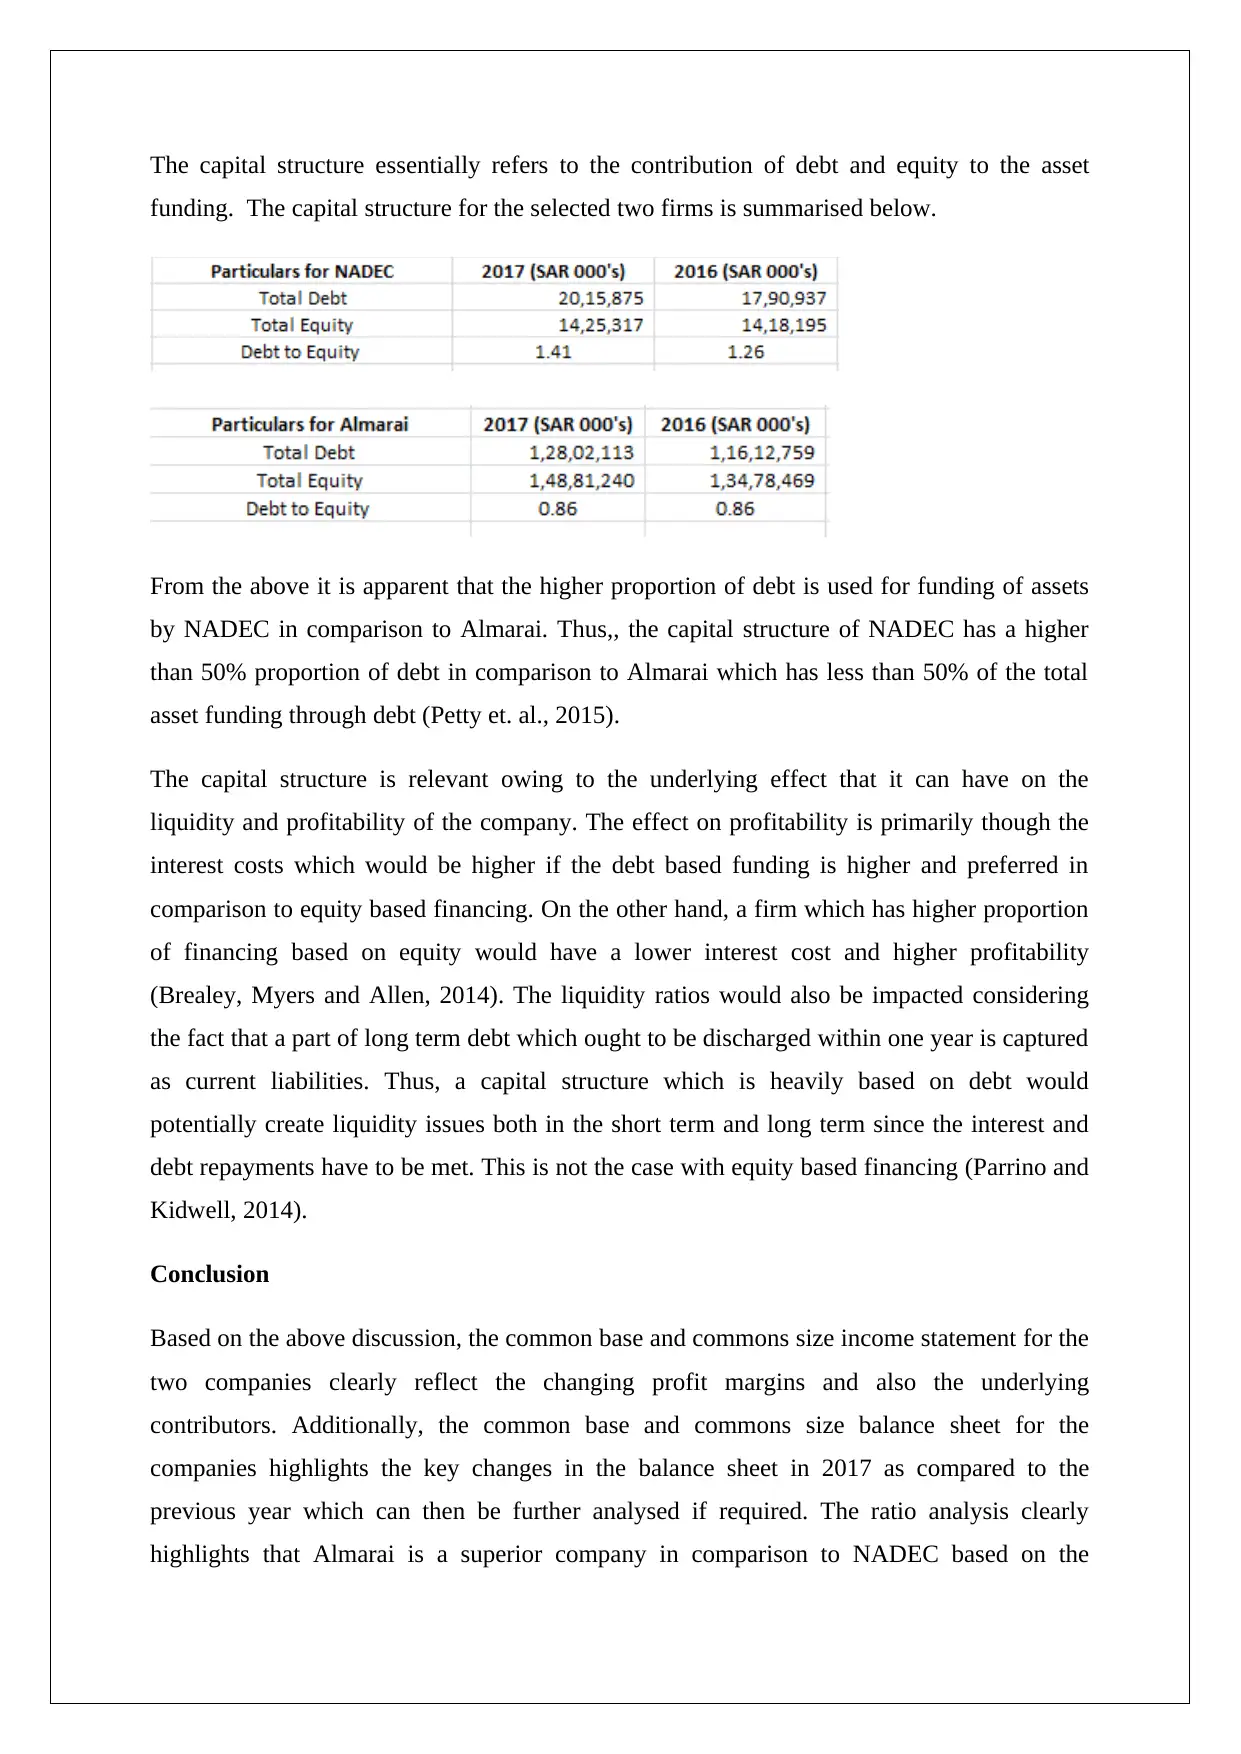
The capital structure essentially refers to the contribution of debt and equity to the asset
funding. The capital structure for the selected two firms is summarised below.
From the above it is apparent that the higher proportion of debt is used for funding of assets
by NADEC in comparison to Almarai. Thus,, the capital structure of NADEC has a higher
than 50% proportion of debt in comparison to Almarai which has less than 50% of the total
asset funding through debt (Petty et. al., 2015).
The capital structure is relevant owing to the underlying effect that it can have on the
liquidity and profitability of the company. The effect on profitability is primarily though the
interest costs which would be higher if the debt based funding is higher and preferred in
comparison to equity based financing. On the other hand, a firm which has higher proportion
of financing based on equity would have a lower interest cost and higher profitability
(Brealey, Myers and Allen, 2014). The liquidity ratios would also be impacted considering
the fact that a part of long term debt which ought to be discharged within one year is captured
as current liabilities. Thus, a capital structure which is heavily based on debt would
potentially create liquidity issues both in the short term and long term since the interest and
debt repayments have to be met. This is not the case with equity based financing (Parrino and
Kidwell, 2014).
Conclusion
Based on the above discussion, the common base and commons size income statement for the
two companies clearly reflect the changing profit margins and also the underlying
contributors. Additionally, the common base and commons size balance sheet for the
companies highlights the key changes in the balance sheet in 2017 as compared to the
previous year which can then be further analysed if required. The ratio analysis clearly
highlights that Almarai is a superior company in comparison to NADEC based on the
financial statements in terms of profitability, liquidity, solvency and efficiency. Further, the
capital structure of NADEC deploys a higher proportion of debt in comparison with Almarai.
Also, since debt funding requires interest payments and principal repayments, hence
profitability and liquidity of the firm are impacted owing to which capital structure decisions
are critical.
capital structure of NADEC deploys a higher proportion of debt in comparison with Almarai.
Also, since debt funding requires interest payments and principal repayments, hence
profitability and liquidity of the firm are impacted owing to which capital structure decisions
are critical.
References
Almarai (2018), Annual Report 2017, [online] Available at https://www.almarai.com/wp-
content/uploads/2018/04/Almarai-AR2017-ENG-web.pdf [Assessed November 20, 2018]
Brealey, R. A., Myers, S. C. and Allen, F. (2014) Principles of corporate finance, 6th ed. New
York: McGraw-Hill Publications
Damodaran, A. (2015). Applied corporate finance: A user’s manual 3rd ed. New York:
Wiley, John & Sons.
NADEC (2018) Financial Statements 2017, [online] Available at
https://www.nadec.com.sa/Portals/0/financial_statements/pdf/Financial
%20Statements_31%20Dec%202017.pdf?ver=2018-05-01-090704-210 [Assessed November
20, 2018]
Parrino, R. and Kidwell, D. (2014) Fundamentals of Corporate Finance, 3rd ed. London:
Wiley Publications
Petty, J.W., Titman, S., Keown, A., Martin, J.D., Martin, P., Burrow, M. and Nguyen, H. (2015).
Financial Management, Principles and Applications, 6th ed.. NSW: Pearson Education, French
Forest Australia
1 out of 10
Related Documents


Your All-in-One AI-Powered Toolkit for Academic Success.
+13062052269
info@desklib.com
Available 24*7 on WhatsApp / Email
![[object Object]](/_next/static/media/star-bottom.7253800d.svg)
Unlock your academic potential
© 2024 | Zucol Services PVT LTD | All rights reserved.