Financial Performance Analysis of Tesco and Competitors
VerifiedAdded on 2021/02/20
|15
|3450
|1530
Report
AI Summary
This report provides a comprehensive financial analysis of Tesco, examining its financial performance in comparison to its competitor, Morrisons. It includes an in-depth analysis of the statement of financial position, income statements, and various financial ratios such as liquidity, profitability, and solvency ratios. The report also explores the limitations of financial analysis. Furthermore, it delves into the valuation of Tesco using different methods, including asset-based valuation, the P/E ratio method, and the dividend valuation model, along with a discussion on the appropriateness of each method for Tesco. The report also includes the calculation of the Weighted Average Cost of Capital (WACC) and discusses the challenges associated with its assessment.
Finance.
Paraphrase This Document
Need a fresh take? Get an instant paraphrase of this document with our AI Paraphraser
Table of Contents
INTRODUCTION...........................................................................................................................3
TASK...............................................................................................................................................3
2.1 Analysis of financial performance of Tesco compared to its competitor Morrisons:..........3
2.2 Company Valuation:.............................................................................................................6
2.3 Capital Structure..................................................................................................................11
CONCLUSION..............................................................................................................................14
REFERENCES..............................................................................................................................15
INTRODUCTION
Finance implies studying about money management and figuring the resources needed.
The financial world's very basis is Finance. Financial services and financial tools are its
elements. Fundamentally, finance is all about acquisition of resources and their perfect
operations management. Capital, resources, cash and monetary figures are a few financial
constructs, but they all have a distinct entity (Weil, Schipper and Francis, 2013). To improve
business growth, the principles of finance must be carefully studied and understood. This study
covers financial analysis of Tesco and its competitor, limitations of application of financial
analysis and comparison, and valuation of Tesco from different methods. Study also contains
calculation of WACC along with discussion on difficulties in assessing WACC.
TASK
2.1 Analysis of financial performance of Tesco compared to its competitor Morrisons:
A. Analysis of statement of financial position: Analysis of balance sheet can be described as an
evaluation of a company's assets, all liabilities and entire equity funds. This analysis is typically
performed at fixed time intervals, such as quarterly or annual. The balance sheet evaluation
system is being used to derive actual data, figures or facts on the business's income, resources,
and liabilities (Watty, Jackling and Wilson, 2014).
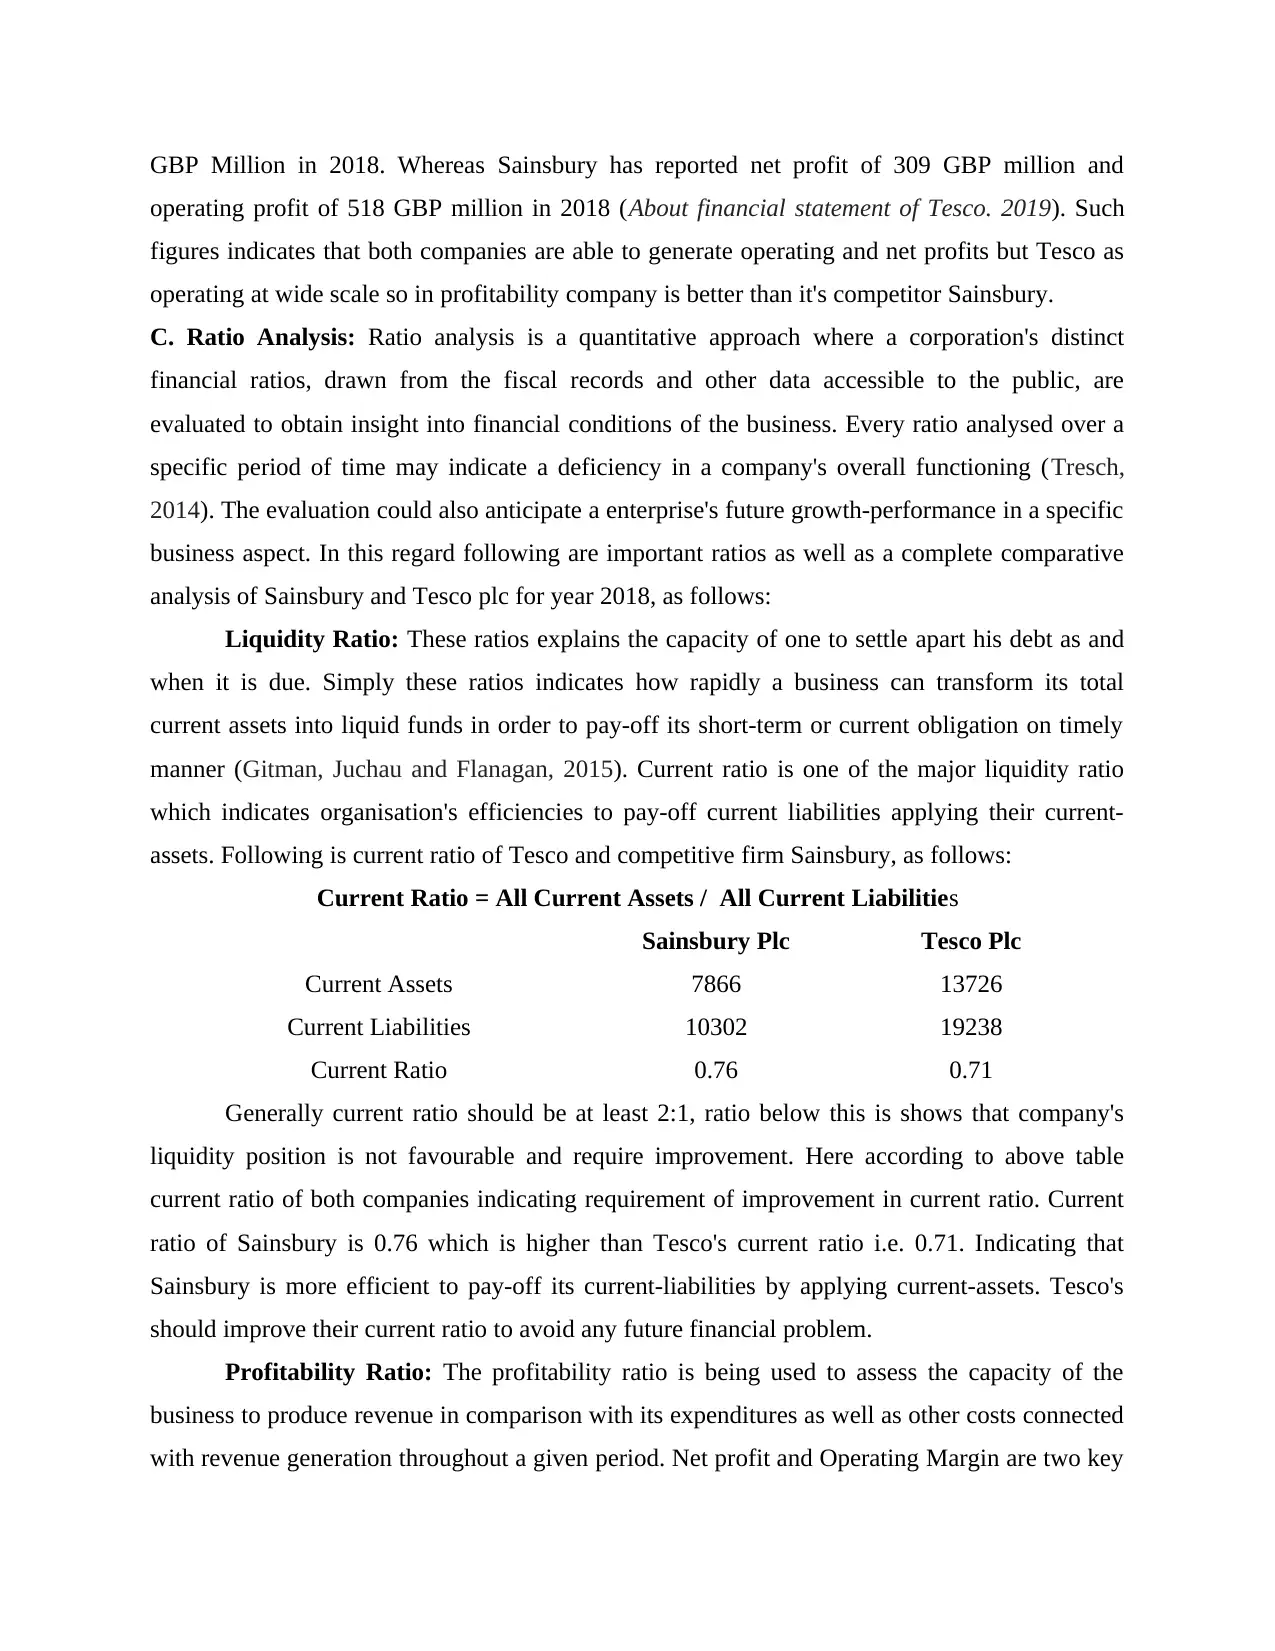
As per analysis of balance sheet of Tesco it has been observed that company's total assets
value is 44862 GBP million and liabilities are 34382 GBP Millions in year 2018. Whereas
Sainsbury has reported total assets of 22001 GBP million and liabilities amounting 14590 GBP
million in year 2018. Such figures of both companies showing that Tesco is operating at wider
scale as comparative of Sainsbury. Tesco's shareholder funds are 10480 GBP million in 2018
which is 7411 GBP million in case of Sainsbury. Form above analysis it is clear that Tesco with
large operating scale and resources giving tuff competition to its competitor Sainsbury.
B. Analysis of Income Statements: The income statement analysis encompasses comparison of
various line items in a statement and observing trends of individual line products over various
phases. This analysis is often used to comprehend a corporation ' cost structure as well as its
capacity to generate profit.
From the analysis of reported income statement of Tesco it has been analysed that
company's net profit is 1206 GBP Million while company has earned operating profit of 1564
Finance implies studying about money management and figuring the resources needed.
The financial world's very basis is Finance. Financial services and financial tools are its
elements. Fundamentally, finance is all about acquisition of resources and their perfect
operations management. Capital, resources, cash and monetary figures are a few financial
constructs, but they all have a distinct entity (Weil, Schipper and Francis, 2013). To improve
business growth, the principles of finance must be carefully studied and understood. This study
covers financial analysis of Tesco and its competitor, limitations of application of financial
analysis and comparison, and valuation of Tesco from different methods. Study also contains
calculation of WACC along with discussion on difficulties in assessing WACC.
TASK
2.1 Analysis of financial performance of Tesco compared to its competitor Morrisons:
A. Analysis of statement of financial position: Analysis of balance sheet can be described as an
evaluation of a company's assets, all liabilities and entire equity funds. This analysis is typically
performed at fixed time intervals, such as quarterly or annual. The balance sheet evaluation
system is being used to derive actual data, figures or facts on the business's income, resources,
and liabilities (Watty, Jackling and Wilson, 2014).
As per analysis of balance sheet of Tesco it has been observed that company's total assets
value is 44862 GBP million and liabilities are 34382 GBP Millions in year 2018. Whereas
Sainsbury has reported total assets of 22001 GBP million and liabilities amounting 14590 GBP
million in year 2018. Such figures of both companies showing that Tesco is operating at wider
scale as comparative of Sainsbury. Tesco's shareholder funds are 10480 GBP million in 2018
which is 7411 GBP million in case of Sainsbury. Form above analysis it is clear that Tesco with
large operating scale and resources giving tuff competition to its competitor Sainsbury.
B. Analysis of Income Statements: The income statement analysis encompasses comparison of
various line items in a statement and observing trends of individual line products over various
phases. This analysis is often used to comprehend a corporation ' cost structure as well as its
capacity to generate profit.
From the analysis of reported income statement of Tesco it has been analysed that
company's net profit is 1206 GBP Million while company has earned operating profit of 1564
⊘ This is a preview!⊘
Do you want full access?
Subscribe today to unlock all pages.
Trusted by 1+ million students worldwide
GBP Million in 2018. Whereas Sainsbury has reported net profit of 309 GBP million and
operating profit of 518 GBP million in 2018 (About financial statement of Tesco. 2019). Such
figures indicates that both companies are able to generate operating and net profits but Tesco as
operating at wide scale so in profitability company is better than it's competitor Sainsbury.
C. Ratio Analysis: Ratio analysis is a quantitative approach where a corporation's distinct
financial ratios, drawn from the fiscal records and other data accessible to the public, are
evaluated to obtain insight into financial conditions of the business. Every ratio analysed over a
specific period of time may indicate a deficiency in a company's overall functioning (Tresch,
2014). The evaluation could also anticipate a enterprise's future growth-performance in a specific
business aspect. In this regard following are important ratios as well as a complete comparative
analysis of Sainsbury and Tesco plc for year 2018, as follows:
Liquidity Ratio: These ratios explains the capacity of one to settle apart his debt as and
when it is due. Simply these ratios indicates how rapidly a business can transform its total
current assets into liquid funds in order to pay-off its short-term or current obligation on timely
manner (Gitman, Juchau and Flanagan, 2015). Current ratio is one of the major liquidity ratio
which indicates organisation's efficiencies to pay-off current liabilities applying their current-
assets. Following is current ratio of Tesco and competitive firm Sainsbury, as follows:
Current Ratio = All Current Assets / All Current Liabilities
Sainsbury Plc Tesco Plc
Current Assets 7866 13726
Current Liabilities 10302 19238
Current Ratio 0.76 0.71
Generally current ratio should be at least 2:1, ratio below this is shows that company's
liquidity position is not favourable and require improvement. Here according to above table
current ratio of both companies indicating requirement of improvement in current ratio. Current
ratio of Sainsbury is 0.76 which is higher than Tesco's current ratio i.e. 0.71. Indicating that
Sainsbury is more efficient to pay-off its current-liabilities by applying current-assets. Tesco's
should improve their current ratio to avoid any future financial problem.
Profitability Ratio: The profitability ratio is being used to assess the capacity of the
business to produce revenue in comparison with its expenditures as well as other costs connected
with revenue generation throughout a given period. Net profit and Operating Margin are two key
Paraphrase This Document
Need a fresh take? Get an instant paraphrase of this document with our AI Paraphraser
profitability ratios which defines actual profitability position of company over particular time-
frame. Here are these ratio in context of Tesco and Sainsbury, as discussed below:
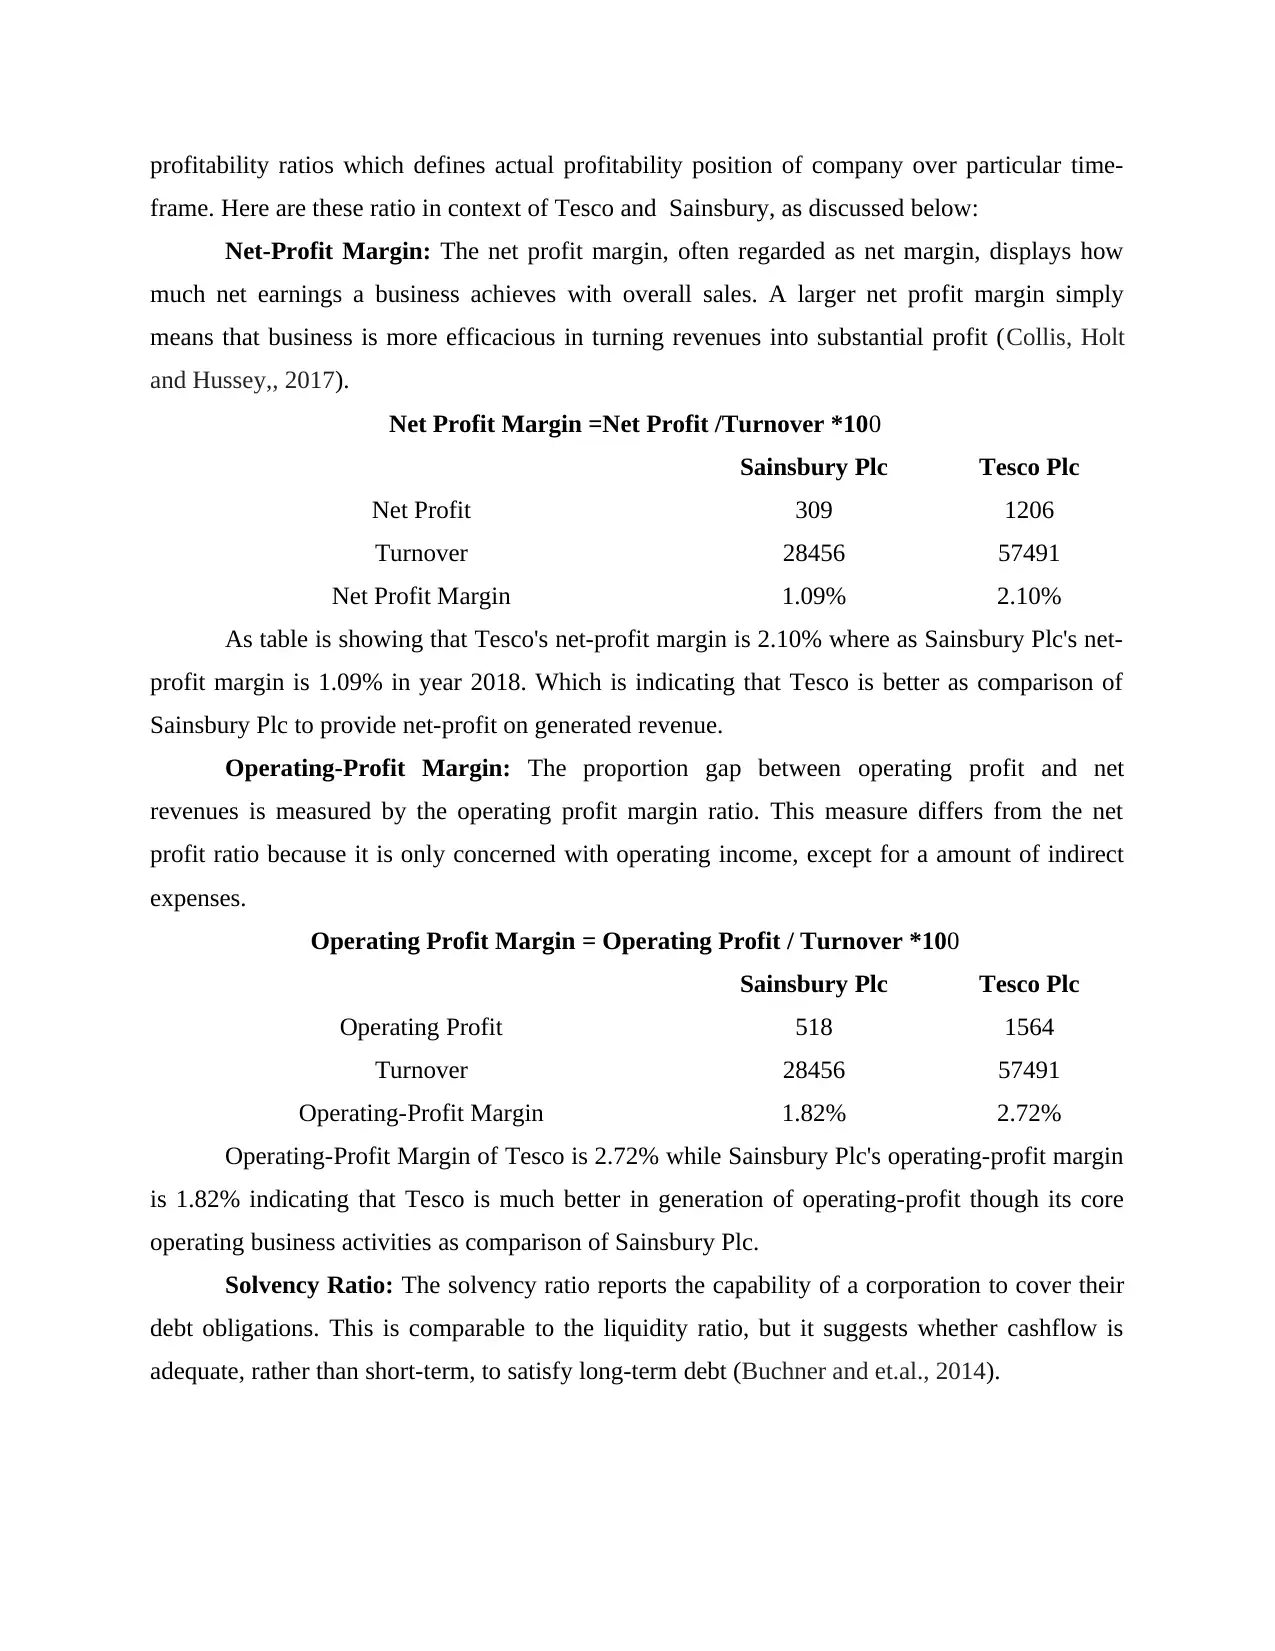
Net-Profit Margin: The net profit margin, often regarded as net margin, displays how
much net earnings a business achieves with overall sales. A larger net profit margin simply
means that business is more efficacious in turning revenues into substantial profit (Collis, Holt
and Hussey,, 2017).
Net Profit Margin =Net Profit /Turnover *100
Sainsbury Plc Tesco Plc
Net Profit 309 1206
Turnover 28456 57491
Net Profit Margin 1.09% 2.10%
As table is showing that Tesco's net-profit margin is 2.10% where as Sainsbury Plc's net-
profit margin is 1.09% in year 2018. Which is indicating that Tesco is better as comparison of
Sainsbury Plc to provide net-profit on generated revenue.
Operating-Profit Margin: The proportion gap between operating profit and net
revenues is measured by the operating profit margin ratio. This measure differs from the net
profit ratio because it is only concerned with operating income, except for a amount of indirect
expenses.
Operating Profit Margin = Operating Profit / Turnover *100
Sainsbury Plc Tesco Plc
Operating Profit 518 1564
Turnover 28456 57491
Operating-Profit Margin 1.82% 2.72%
Operating-Profit Margin of Tesco is 2.72% while Sainsbury Plc's operating-profit margin
is 1.82% indicating that Tesco is much better in generation of operating-profit though its core
operating business activities as comparison of Sainsbury Plc.
Solvency Ratio: The solvency ratio reports the capability of a corporation to cover their
debt obligations. This is comparable to the liquidity ratio, but it suggests whether cashflow is
adequate, rather than short-term, to satisfy long-term debt (Buchner and et.al., 2014).
frame. Here are these ratio in context of Tesco and Sainsbury, as discussed below:
Net-Profit Margin: The net profit margin, often regarded as net margin, displays how
much net earnings a business achieves with overall sales. A larger net profit margin simply
means that business is more efficacious in turning revenues into substantial profit (Collis, Holt
and Hussey,, 2017).
Net Profit Margin =Net Profit /Turnover *100
Sainsbury Plc Tesco Plc
Net Profit 309 1206
Turnover 28456 57491
Net Profit Margin 1.09% 2.10%
As table is showing that Tesco's net-profit margin is 2.10% where as Sainsbury Plc's net-
profit margin is 1.09% in year 2018. Which is indicating that Tesco is better as comparison of
Sainsbury Plc to provide net-profit on generated revenue.
Operating-Profit Margin: The proportion gap between operating profit and net
revenues is measured by the operating profit margin ratio. This measure differs from the net
profit ratio because it is only concerned with operating income, except for a amount of indirect
expenses.
Operating Profit Margin = Operating Profit / Turnover *100
Sainsbury Plc Tesco Plc
Operating Profit 518 1564
Turnover 28456 57491
Operating-Profit Margin 1.82% 2.72%
Operating-Profit Margin of Tesco is 2.72% while Sainsbury Plc's operating-profit margin
is 1.82% indicating that Tesco is much better in generation of operating-profit though its core
operating business activities as comparison of Sainsbury Plc.
Solvency Ratio: The solvency ratio reports the capability of a corporation to cover their
debt obligations. This is comparable to the liquidity ratio, but it suggests whether cashflow is
adequate, rather than short-term, to satisfy long-term debt (Buchner and et.al., 2014).
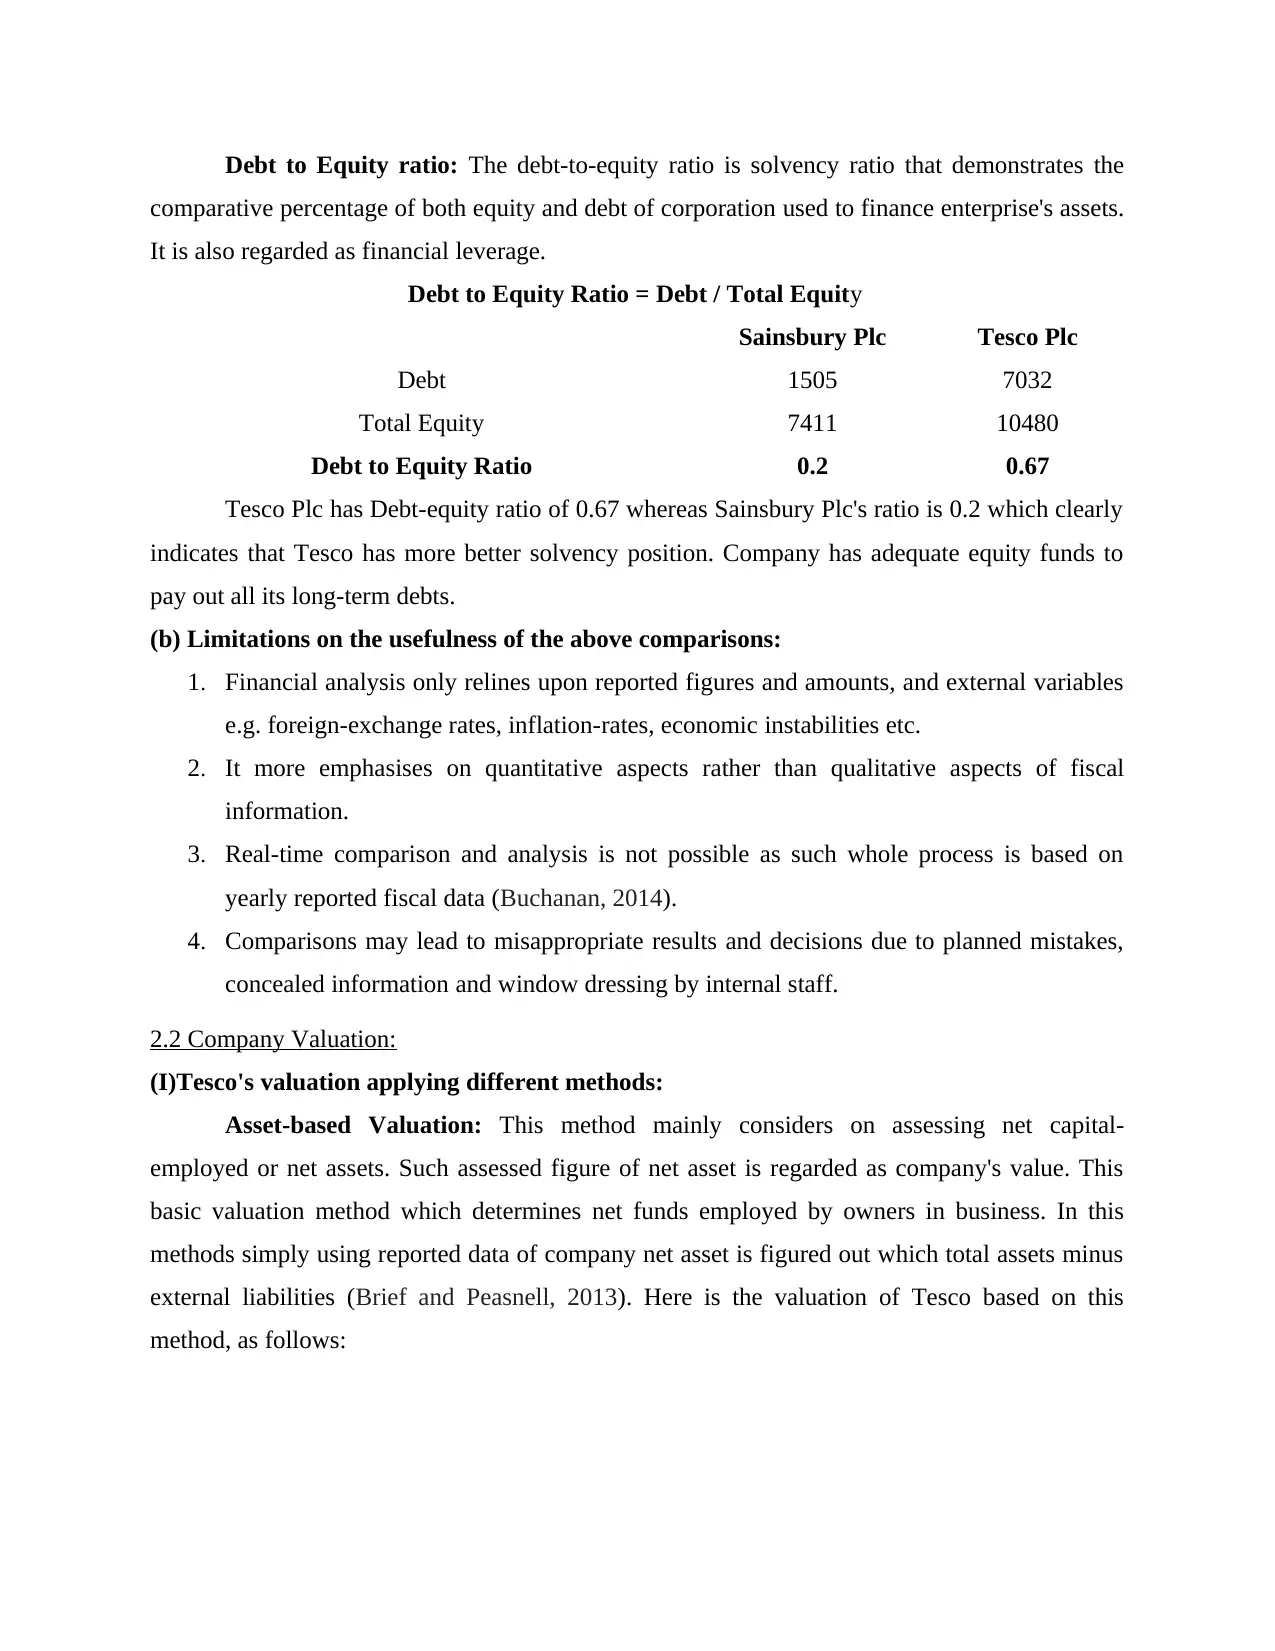
Debt to Equity ratio: The debt-to-equity ratio is solvency ratio that demonstrates the
comparative percentage of both equity and debt of corporation used to finance enterprise's assets.
It is also regarded as financial leverage.
Debt to Equity Ratio = Debt / Total Equity
Sainsbury Plc Tesco Plc
Debt 1505 7032
Total Equity 7411 10480
Debt to Equity Ratio 0.2 0.67
Tesco Plc has Debt-equity ratio of 0.67 whereas Sainsbury Plc's ratio is 0.2 which clearly
indicates that Tesco has more better solvency position. Company has adequate equity funds to
pay out all its long-term debts.
(b) Limitations on the usefulness of the above comparisons:
1. Financial analysis only relines upon reported figures and amounts, and external variables
e.g. foreign-exchange rates, inflation-rates, economic instabilities etc.
2. It more emphasises on quantitative aspects rather than qualitative aspects of fiscal
information.
3. Real-time comparison and analysis is not possible as such whole process is based on
yearly reported fiscal data (Buchanan, 2014).
4. Comparisons may lead to misappropriate results and decisions due to planned mistakes,
concealed information and window dressing by internal staff.
2.2 Company Valuation:
(I)Tesco's valuation applying different methods:
Asset-based Valuation: This method mainly considers on assessing net capital-
employed or net assets. Such assessed figure of net asset is regarded as company's value. This
basic valuation method which determines net funds employed by owners in business. In this
methods simply using reported data of company net asset is figured out which total assets minus
external liabilities (Brief and Peasnell, 2013). Here is the valuation of Tesco based on this
method, as follows:
⊘ This is a preview!⊘
Do you want full access?
Subscribe today to unlock all pages.
Trusted by 1+ million students worldwide
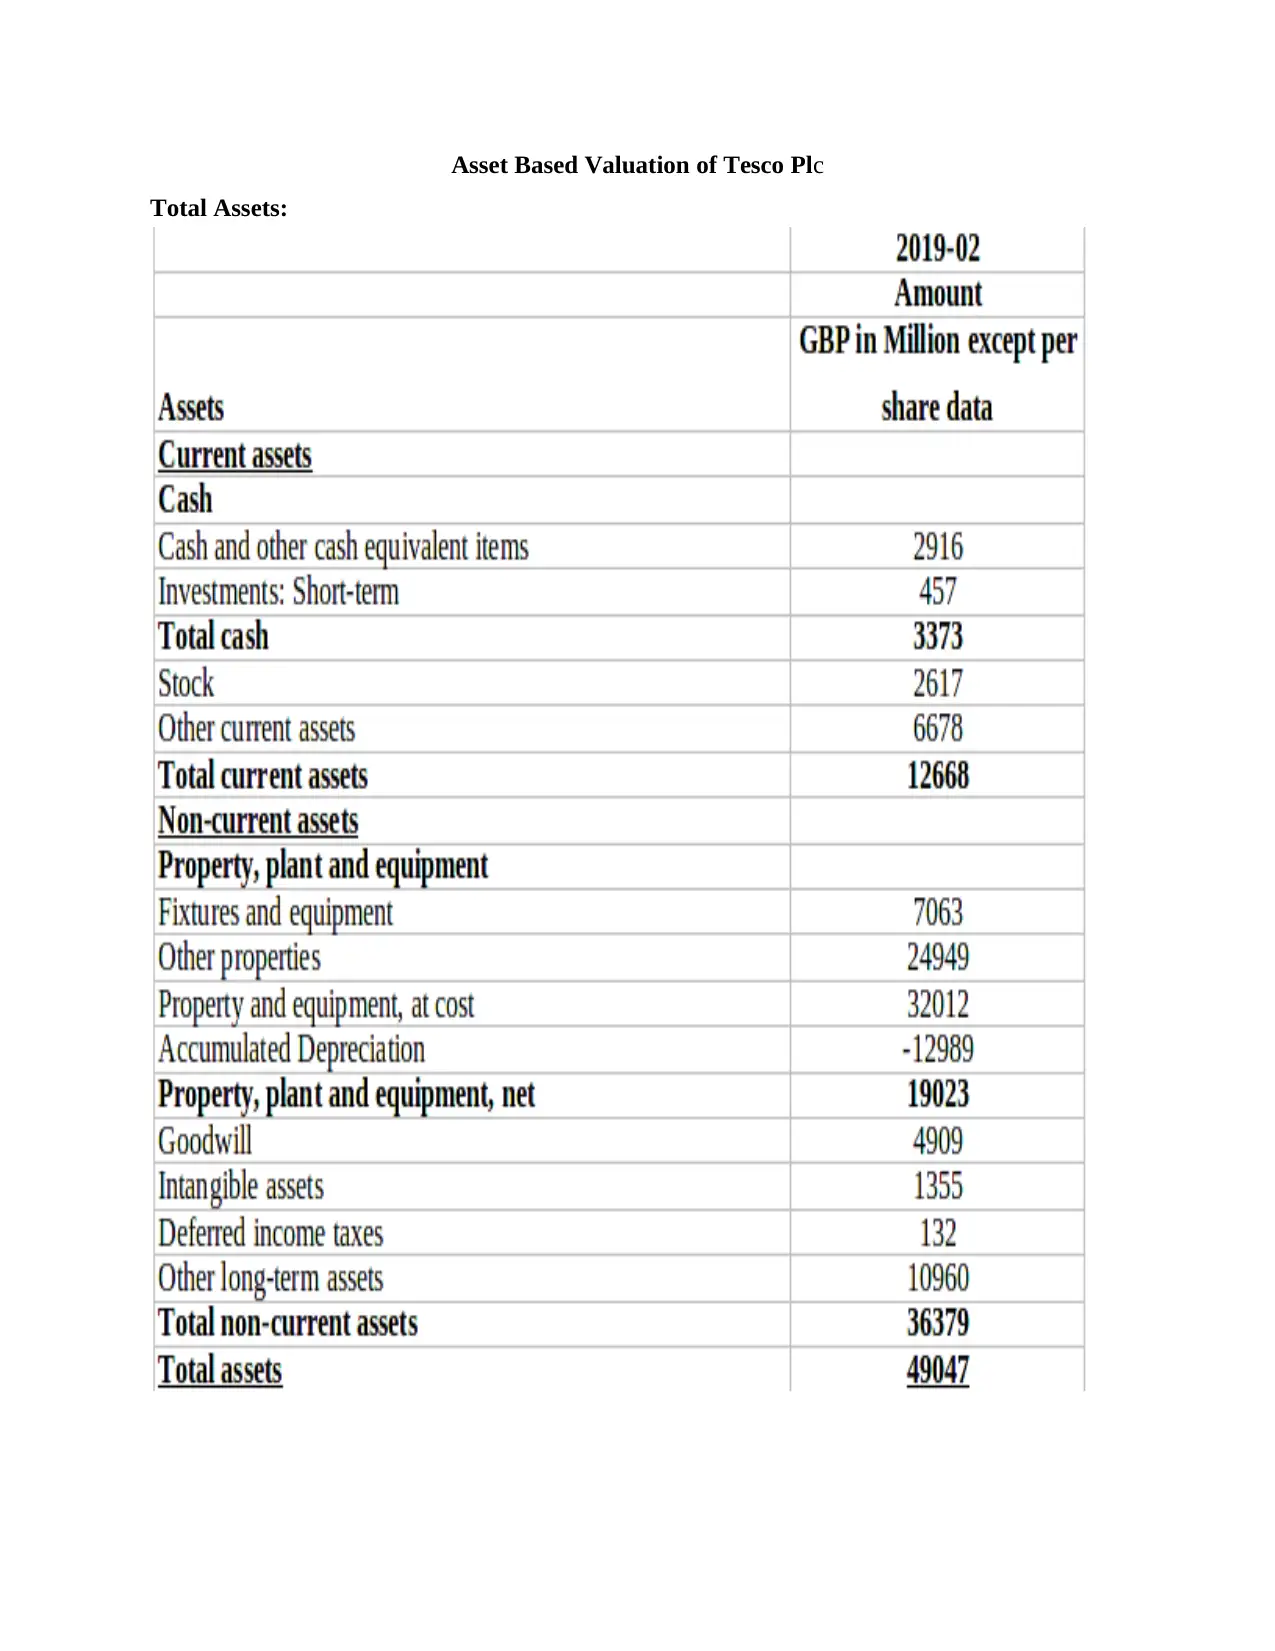
Asset Based Valuation of Tesco Plc
Total Assets:
Total Assets:
Paraphrase This Document
Need a fresh take? Get an instant paraphrase of this document with our AI Paraphraser
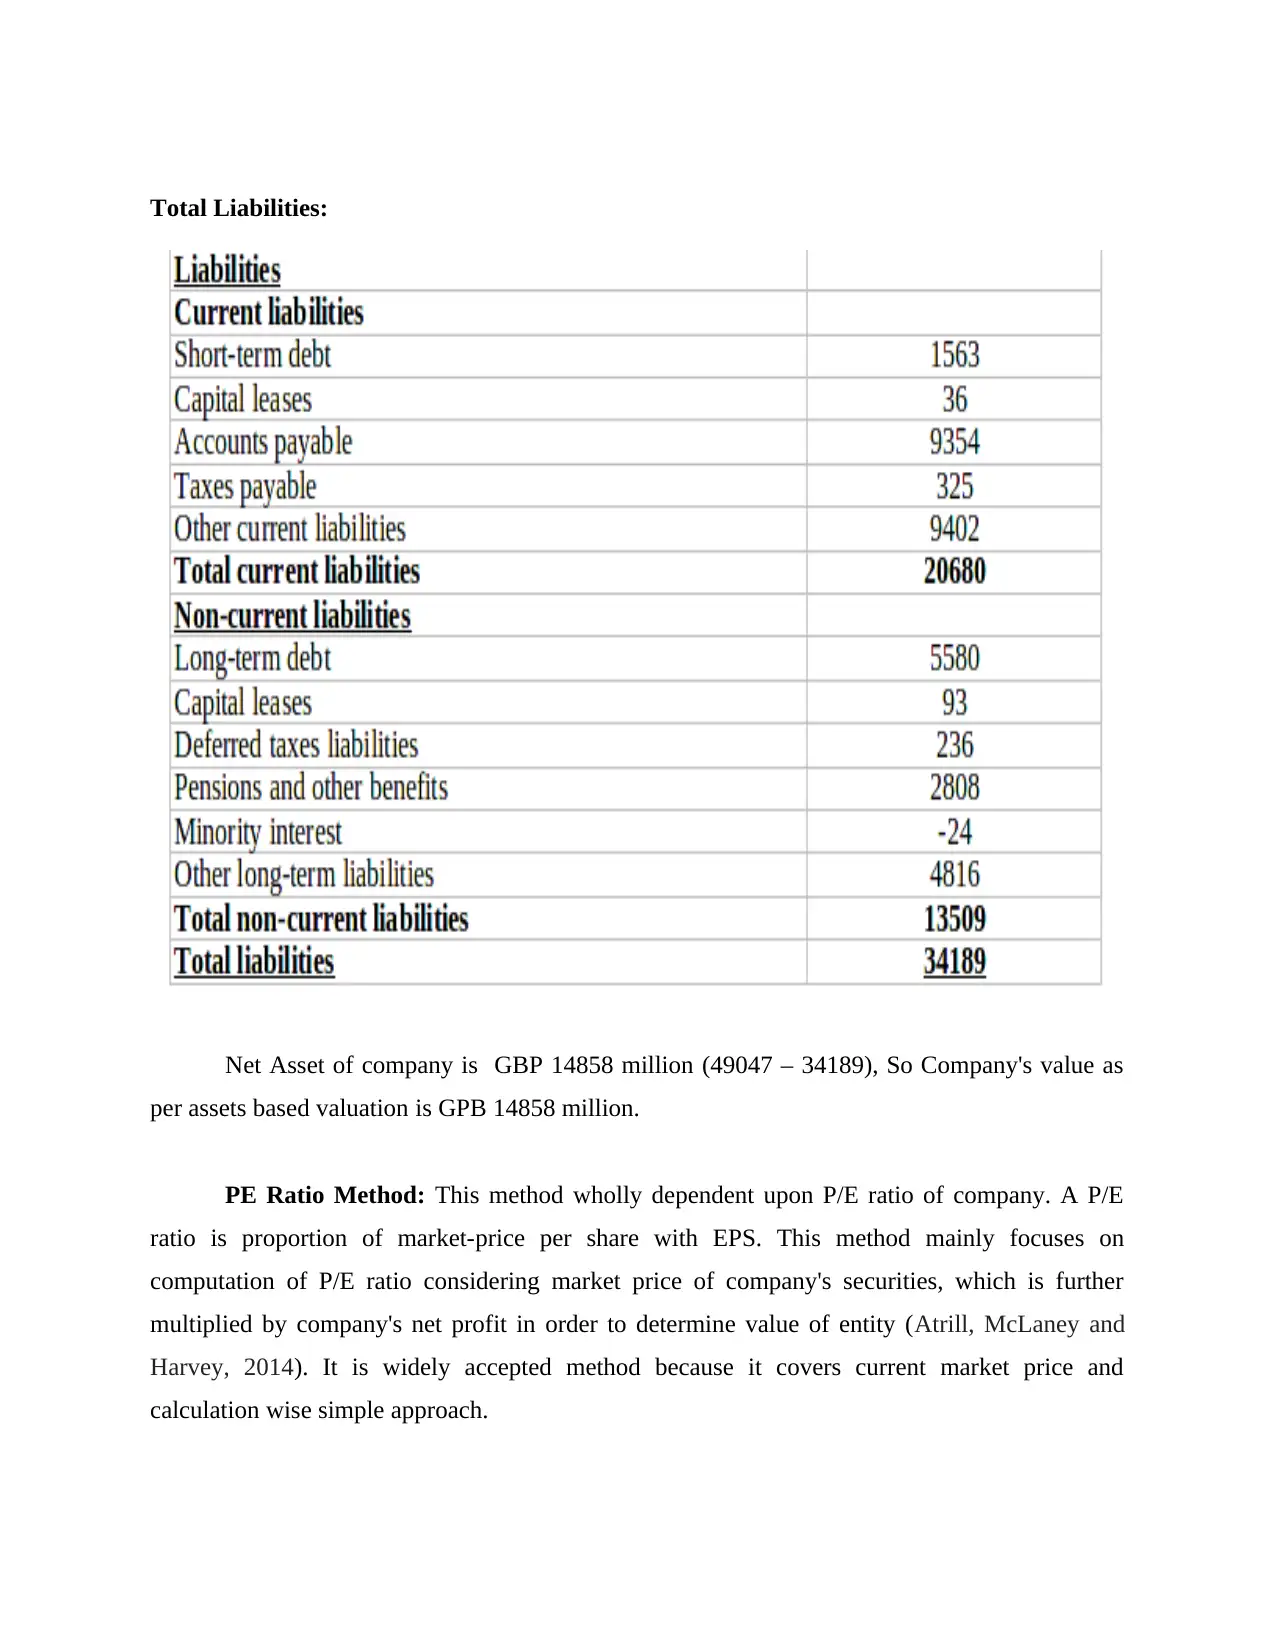
Total Liabilities:
Net Asset of company is GBP 14858 million (49047 – 34189), So Company's value as
per assets based valuation is GPB 14858 million.
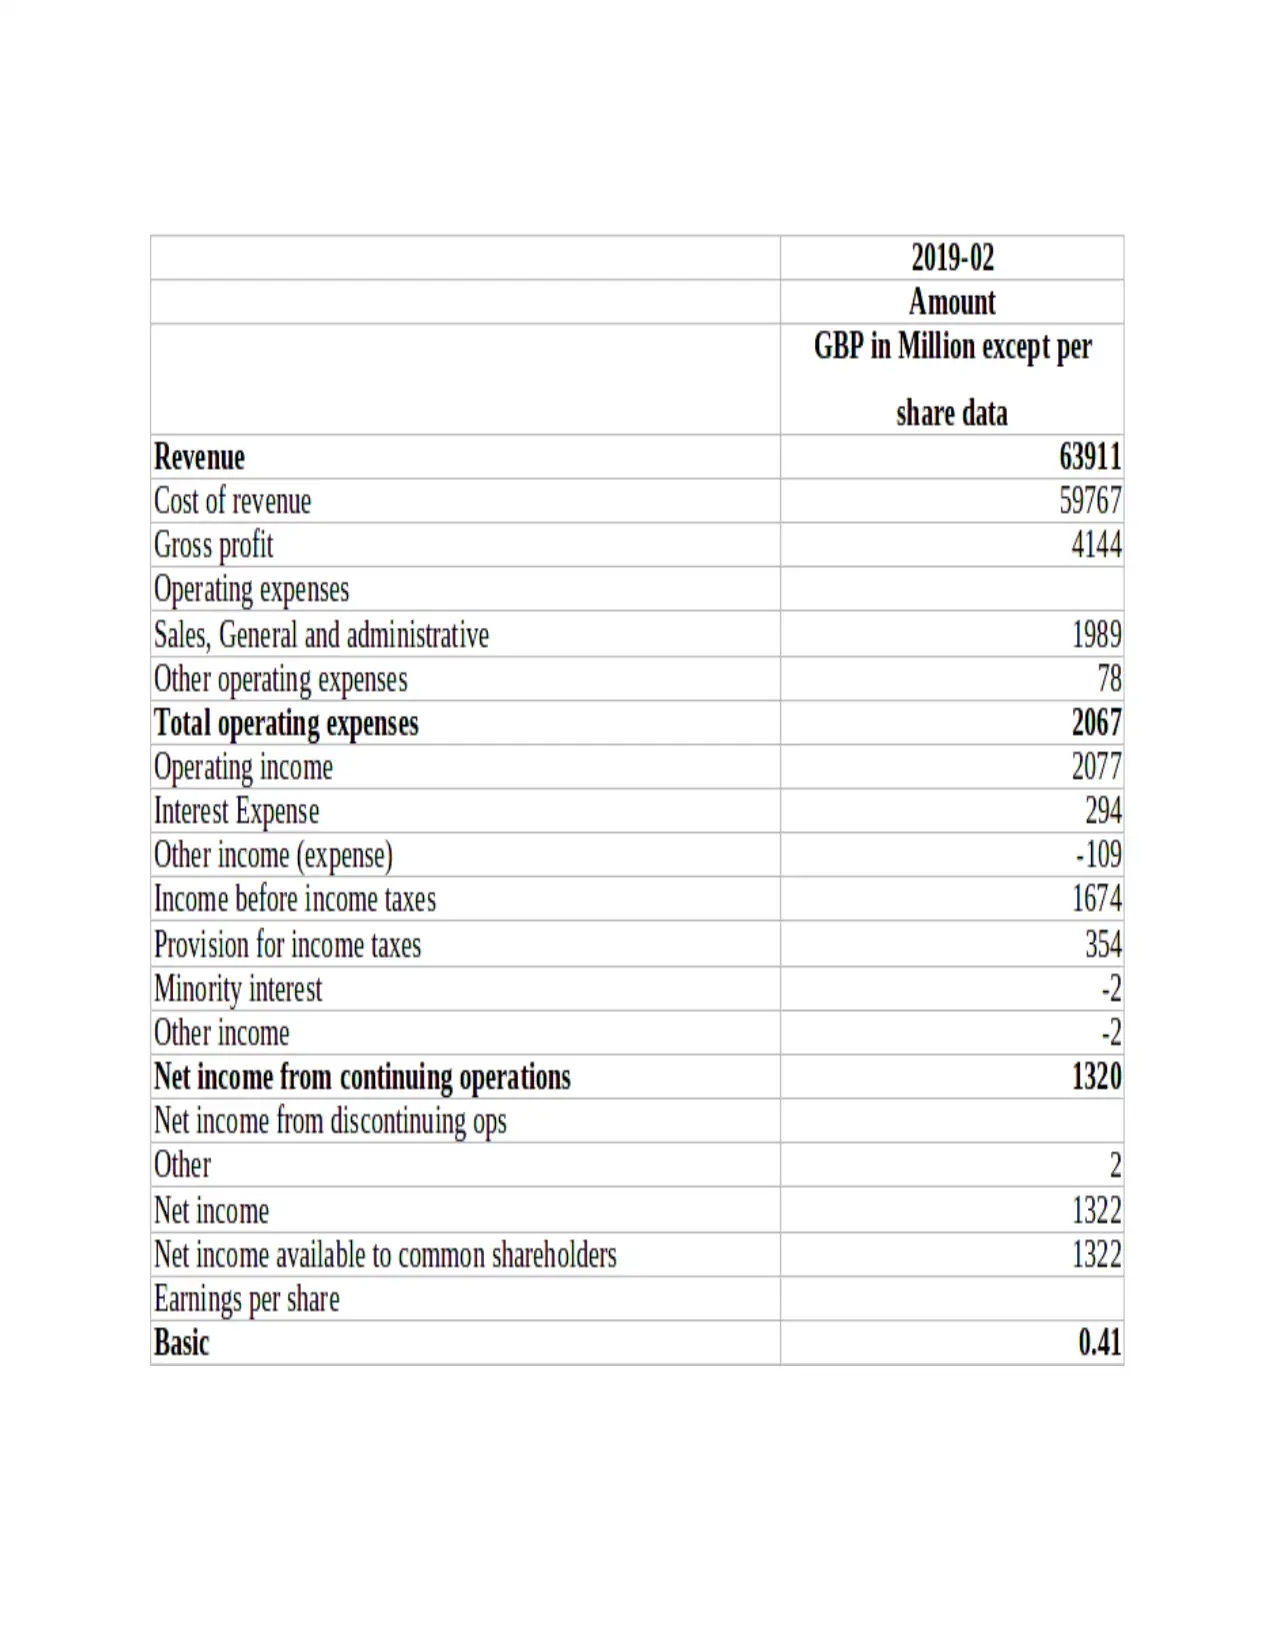
PE Ratio Method: This method wholly dependent upon P/E ratio of company. A P/E
ratio is proportion of market-price per share with EPS. This method mainly focuses on
computation of P/E ratio considering market price of company's securities, which is further
multiplied by company's net profit in order to determine value of entity (Atrill, McLaney and
Harvey, 2014). It is widely accepted method because it covers current market price and
calculation wise simple approach.
Net Asset of company is GBP 14858 million (49047 – 34189), So Company's value as
per assets based valuation is GPB 14858 million.
PE Ratio Method: This method wholly dependent upon P/E ratio of company. A P/E
ratio is proportion of market-price per share with EPS. This method mainly focuses on
computation of P/E ratio considering market price of company's securities, which is further
multiplied by company's net profit in order to determine value of entity (Atrill, McLaney and
Harvey, 2014). It is widely accepted method because it covers current market price and
calculation wise simple approach.
⊘ This is a preview!⊘
Do you want full access?
Subscribe today to unlock all pages.
Trusted by 1+ million students worldwide
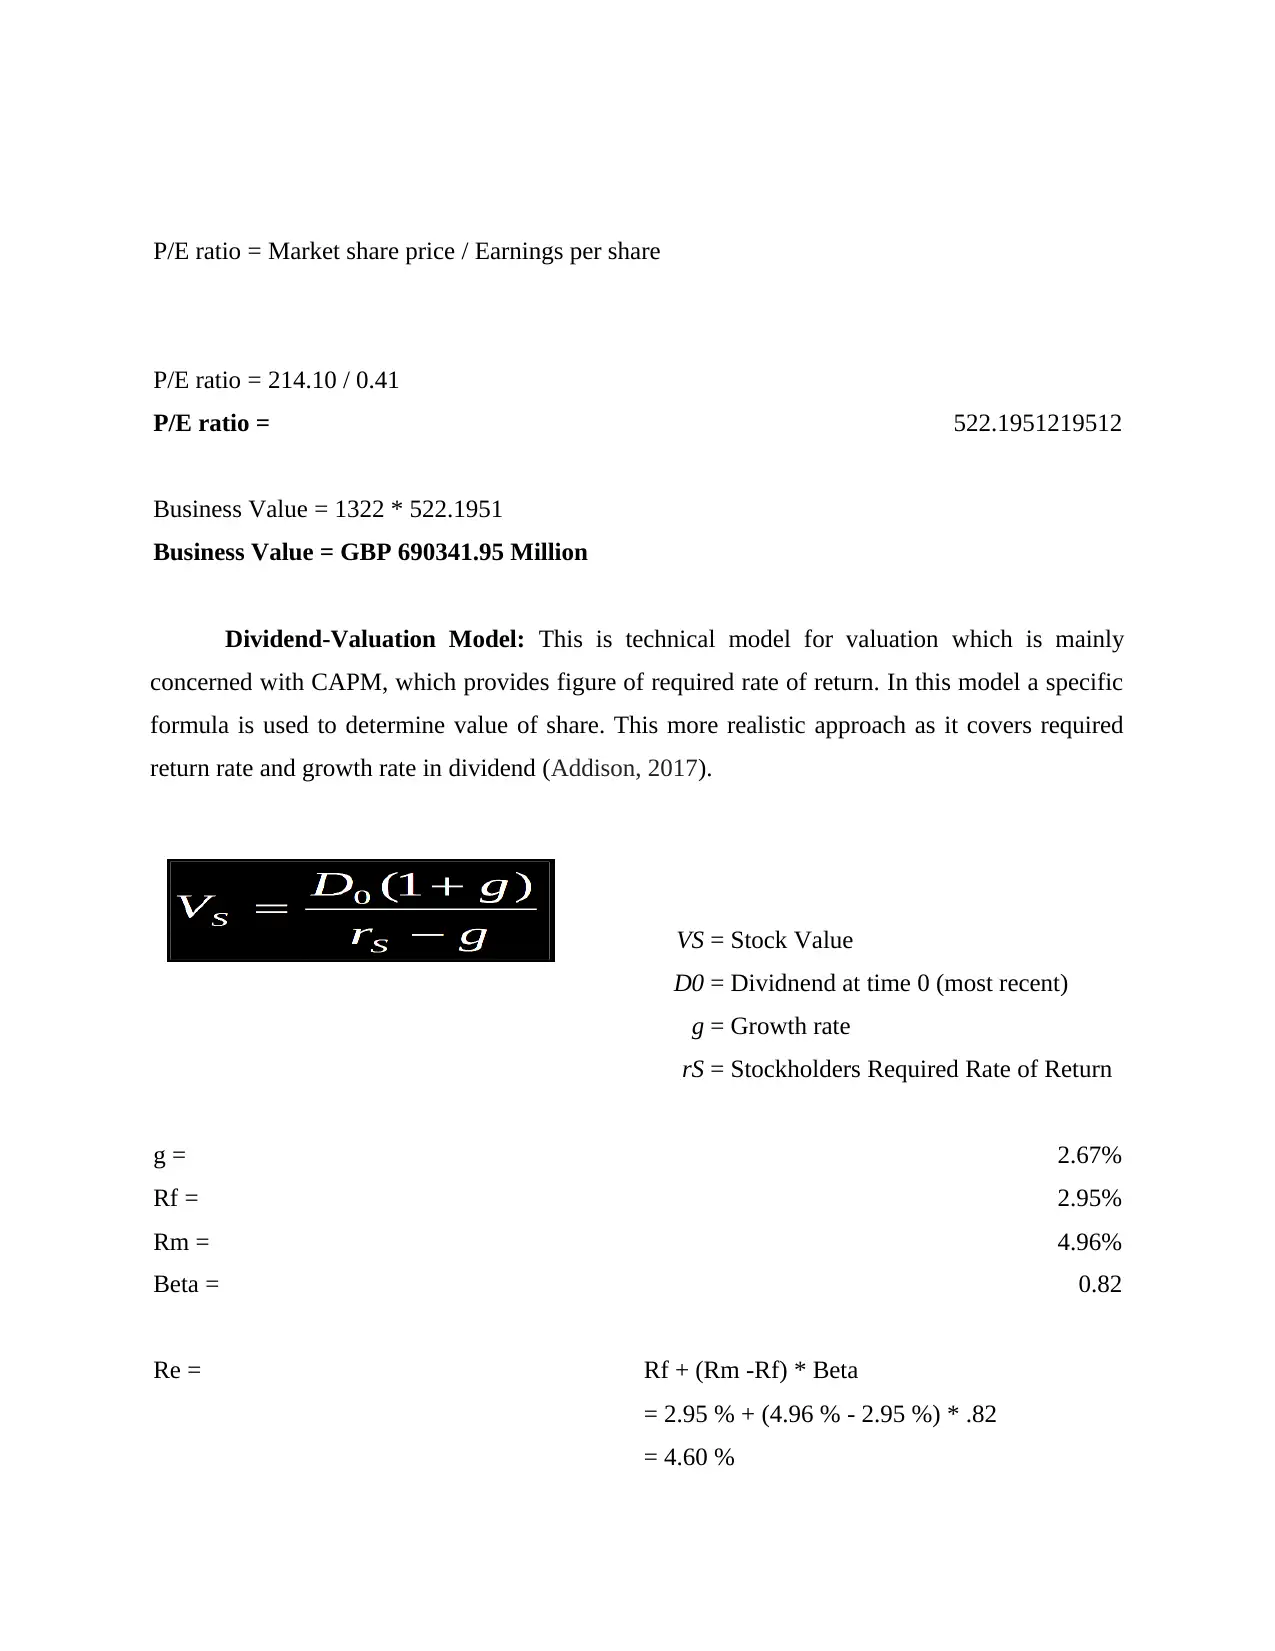
P/E ratio = Market share price / Earnings per share
P/E ratio = 214.10 / 0.41
P/E ratio = 522.1951219512
Business Value = 1322 * 522.1951
Business Value = GBP 690341.95 Million
Dividend-Valuation Model: This is technical model for valuation which is mainly
concerned with CAPM, which provides figure of required rate of return. In this model a specific
formula is used to determine value of share. This more realistic approach as it covers required
return rate and growth rate in dividend (Addison, 2017).
VS = Stock Value
D0 = Dividnend at time 0 (most recent)
g = Growth rate
rS = Stockholders Required Rate of Return
g = 2.67%
Rf = 2.95%
Rm = 4.96%
Beta = 0.82
Re = Rf + (Rm -Rf) * Beta
= 2.95 % + (4.96 % - 2.95 %) * .82
= 4.60 %
Paraphrase This Document
Need a fresh take? Get an instant paraphrase of this document with our AI Paraphraser
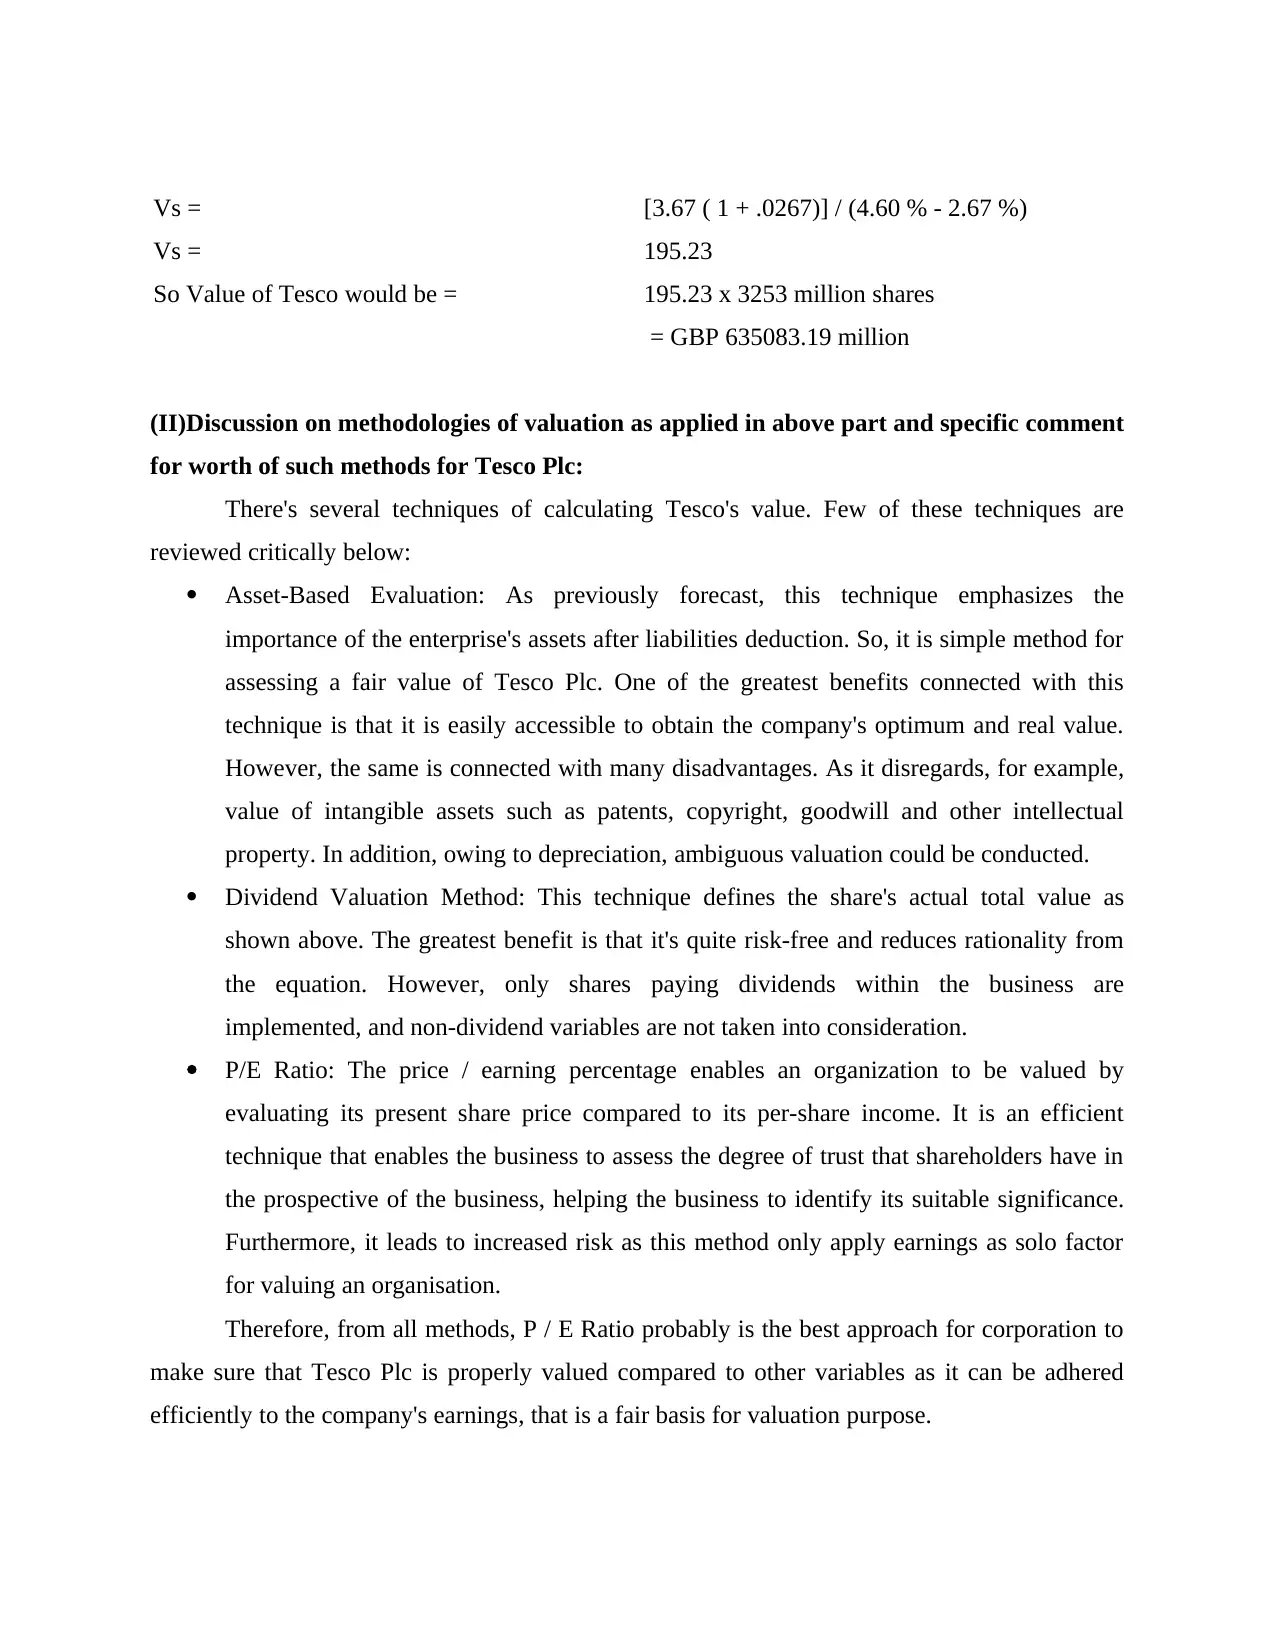
Vs = [3.67 ( 1 + .0267)] / (4.60 % - 2.67 %)
Vs = 195.23
So Value of Tesco would be = 195.23 x 3253 million shares
= GBP 635083.19 million
(II)Discussion on methodologies of valuation as applied in above part and specific comment
for worth of such methods for Tesco Plc:
There's several techniques of calculating Tesco's value. Few of these techniques are
reviewed critically below:
Asset-Based Evaluation: As previously forecast, this technique emphasizes the
importance of the enterprise's assets after liabilities deduction. So, it is simple method for
assessing a fair value of Tesco Plc. One of the greatest benefits connected with this
technique is that it is easily accessible to obtain the company's optimum and real value.
However, the same is connected with many disadvantages. As it disregards, for example,
value of intangible assets such as patents, copyright, goodwill and other intellectual
property. In addition, owing to depreciation, ambiguous valuation could be conducted.
Dividend Valuation Method: This technique defines the share's actual total value as
shown above. The greatest benefit is that it's quite risk-free and reduces rationality from
the equation. However, only shares paying dividends within the business are
implemented, and non-dividend variables are not taken into consideration.
P/E Ratio: The price / earning percentage enables an organization to be valued by
evaluating its present share price compared to its per-share income. It is an efficient
technique that enables the business to assess the degree of trust that shareholders have in
the prospective of the business, helping the business to identify its suitable significance.
Furthermore, it leads to increased risk as this method only apply earnings as solo factor
for valuing an organisation.
Therefore, from all methods, P / E Ratio probably is the best approach for corporation to
make sure that Tesco Plc is properly valued compared to other variables as it can be adhered
efficiently to the company's earnings, that is a fair basis for valuation purpose.
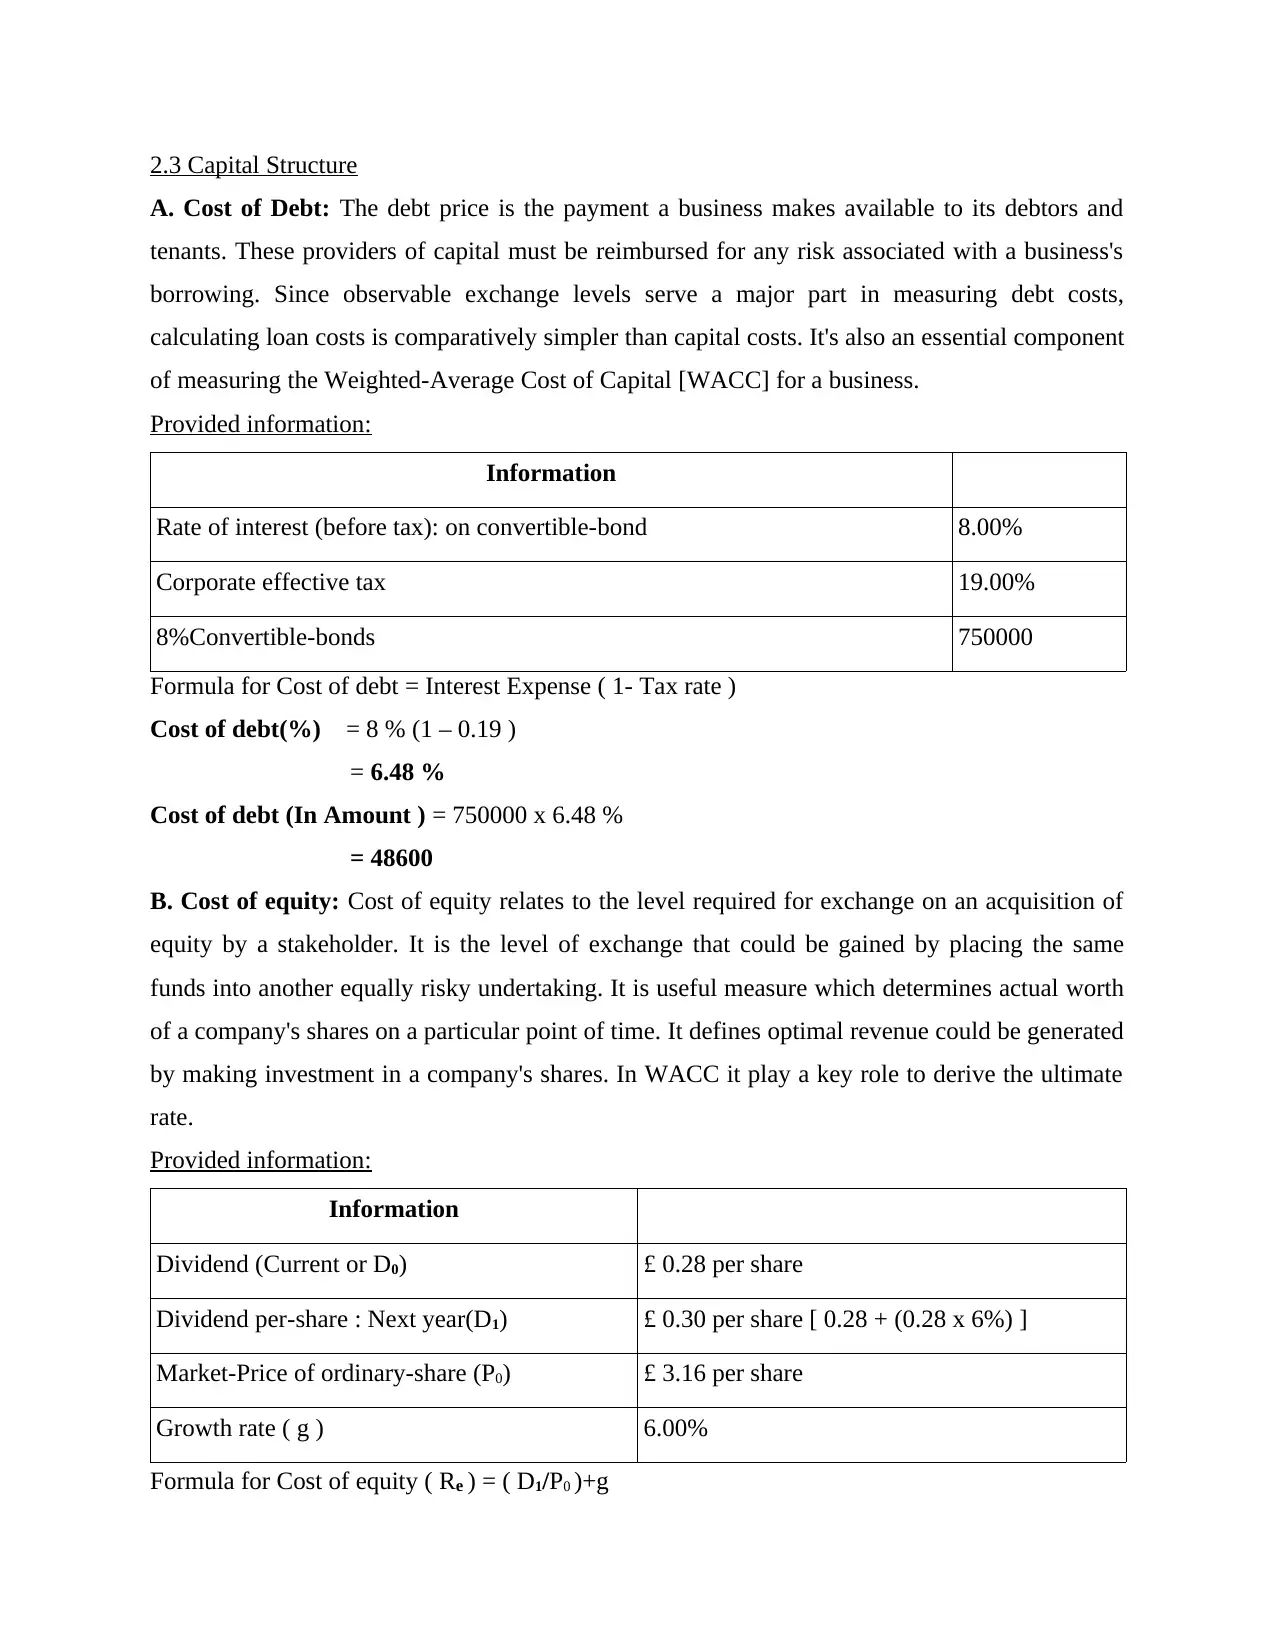
2.3 Capital Structure
A. Cost of Debt: The debt price is the payment a business makes available to its debtors and
tenants. These providers of capital must be reimbursed for any risk associated with a business's
borrowing. Since observable exchange levels serve a major part in measuring debt costs,
calculating loan costs is comparatively simpler than capital costs. It's also an essential component
of measuring the Weighted-Average Cost of Capital [WACC] for a business.
Provided information:
Information
Rate of interest (before tax): on convertible-bond 8.00%
Corporate effective tax 19.00%
8%Convertible-bonds 750000
Formula for Cost of debt = Interest Expense ( 1- Tax rate )
Cost of debt(%) = 8 % (1 – 0.19 )
= 6.48 %
Cost of debt (In Amount ) = 750000 x 6.48 %
= 48600
B. Cost of equity: Cost of equity relates to the level required for exchange on an acquisition of
equity by a stakeholder. It is the level of exchange that could be gained by placing the same
funds into another equally risky undertaking. It is useful measure which determines actual worth
of a company's shares on a particular point of time. It defines optimal revenue could be generated
by making investment in a company's shares. In WACC it play a key role to derive the ultimate
rate.
Provided information:
Information
Dividend (Current or D0) £ 0.28 per share
Dividend per-share : Next year(D1) £ 0.30 per share [ 0.28 + (0.28 x 6%) ]
Market-Price of ordinary-share (P0) £ 3.16 per share
Growth rate ( g ) 6.00%
Formula for Cost of equity ( Re ) = ( D1/P0 )+g
⊘ This is a preview!⊘
Do you want full access?
Subscribe today to unlock all pages.
Trusted by 1+ million students worldwide
1 out of 15
Related Documents


Your All-in-One AI-Powered Toolkit for Academic Success.
+13062052269
info@desklib.com
Available 24*7 on WhatsApp / Email
![[object Object]](/_next/static/media/star-bottom.7253800d.svg)
Unlock your academic potential
Copyright © 2020–2026 A2Z Services. All Rights Reserved. Developed and managed by ZUCOL.