Financial Performance Analysis: British Airways and American Airlines
VerifiedAdded on 2020/10/22
|28
|7152
|188
Report
AI Summary
This report provides a comprehensive financial analysis of British Airways (BA) and American Airlines (AA) based on their audited annual reports from 2015 to 2017. The analysis includes horizontal analysis, vertical analysis, and ratio analysis to evaluate the companies' financial performance and position, considering the impact of BREXIT. The report also incorporates stock analysis to aid investment decisions. Key financial ratios such as gross profit margin, net margin, return on assets, and others are calculated and compared. The findings suggest that British Airways' performance improved in 2017 and the report recommends that British Airways should acquire American Airways. The report includes balance sheets, income statements, and cash flow statements for both companies, along with detailed ratio calculations and working notes.

FINANCIAL
ANALYSIS
ANALYSIS
Paraphrase This Document
Need a fresh take? Get an instant paraphrase of this document with our AI Paraphraser
Executive Summary
This project report exhibits the analysis of financial performance of British Airways (BA)
and American Airlines (AA) on the basis of their audited annual reports of three years (2015,
2016 and 2017). These companies had the impact of BREXIT on their business in the UK. This
report summarises financial analysis of American Airlines and British airways. Financial
analysis is the process of evaluating businesses, projects, budgets and other finance related
entities to determine performance of business organisations. To analyse financial position and
performance various analysis as horizontal analysis to determine performance of both the airlines
over a period of time. This analysis helps to evaluate own performance and helps to set future by
finding variance in previous goals. Data of two periods are evaluated and performance growth of
organised is calculated. Together with this vertical analysis is also performed. Vertical analysis
reports each amount on a financial statement as a percentage of another item. This analysis helps
to compare income statement and balance sheets of companies that ate in different sizes. As
American Airlines and British airways are both different as per number of operations performed
and vertical analysis helps to make comparison between financial statement of both the
companies. Comparison of absolute amount of finances do not provide right conclusion and
calculation in percentage provides more reliable data to make decision. Stock analysis of
company helps to provide investor and traders to make buying and selling decision. By studying
an evaluating past and current data investors attempts to again profits by making informed
decision. Ratios of the company is a qualitative analysis of information contained in a company’s
financial analysis. It is used to evaluate various aspects of companies operating and financial
performance such as efficiency, liquidity, solvency and profitability. All the analysis of both the
companies helps to calculate financial efficiency of business. By these analyses an informed
decision is taken by internal management of the organisation. Also investor of the company gets
a security that funds invested by them is utilised in efficient manner to generate more profits.
From the findings based on ratio analysis, horizontal analysis and vertical analysis it has been
recommnede that British Airways should acquire American Airways as their performance is
observed to be sound in the year of 2017.
Table of Contents
Executive Summary.........................................................................................................................2
INTRODUCTION...........................................................................................................................4
RATIO ANALYSIS........................................................................................................................6
CASH FLOW RATIOS...............................................................................................................9
CONCLUSION..............................................................................................................................10
REFERENCES..............................................................................................................................11
Appendix........................................................................................................................................12
AA Balance sheet......................................................................................................................12
Income statement of AA............................................................................................................13
Cash flow statement of AA........................................................................................................13
Incomes statement of BA...........................................................................................................14
Balance sheet of BA..................................................................................................................15
Cash flow statement of BA........................................................................................................16
STOCK COMPARISON...........................................................................................................17
Ratio calculation for American Airlines:...................................................................................25
Ratio calculation for British airways.........................................................................................27
Working note for cash flow ratio of AA....................................................................................30
Working note for cash flow ratio of BA....................................................................................31
⊘ This is a preview!⊘
Do you want full access?
Subscribe today to unlock all pages.
Trusted by 1+ million students worldwide
INTRODUCTION
Financial analysis is a tool used by an enterprise to evaluate profitability, performance
and viability of a specific project or business. Financial analysis is a wide term includes financial
key ratios, cash flows, analytical graphs and other measurement ratios and charts. With the help
of results of these tools, user of a financial statement whether internal or external can easily
interpret the typical financial data (Baxter and et. al., 2013). The chosen companies “American
Airlines” and “British Airways” are surviving in same industry but American Airlines being an
American company dealing in USD and British Airways dealing in UK pound. This report
covers analytical comparison about financial performance and position of companies. Apart from
this, specific calculation of ratios has also been done to determine the overall position of the
company.
COMPANY PROFILE
BRITISH AIRWAYS (BA)
BA was created by merging 4 companies in the year 1947. it turned into a private
company in the year 1987 for increasing the scope of privatisation in the UK market. It is the
largest airline in UK in when measured by fleet size, international destinations and international
flights. It flies to more than 200 destinations in 75 countries all over the world and has 40% slots
of Heathrow Airport. It is listed on London Stock Exchange.
AMERICAN AIRLINES INC. (AA)
AA is an American airline company with its headquarter at Fort Worth, Texas. It the
world's largest airline in terms of fleet size, revenue, kilometres flown, number of destinations
served etc. It provides services in domestic as well international destinations with an average of
6700 flights per day in 350 destinations in more than 50 countries. It is founding member of One
world alliance, which is world's third largest alliance. Its securities are traded under NASDAQ
(Brigham and Houston, 2012).
INDEXATION ANALYSIS:
Indexation analysis means evaluation of a particular trading instrument, an investment
sector, or a market as a whole. Stock analysts attempt to determine the future activities of an
instrument, market or sector. It is a method for an investor and traders to make a decision
relating to buying or selling of the company's share.
Stock analysis of the American Airlines Group Inc. (AA):
Paraphrase This Document
Need a fresh take? Get an instant paraphrase of this document with our AI Paraphraser
Current price of the AAL is around $ 32 to 34 with a Bid of 31.8 * 900 and Ask of 31.9 *
1000. Day's Range is $ 29.78 to $ 32.21.
The average price of AAL as per historical data is (40.48 + 44.74 + 36.30 + 38.98 +
38.88) / 5 = $ 41.48 and current price is $ 32.04, current price is lower than the price as per the
historical data, therefore an investor will love to invest in the shares of AAL because current
price is undervalued.
It has a market cap of $ 14.757B and profit earnings ratio of 13.14 and EPS is 2.44 with
current average volume of 9,692,020. The shares are less costly as compare of British Airways
and have better chances of earning as an investor point of view.
Stock analysis of British airways (BA):
In the British airways, there is rise in opening price of stock as compared to previous
closing price. The opening stock price is 346.51 and bid rate is 351.21*800, ask rate is
351.95*800, day's range is 343.00 to 353.47.
The British airways have a share price as per historical share price is £196.58 whereas current
market price is £ 352.61 so it is concluded that present price of the British Airways is higher than
the historical price which means it is presently overvalued. Therefore, investor will never invest
in the shares of British airways and it is costly than the shares of AAL of American airways.
Therefore, investor will always invest in AAL as compare to British airways (Bromiley and et.
al., 2015).
NOTE: Tables are shown in the appendix.
VERTICAL ANALYSIS
This method is used by the companies in financial statement analysis, in which each item
is expressed as a percentage of the base figure. It is used for a single point of time to see the
increase or decrease in the accounts during that period for conducting a comparison of financial
position of two companies (Dunning and Dunning, 2014).
Balance sheet comparison
In terms of Total Asset (TA) of British Airways (BA) is comparatively better than
American Airline Inc. (AA) as the TA of AA in 2016 increased to 20.13% from 20.26% in 2015
and it has reduced to 17.80% in the 2017. Whereas, the change in the total asset of BA is
increasing every year. This comparison shows the BA has more total assets than AA. Further, the
percentage change in current liabilities of BA has been decreasing every year which shows that it
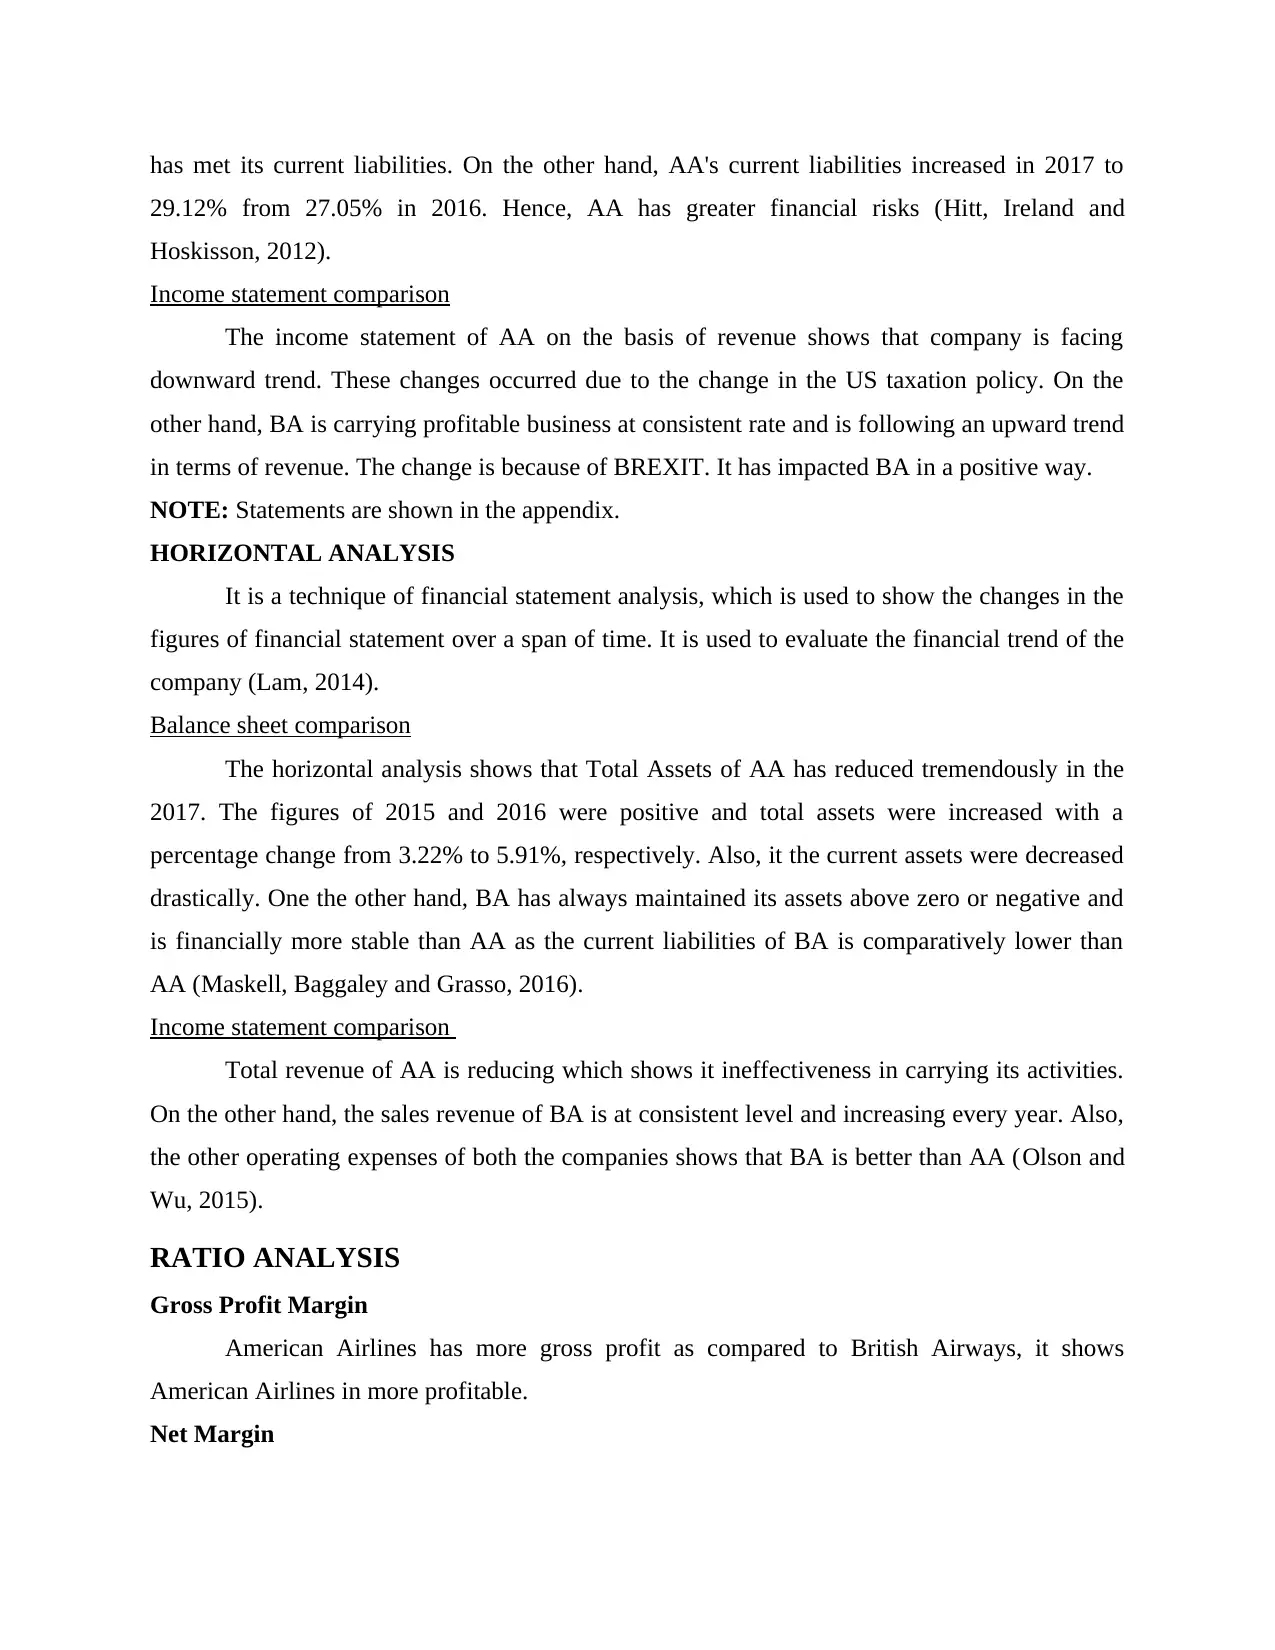
has met its current liabilities. On the other hand, AA's current liabilities increased in 2017 to
29.12% from 27.05% in 2016. Hence, AA has greater financial risks (Hitt, Ireland and
Hoskisson, 2012).
Income statement comparison
The income statement of AA on the basis of revenue shows that company is facing
downward trend. These changes occurred due to the change in the US taxation policy. On the
other hand, BA is carrying profitable business at consistent rate and is following an upward trend
in terms of revenue. The change is because of BREXIT. It has impacted BA in a positive way.
NOTE: Statements are shown in the appendix.
HORIZONTAL ANALYSIS
It is a technique of financial statement analysis, which is used to show the changes in the
figures of financial statement over a span of time. It is used to evaluate the financial trend of the
company (Lam, 2014).
Balance sheet comparison
The horizontal analysis shows that Total Assets of AA has reduced tremendously in the
2017. The figures of 2015 and 2016 were positive and total assets were increased with a
percentage change from 3.22% to 5.91%, respectively. Also, it the current assets were decreased
drastically. One the other hand, BA has always maintained its assets above zero or negative and
is financially more stable than AA as the current liabilities of BA is comparatively lower than
AA (Maskell, Baggaley and Grasso, 2016).
Income statement comparison
Total revenue of AA is reducing which shows it ineffectiveness in carrying its activities.
On the other hand, the sales revenue of BA is at consistent level and increasing every year. Also,
the other operating expenses of both the companies shows that BA is better than AA (Olson and
Wu, 2015).
RATIO ANALYSIS
Gross Profit Margin
American Airlines has more gross profit as compared to British Airways, it shows
American Airlines in more profitable.
Net Margin
⊘ This is a preview!⊘
Do you want full access?
Subscribe today to unlock all pages.
Trusted by 1+ million students worldwide
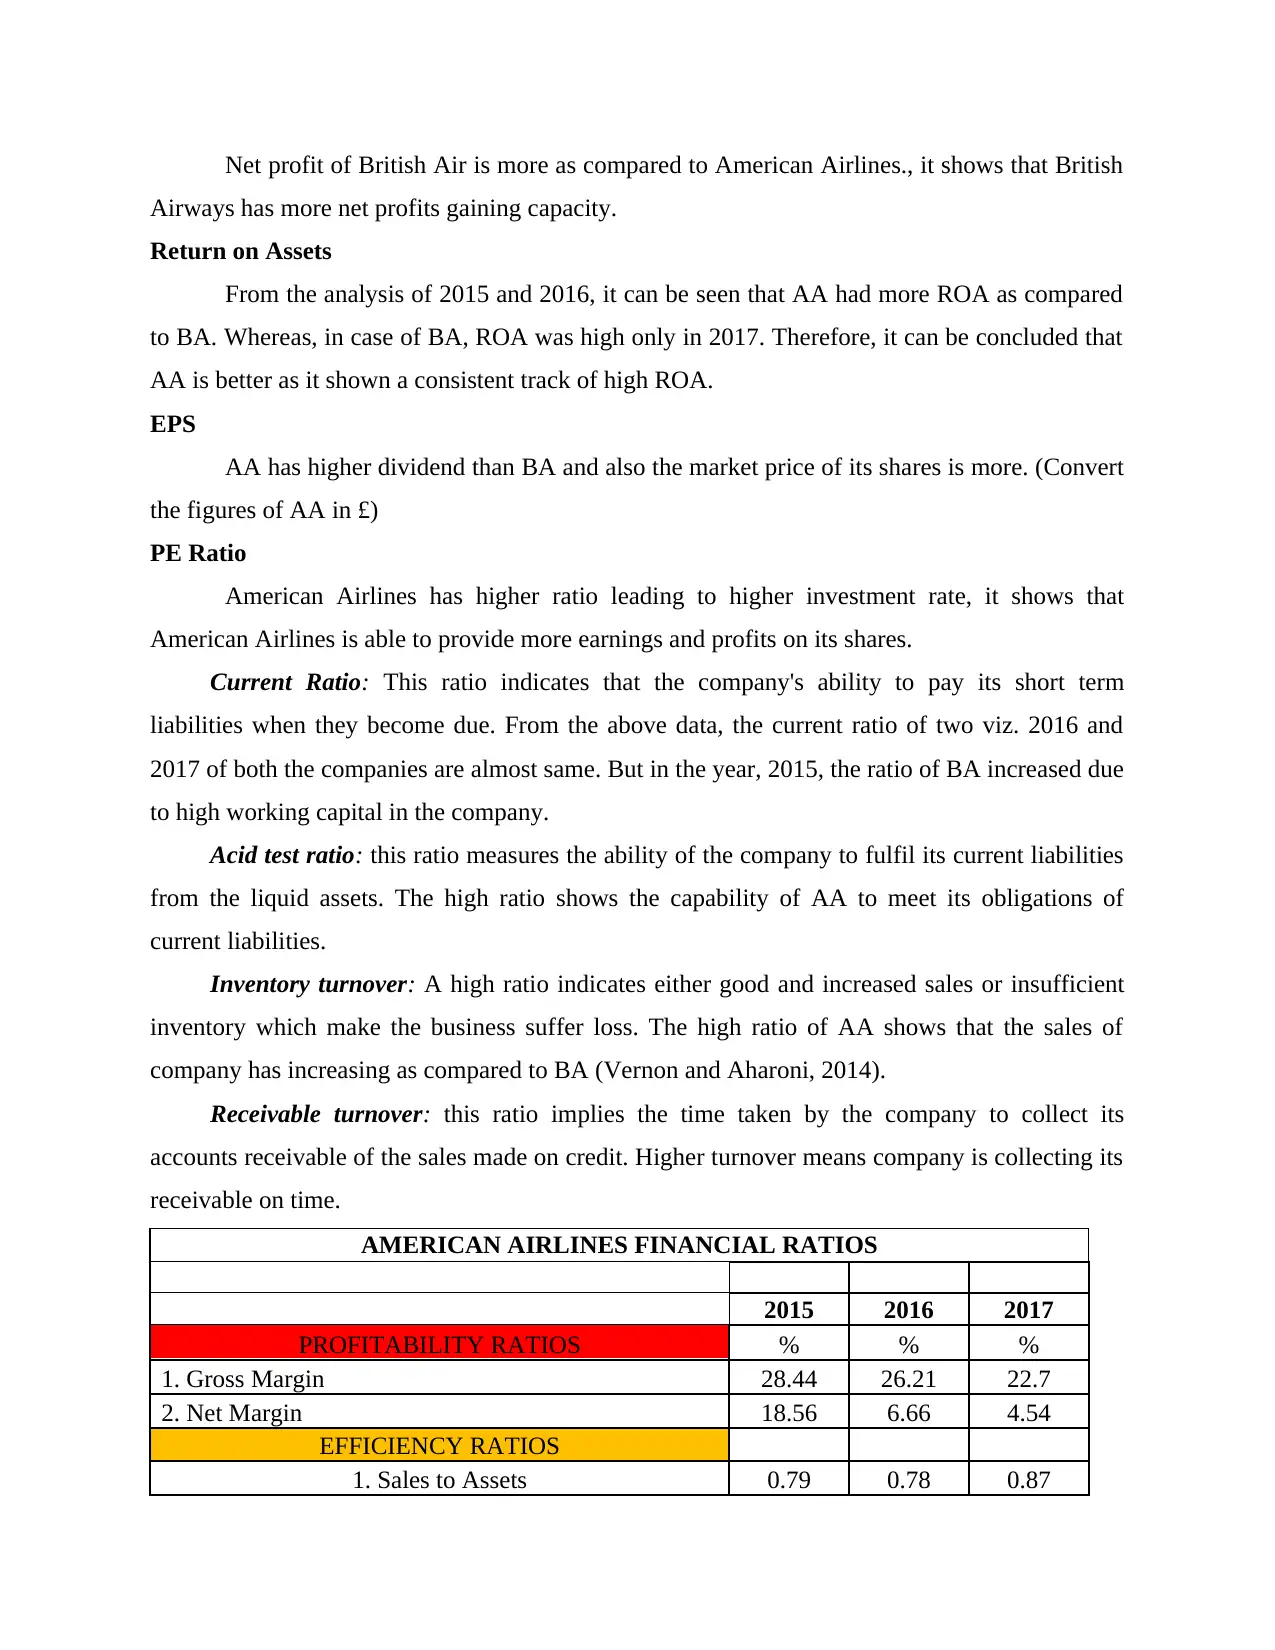
Net profit of British Air is more as compared to American Airlines., it shows that British
Airways has more net profits gaining capacity.
Return on Assets
From the analysis of 2015 and 2016, it can be seen that AA had more ROA as compared
to BA. Whereas, in case of BA, ROA was high only in 2017. Therefore, it can be concluded that
AA is better as it shown a consistent track of high ROA.
EPS
AA has higher dividend than BA and also the market price of its shares is more. (Convert
the figures of AA in £)
PE Ratio
American Airlines has higher ratio leading to higher investment rate, it shows that
American Airlines is able to provide more earnings and profits on its shares.
Current Ratio: This ratio indicates that the company's ability to pay its short term
liabilities when they become due. From the above data, the current ratio of two viz. 2016 and
2017 of both the companies are almost same. But in the year, 2015, the ratio of BA increased due
to high working capital in the company.
Acid test ratio: this ratio measures the ability of the company to fulfil its current liabilities
from the liquid assets. The high ratio shows the capability of AA to meet its obligations of
current liabilities.
Inventory turnover: A high ratio indicates either good and increased sales or insufficient
inventory which make the business suffer loss. The high ratio of AA shows that the sales of
company has increasing as compared to BA (Vernon and Aharoni, 2014).
Receivable turnover: this ratio implies the time taken by the company to collect its
accounts receivable of the sales made on credit. Higher turnover means company is collecting its
receivable on time.
AMERICAN AIRLINES FINANCIAL RATIOS
2015 2016 2017
PROFITABILITY RATIOS % % %
1. Gross Margin 28.44 26.21 22.7
2. Net Margin 18.56 6.66 4.54
EFFICIENCY RATIOS
1. Sales to Assets 0.79 0.78 0.87
Paraphrase This Document
Need a fresh take? Get an instant paraphrase of this document with our AI Paraphraser
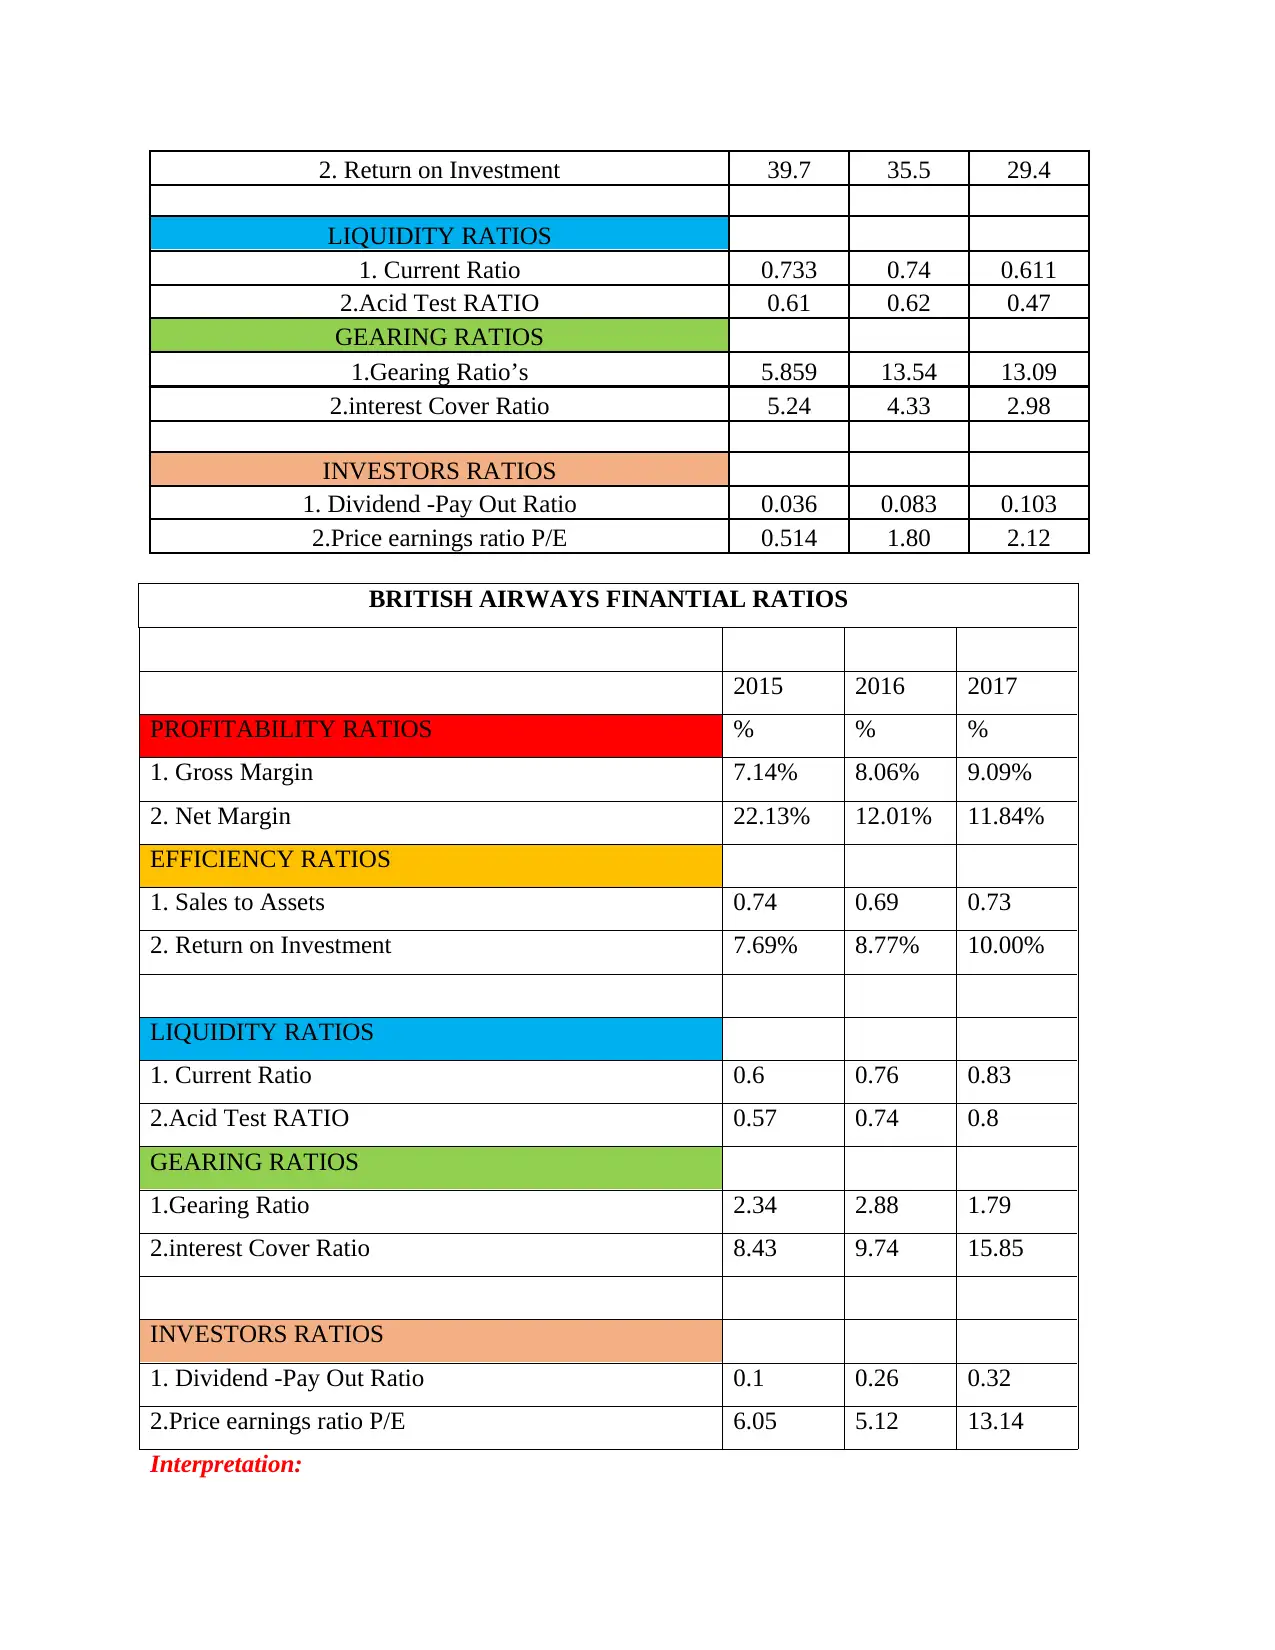
2. Return on Investment 39.7 35.5 29.4
LIQUIDITY RATIOS
1. Current Ratio 0.733 0.74 0.611
2.Acid Test RATIO 0.61 0.62 0.47
GEARING RATIOS
1.Gearing Ratio’s 5.859 13.54 13.09
2.interest Cover Ratio 5.24 4.33 2.98
INVESTORS RATIOS
1. Dividend -Pay Out Ratio 0.036 0.083 0.103
2.Price earnings ratio P/E 0.514 1.80 2.12
BRITISH AIRWAYS FINANTIAL RATIOS
2015 2016 2017
PROFITABILITY RATIOS % % %
1. Gross Margin 7.14% 8.06% 9.09%
2. Net Margin 22.13% 12.01% 11.84%
EFFICIENCY RATIOS
1. Sales to Assets 0.74 0.69 0.73
2. Return on Investment 7.69% 8.77% 10.00%
LIQUIDITY RATIOS
1. Current Ratio 0.6 0.76 0.83
2.Acid Test RATIO 0.57 0.74 0.8
GEARING RATIOS
1.Gearing Ratio 2.34 2.88 1.79
2.interest Cover Ratio 8.43 9.74 15.85
INVESTORS RATIOS
1. Dividend -Pay Out Ratio 0.1 0.26 0.32
2.Price earnings ratio P/E 6.05 5.12 13.14
Interpretation:
LIQUIDITY RATIOS
1. Current Ratio 0.733 0.74 0.611
2.Acid Test RATIO 0.61 0.62 0.47
GEARING RATIOS
1.Gearing Ratio’s 5.859 13.54 13.09
2.interest Cover Ratio 5.24 4.33 2.98
INVESTORS RATIOS
1. Dividend -Pay Out Ratio 0.036 0.083 0.103
2.Price earnings ratio P/E 0.514 1.80 2.12
BRITISH AIRWAYS FINANTIAL RATIOS
2015 2016 2017
PROFITABILITY RATIOS % % %
1. Gross Margin 7.14% 8.06% 9.09%
2. Net Margin 22.13% 12.01% 11.84%
EFFICIENCY RATIOS
1. Sales to Assets 0.74 0.69 0.73
2. Return on Investment 7.69% 8.77% 10.00%
LIQUIDITY RATIOS
1. Current Ratio 0.6 0.76 0.83
2.Acid Test RATIO 0.57 0.74 0.8
GEARING RATIOS
1.Gearing Ratio 2.34 2.88 1.79
2.interest Cover Ratio 8.43 9.74 15.85
INVESTORS RATIOS
1. Dividend -Pay Out Ratio 0.1 0.26 0.32
2.Price earnings ratio P/E 6.05 5.12 13.14
Interpretation:
From the above calculation it has been analysed that British Airways is more financially
strong as compare to American Airways. Net profit margin ratios are very high of British
Airways that shows that profitability of the company is good and American Airline's profitability
is very low. Current and acid test ratios of AA are comparatively low from BA. Interest coverage
ratio of British Airways are very high as compare to AA which means that it is receiving
continuous returns on its investments. Dividend pay-out and Price earnings ratios of BA are very
high and it is recommended to the company to take over American Airline. It will also be
beneficial for AA as it can overcome from all its losses and debts.
Dividend pay-out ratios of British Airways for three years are 0.10, 0.26 and 0.32 and for
AA these are 0.036, 0.083 and 0.103. Price earnings ratio of American Airline are 0.514, 1.80
and 2.12 for year 2015, 2016 and 2017 respectively and for the same period ratios of BA are
6.05, 5.12 and 13.14. Net margin ratios of BA for three years are 22.13, 12.01 and 11.84 for
American Airlines net margin ratios are 18.56, 6.66 and 4.54. All of them depicts that Financial
condition of British Airways is very good hence it should acquire AA.
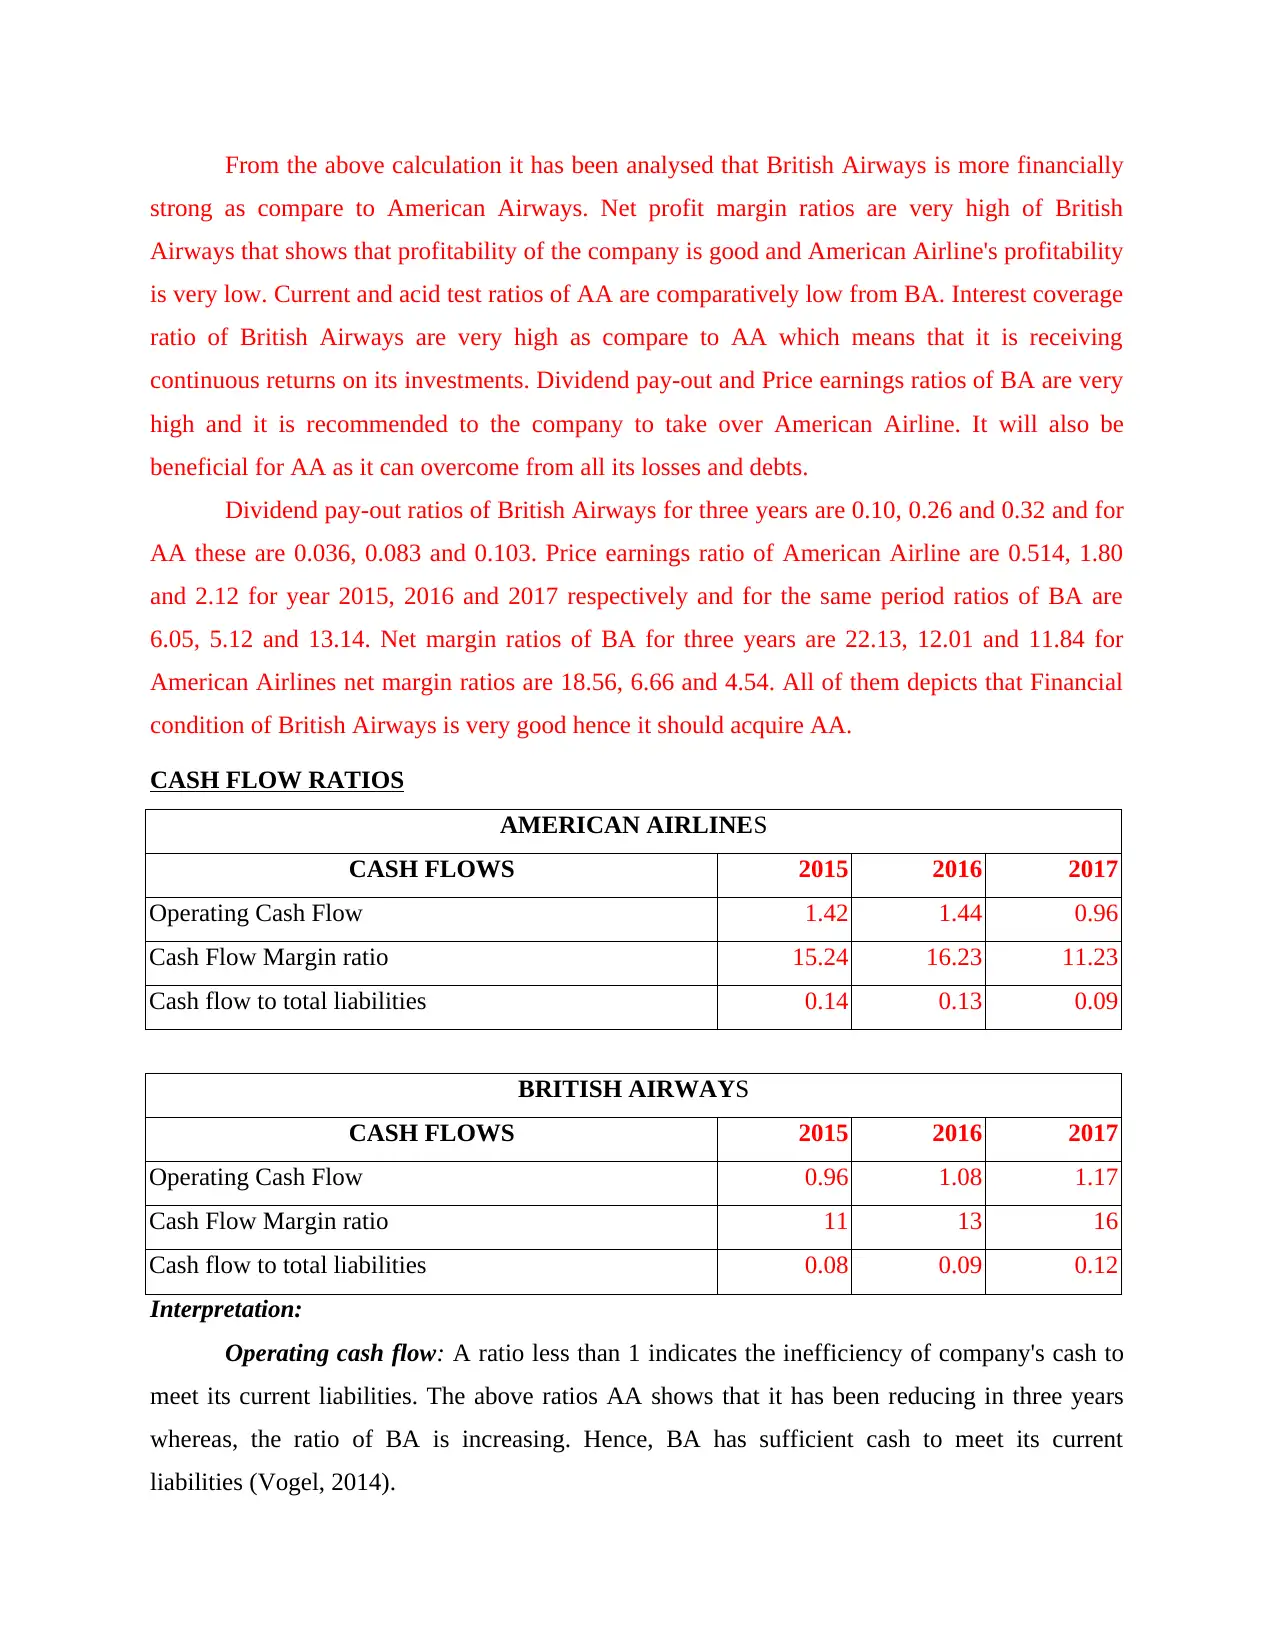
CASH FLOW RATIOS
AMERICAN AIRLINES
CASH FLOWS 2015 2016 2017
Operating Cash Flow 1.42 1.44 0.96
Cash Flow Margin ratio 15.24 16.23 11.23
Cash flow to total liabilities 0.14 0.13 0.09
BRITISH AIRWAYS
CASH FLOWS 2015 2016 2017
Operating Cash Flow 0.96 1.08 1.17
Cash Flow Margin ratio 11 13 16
Cash flow to total liabilities 0.08 0.09 0.12
Interpretation:
Operating cash flow: A ratio less than 1 indicates the inefficiency of company's cash to
meet its current liabilities. The above ratios AA shows that it has been reducing in three years
whereas, the ratio of BA is increasing. Hence, BA has sufficient cash to meet its current
liabilities (Vogel, 2014).
strong as compare to American Airways. Net profit margin ratios are very high of British
Airways that shows that profitability of the company is good and American Airline's profitability
is very low. Current and acid test ratios of AA are comparatively low from BA. Interest coverage
ratio of British Airways are very high as compare to AA which means that it is receiving
continuous returns on its investments. Dividend pay-out and Price earnings ratios of BA are very
high and it is recommended to the company to take over American Airline. It will also be
beneficial for AA as it can overcome from all its losses and debts.
Dividend pay-out ratios of British Airways for three years are 0.10, 0.26 and 0.32 and for
AA these are 0.036, 0.083 and 0.103. Price earnings ratio of American Airline are 0.514, 1.80
and 2.12 for year 2015, 2016 and 2017 respectively and for the same period ratios of BA are
6.05, 5.12 and 13.14. Net margin ratios of BA for three years are 22.13, 12.01 and 11.84 for
American Airlines net margin ratios are 18.56, 6.66 and 4.54. All of them depicts that Financial
condition of British Airways is very good hence it should acquire AA.
CASH FLOW RATIOS
AMERICAN AIRLINES
CASH FLOWS 2015 2016 2017
Operating Cash Flow 1.42 1.44 0.96
Cash Flow Margin ratio 15.24 16.23 11.23
Cash flow to total liabilities 0.14 0.13 0.09
BRITISH AIRWAYS
CASH FLOWS 2015 2016 2017
Operating Cash Flow 0.96 1.08 1.17
Cash Flow Margin ratio 11 13 16
Cash flow to total liabilities 0.08 0.09 0.12
Interpretation:
Operating cash flow: A ratio less than 1 indicates the inefficiency of company's cash to
meet its current liabilities. The above ratios AA shows that it has been reducing in three years
whereas, the ratio of BA is increasing. Hence, BA has sufficient cash to meet its current
liabilities (Vogel, 2014).
⊘ This is a preview!⊘
Do you want full access?
Subscribe today to unlock all pages.
Trusted by 1+ million students worldwide
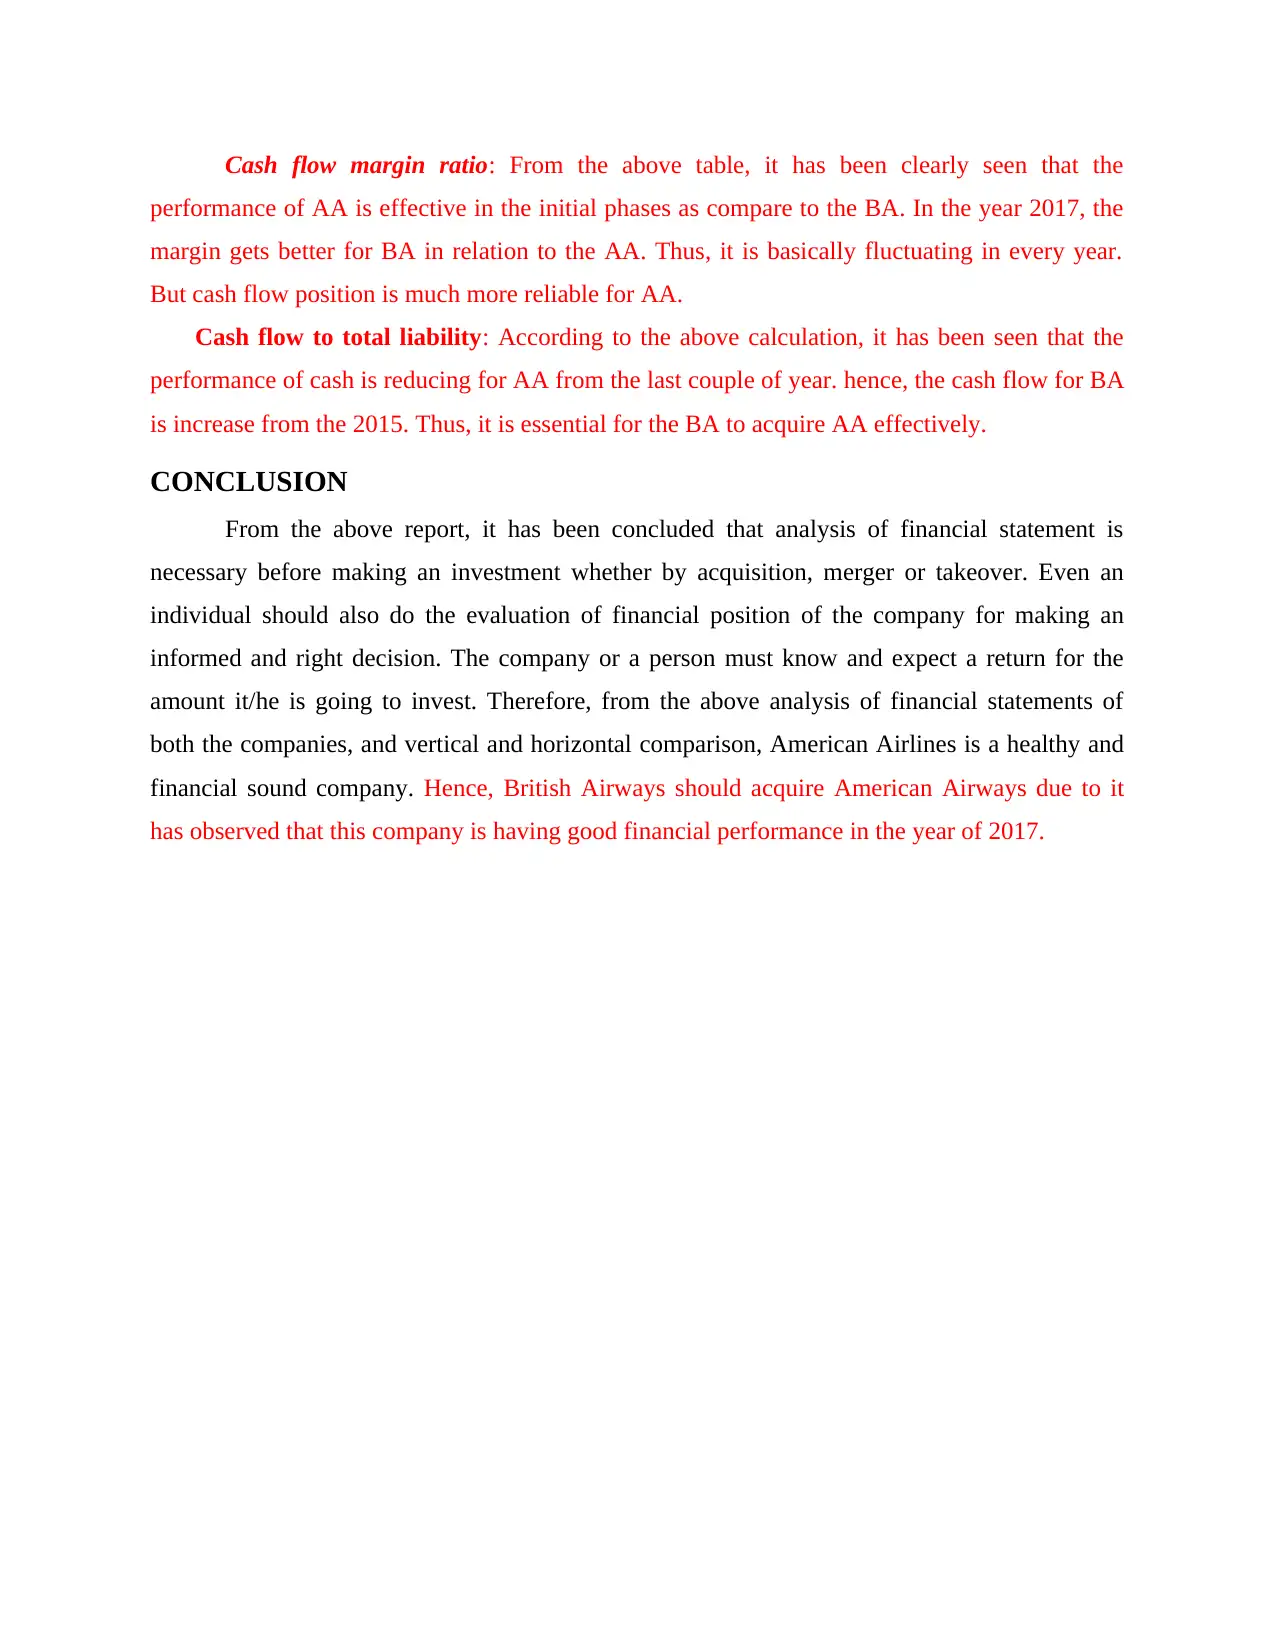
Cash flow margin ratio: From the above table, it has been clearly seen that the
performance of AA is effective in the initial phases as compare to the BA. In the year 2017, the
margin gets better for BA in relation to the AA. Thus, it is basically fluctuating in every year.
But cash flow position is much more reliable for AA.
Cash flow to total liability: According to the above calculation, it has been seen that the
performance of cash is reducing for AA from the last couple of year. hence, the cash flow for BA
is increase from the 2015. Thus, it is essential for the BA to acquire AA effectively.
CONCLUSION
From the above report, it has been concluded that analysis of financial statement is
necessary before making an investment whether by acquisition, merger or takeover. Even an
individual should also do the evaluation of financial position of the company for making an
informed and right decision. The company or a person must know and expect a return for the
amount it/he is going to invest. Therefore, from the above analysis of financial statements of
both the companies, and vertical and horizontal comparison, American Airlines is a healthy and
financial sound company. Hence, British Airways should acquire American Airways due to it
has observed that this company is having good financial performance in the year of 2017.
Paraphrase This Document
Need a fresh take? Get an instant paraphrase of this document with our AI Paraphraser
REFERENCES
Books and Journals:
Baxter, R. and et. al., 2013. Enterprise risk management program quality: Determinants, value
relevance, and the financial crisis. Contemporary Accounting Research. 30(4). pp.1264-
1295.
Brigham, E. F. and Houston, J. F., 2012. Fundamentals of financial management. Cengage
Learning.
Bromiley, P. and et. al., 2015. Enterprise risk management: Review, critique, and research
directions. Long range planning. 48(4). pp.265-276.
Dunning, J. H. and Dunning, J. H., 2014. Economic analysis and multinational enterprise.
Routledge.
Hitt, M. A., Ireland, R. D. and Hoskisson, R. E., 2012. Strategic management cases:
competitiveness and globalization. Cengage Learning.
Lam, J., 2014. Enterprise risk management: from incentives to controls. John Wiley & Sons.
Maskell, B. H., Baggaley, B. and Grasso, L., 2016. Practical lean accounting: a proven system
for measuring and managing the lean enterprise. Productivity Press.
Olson, D. L. and Wu, D. D., 2015. Enterprise risk management (Vol. 3). World Scientific
Publishing Company.
Quon, T. K., Zeghal, D. and Maingot, M., 2012. Enterprise risk management and firm
performance. Procedia-Social and Behavioral Sciences. 62. pp.263-267.
Vernon, R. and Aharoni, Y., 2014. State-Owned Enterprise in the Western Economies
(Routledge Revivals). Routledge.
Vogel, H. L., 2014. Entertainment industry economics: A guide for financial analysis.
Cambridge University Press.
Online
Annual Report of American Airlines. 2018.[Online]. Available through: <Airlines.
<http://quicktake.morningstar.com/stocknet/secdocuments.aspx?symbol=aal>
Annual Report of British Airways. 2018.[Online]. Available through: <Airlines.
http://file:///home/user/Downloads/IMR%20BA%20Report%20and%20Accounts
%202017%20-%20FINAL%20v2.pdf.
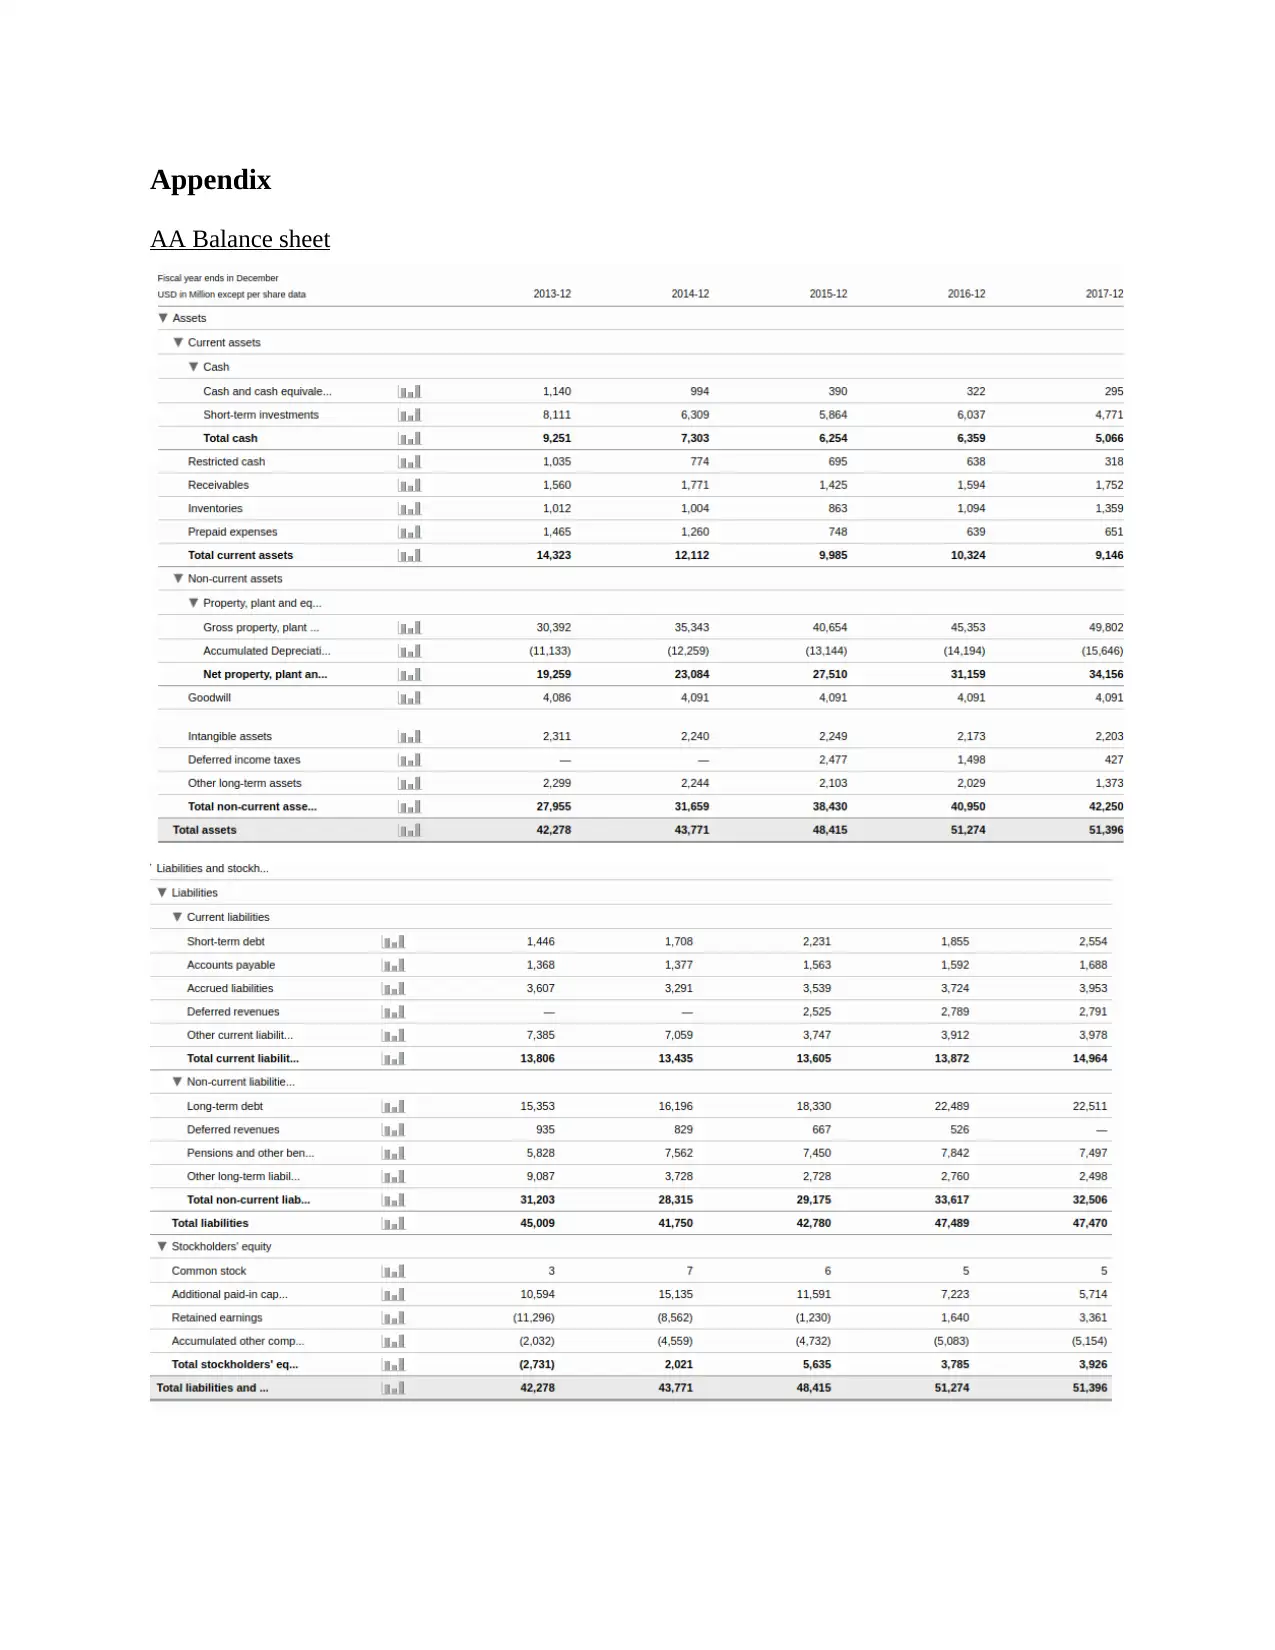
Appendix
AA Balance sheet
AA Balance sheet
⊘ This is a preview!⊘
Do you want full access?
Subscribe today to unlock all pages.
Trusted by 1+ million students worldwide
1 out of 28
Related Documents


Your All-in-One AI-Powered Toolkit for Academic Success.
+13062052269
info@desklib.com
Available 24*7 on WhatsApp / Email
![[object Object]](/_next/static/media/star-bottom.7253800d.svg)
Unlock your academic potential
Copyright © 2020–2026 A2Z Services. All Rights Reserved. Developed and managed by ZUCOL.