Evaluating Financial Performance: GlaxoSmithKline, Shire, Astrazeneca
VerifiedAdded on 2023/06/13

Accounting and Finance for Managers
Name of the Student:
Name of the University:
Author’s Note:
Course ID:
Paraphrase This Document
Table of Contents
Question 1:.........................................................................................................................2
Answer to Part (a):.........................................................................................................2
Answer to Part (b):.......................................................................................................12
Answer to Part (c):.......................................................................................................14
Question 2:.......................................................................................................................14
Answer to Part (a):.......................................................................................................15
Answer to Part (b):.......................................................................................................16
References:......................................................................................................................19
Appendices:.....................................................................................................................22
Question 1:
The current section aims to evaluate the financial performance of the three top
pharmaceutical organisations in UK for which the financial ratios and non-financial ratios
are taken into consideration. These three organisations comprise of GlaxoSmithKline
Plc, Shire Plc and Astrazeneca Plc.
Answer to Part (a):
For evaluating the financial position and performance of the three selected
organisations, the following ratios are taken into consideration:
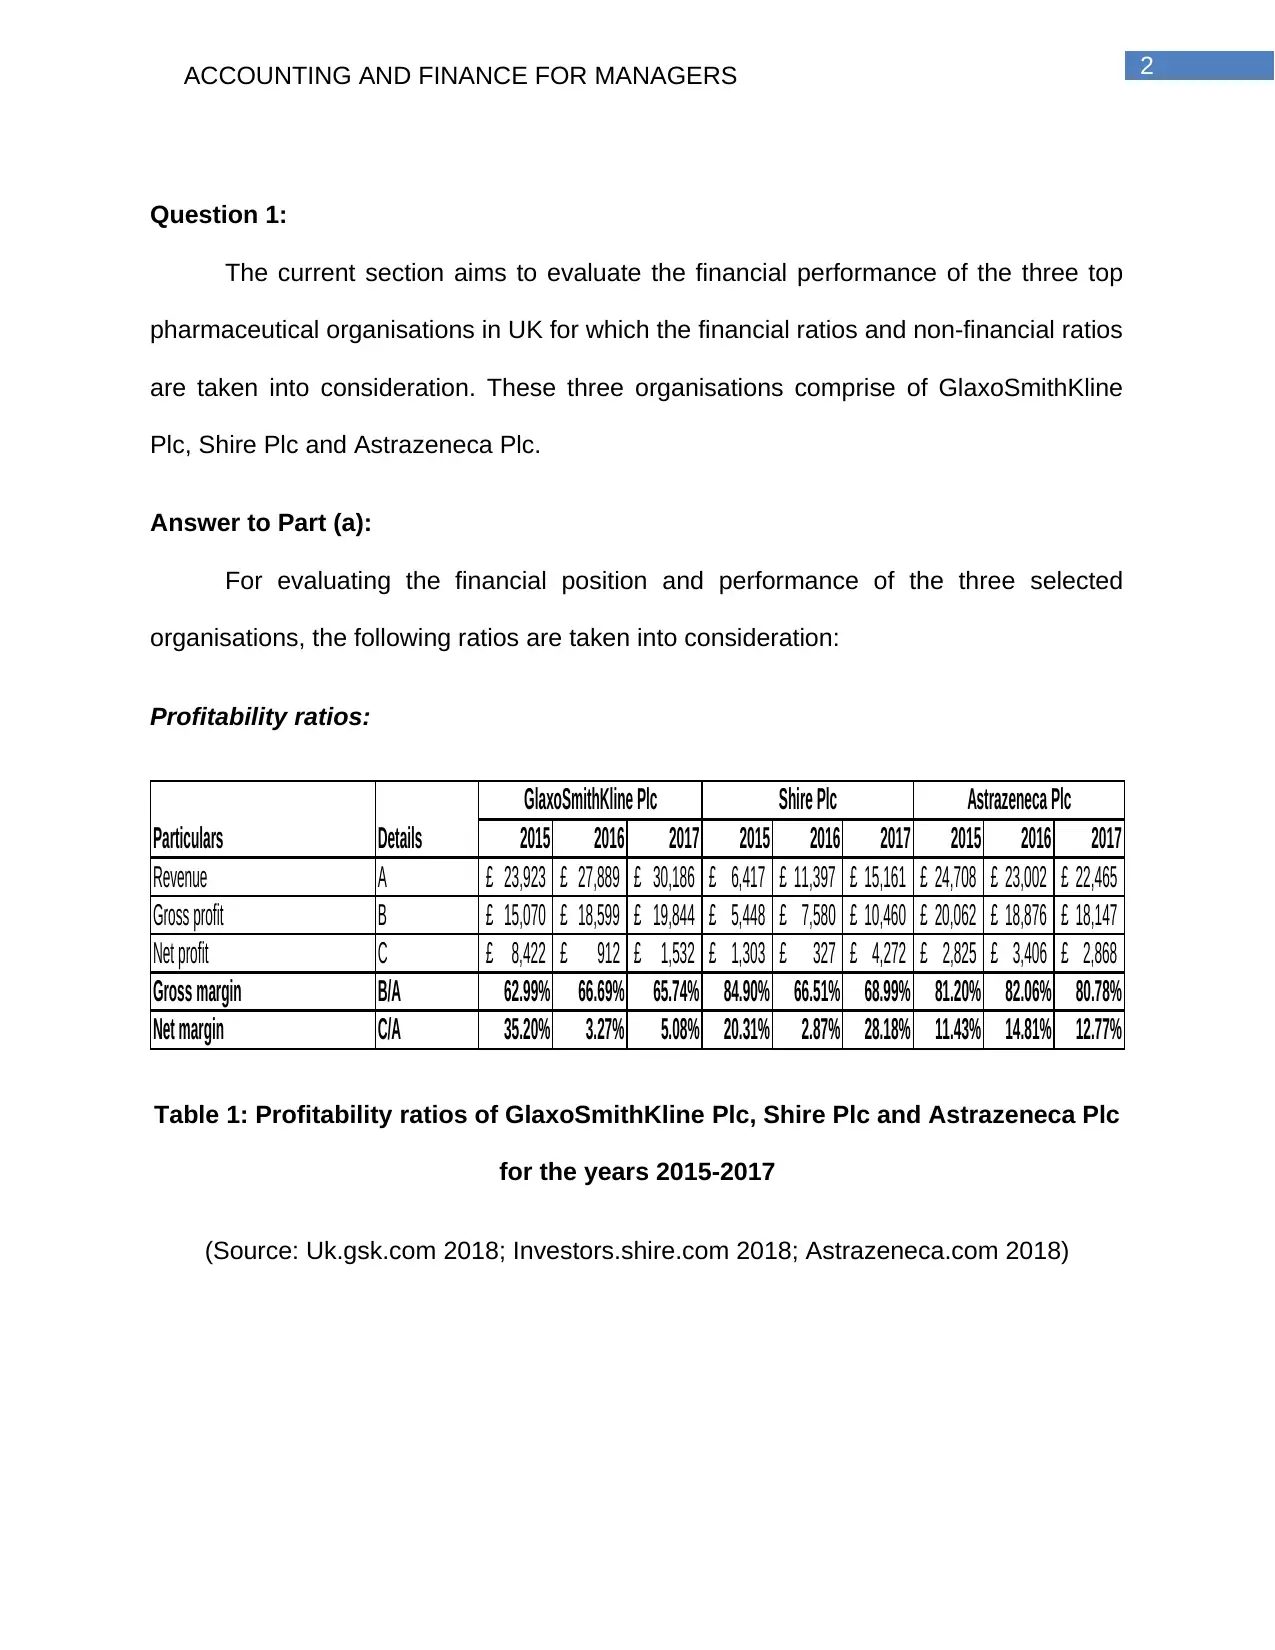
Profitability ratios:
2015 2016 2017 2015 2016 2017 2015 2016 2017
Revenue A 23,923£ 27,889£ 30,186£ 6,417£ 11,397£ 15,161£ 24,708£ 23,002£ 22,465£
Gross profit B 15,070£ 18,599£ 19,844£ 5,448£ 7,580£ 10,460£ 20,062£ 18,876£ 18,147£
Net profit C 8,422£ 912£ 1,532£ 1,303£ 327£ 4,272£ 2,825£ 3,406£ 2,868£
Gross margin B/A 62.99% 66.69% 65.74% 84.90% 66.51% 68.99% 81.20% 82.06% 80.78%
Net margin C/A 35.20% 3.27% 5.08% 20.31% 2.87% 28.18% 11.43% 14.81% 12.77%
GlaxoSmithKline Plc Shire Plc Astrazeneca Plc
Particulars Details
Table 1: Profitability ratios of GlaxoSmithKline Plc, Shire Plc and Astrazeneca Plc
for the years 2015-2017
(Source: Uk.gsk.com 2018; Investors.shire.com 2018; Astrazeneca.com 2018)
⊘ This is a preview!⊘
Do you want full access?
Subscribe today to unlock all pages.
Trusted by 1+ million students worldwide
2015 2016 2017 2015 2016 2017 2015 2016 2017
GlaxoSmithKline
Plc Shire Plc Astrazeneca Plc
0.00%
10.00%
20.00%
30.00%
40.00%
50.00%
60.00%
70.00%
80.00%
90.00%
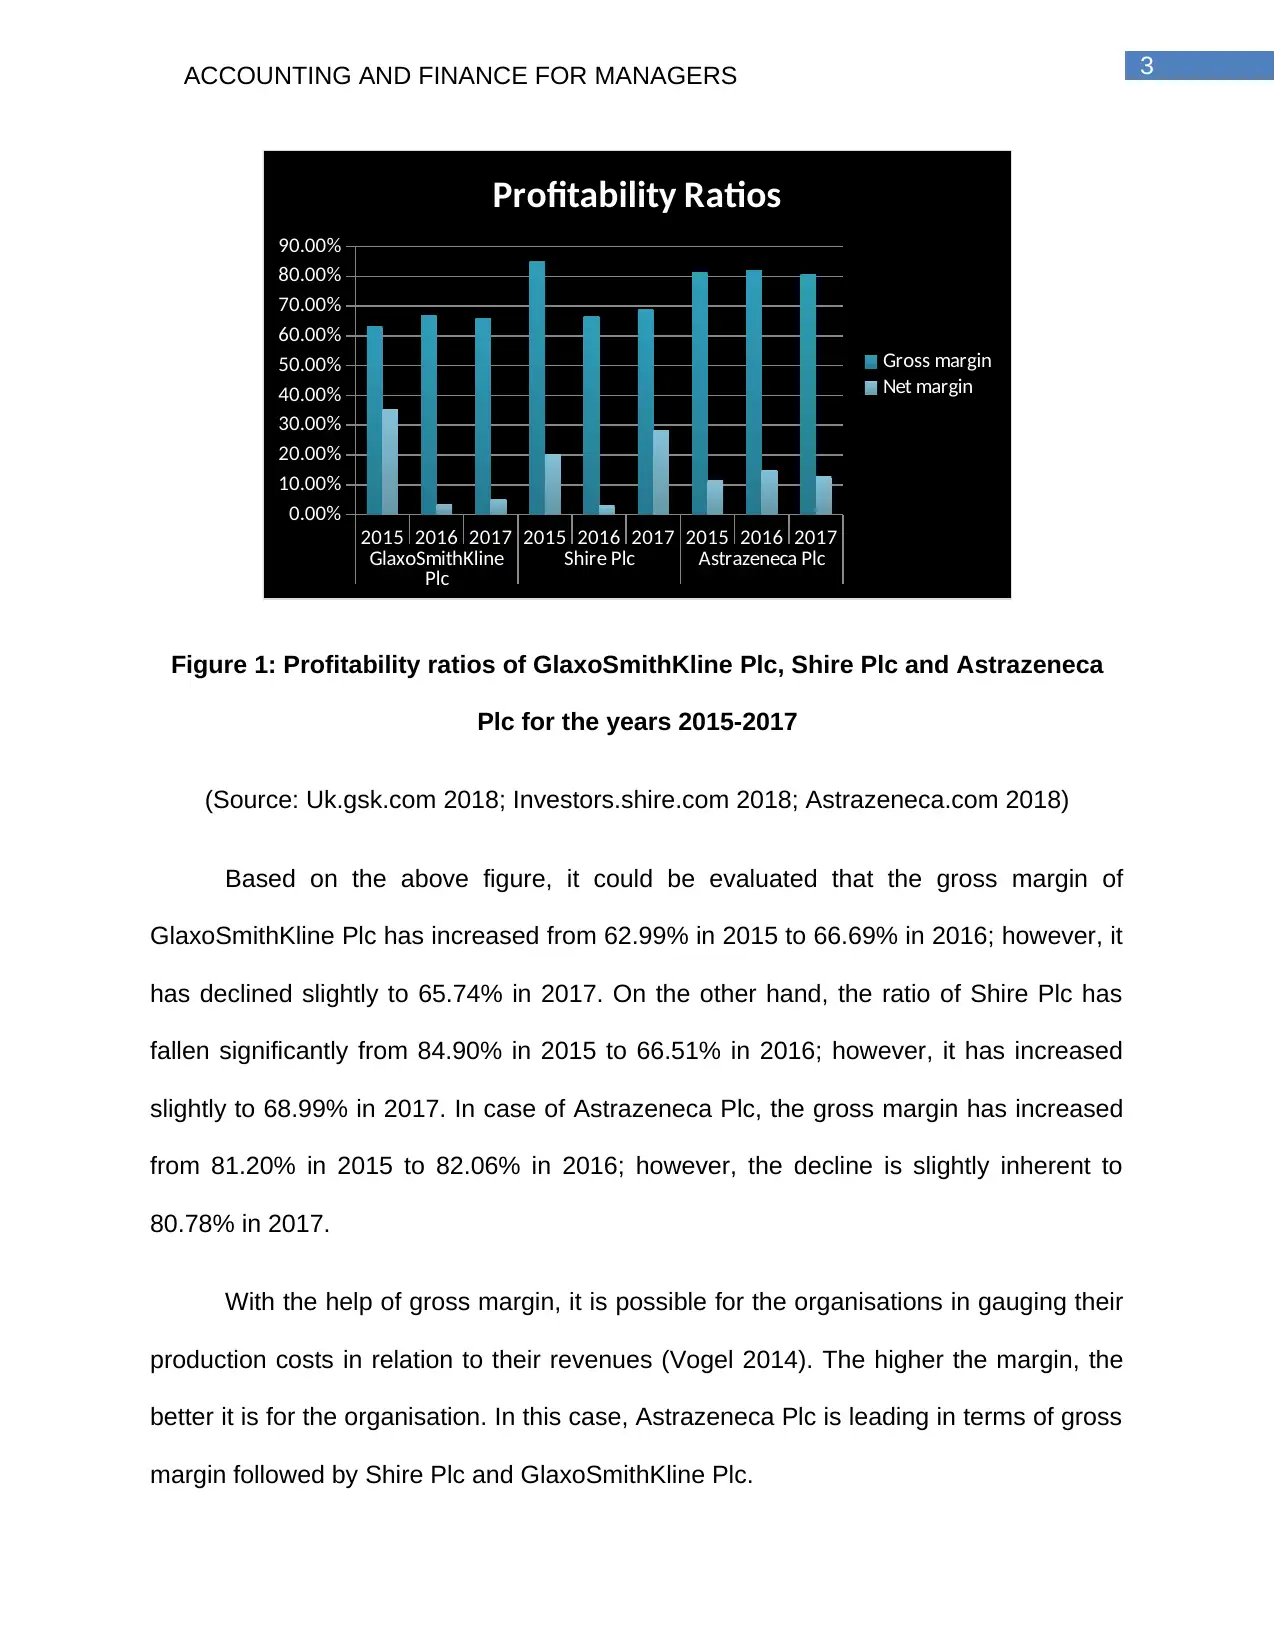
Profitability Ratios
Gross margin
Net margin
Figure 1: Profitability ratios of GlaxoSmithKline Plc, Shire Plc and Astrazeneca
Plc for the years 2015-2017
(Source: Uk.gsk.com 2018; Investors.shire.com 2018; Astrazeneca.com 2018)
Based on the above figure, it could be evaluated that the gross margin of
GlaxoSmithKline Plc has increased from 62.99% in 2015 to 66.69% in 2016; however, it
has declined slightly to 65.74% in 2017. On the other hand, the ratio of Shire Plc has
fallen significantly from 84.90% in 2015 to 66.51% in 2016; however, it has increased
slightly to 68.99% in 2017. In case of Astrazeneca Plc, the gross margin has increased
from 81.20% in 2015 to 82.06% in 2016; however, the decline is slightly inherent to
80.78% in 2017.
With the help of gross margin, it is possible for the organisations in gauging their
production costs in relation to their revenues (Vogel 2014). The higher the margin, the
better it is for the organisation. In this case, Astrazeneca Plc is leading in terms of gross
margin followed by Shire Plc and GlaxoSmithKline Plc.
Paraphrase This Document
The net margin of GlaxoSmithKline Plc has fallen drastically to 3.27% in 2016
from 35.20% in 2015; however, it has increased to 5.08% in 2017. The trend is similar in
case of Shire Plc as well; however, the only exception is Astrazeneca Plc, as its net
margin has increased in 2016 compared to the previous year and it has declined in
2017. Net margin is the income that an organisation makes after it has incurred all
expenses and taxes (Warren and Jones 2018). In terms of net margin, Shire Plc is the
leading organisation, since its net margin has increased massively in 2017.
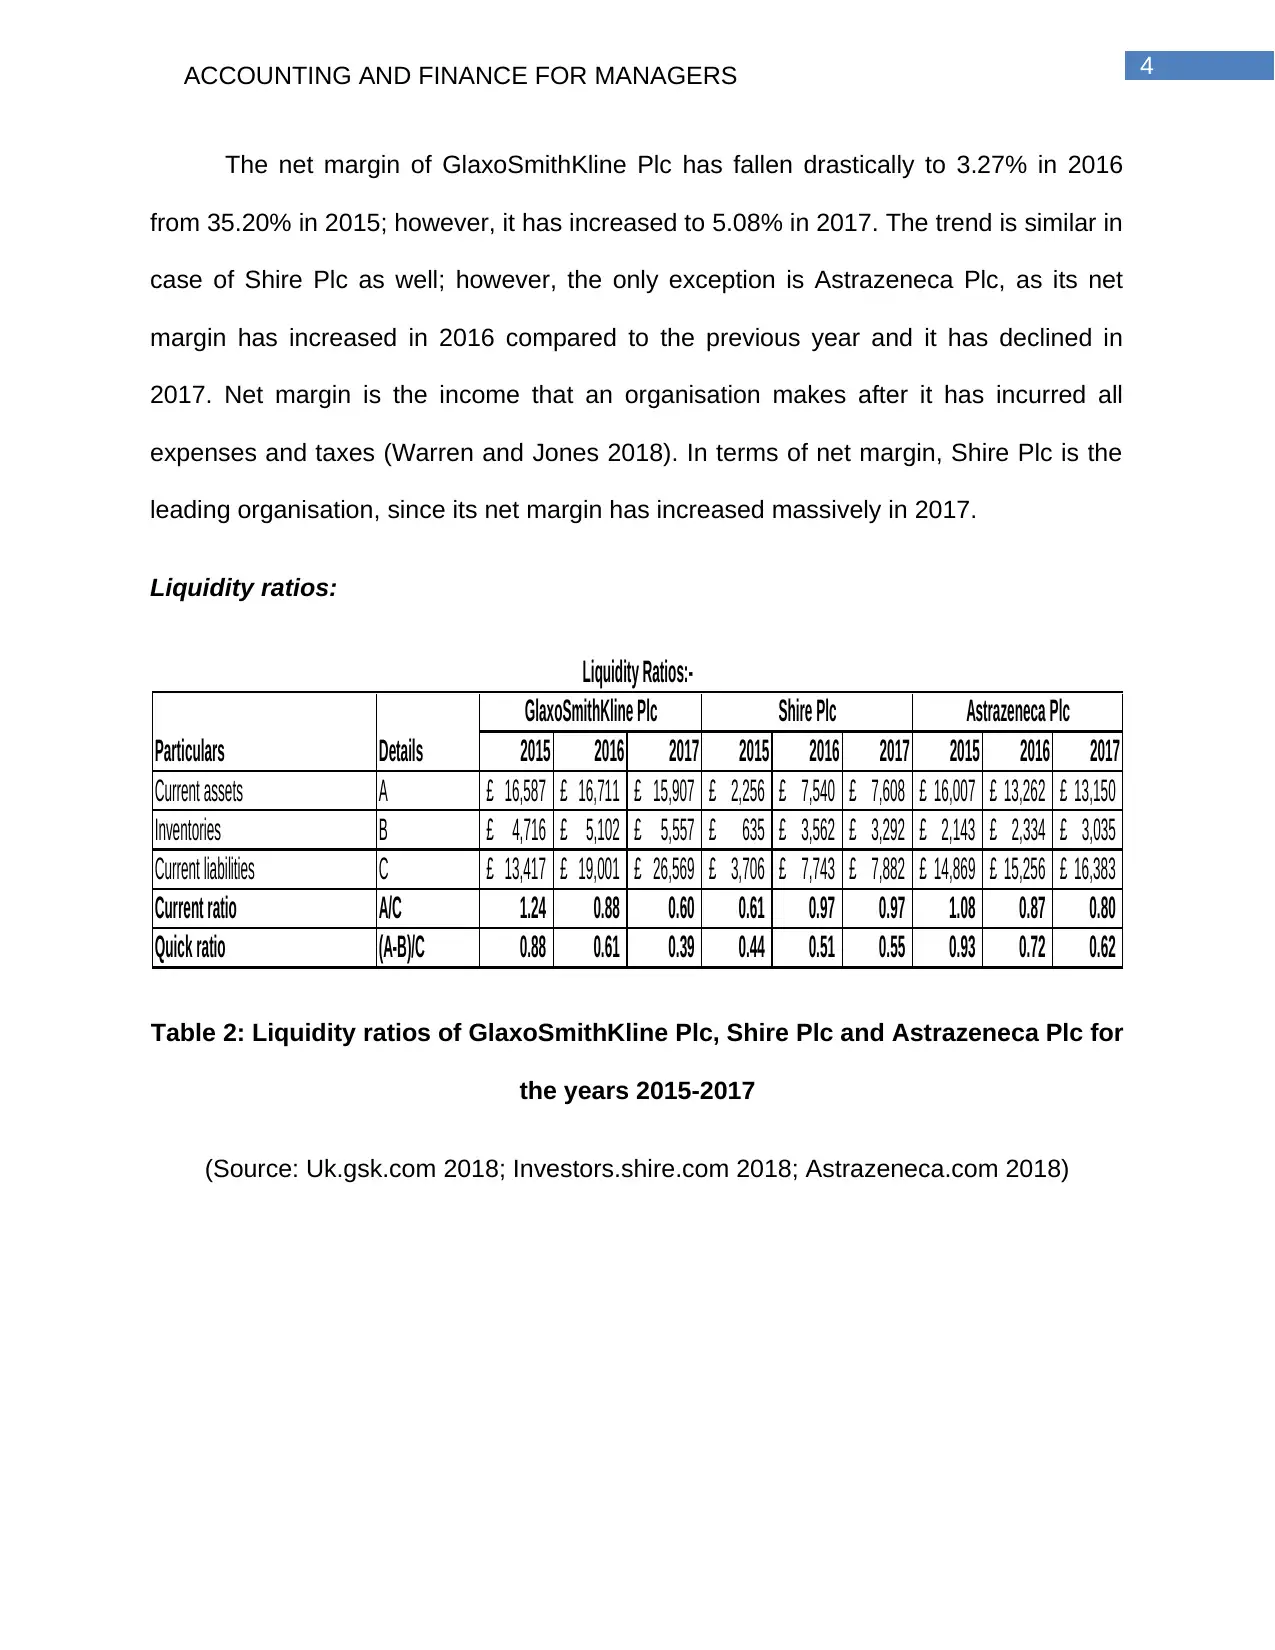
Liquidity ratios:
2015 2016 2017 2015 2016 2017 2015 2016 2017
Current assets A 16,587£ 16,711£ 15,907£ 2,256£ 7,540£ 7,608£ 16,007£ 13,262£ 13,150£
Inventories B 4,716£ 5,102£ 5,557£ 635£ 3,562£ 3,292£ 2,143£ 2,334£ 3,035£
Current liabilities C 13,417£ 19,001£ 26,569£ 3,706£ 7,743£ 7,882£ 14,869£ 15,256£ 16,383£
Current ratio A/C 1.24 0.88 0.60 0.61 0.97 0.97 1.08 0.87 0.80
Quick ratio (A-B)/C 0.88 0.61 0.39 0.44 0.51 0.55 0.93 0.72 0.62
Liquidity Ratios:-
Particulars Details
GlaxoSmithKline Plc Shire Plc Astrazeneca Plc
Table 2: Liquidity ratios of GlaxoSmithKline Plc, Shire Plc and Astrazeneca Plc for
the years 2015-2017
(Source: Uk.gsk.com 2018; Investors.shire.com 2018; Astrazeneca.com 2018)
2015 2016 2017 2015 2016 2017 2015 2016 2017
GlaxoSmithKline
Plc Shire Plc Astrazeneca Plc
-
0.20
0.40
0.60
0.80
1.00
1.20
1.40
Liquidity Ratios
Current ratio
Quick ratio
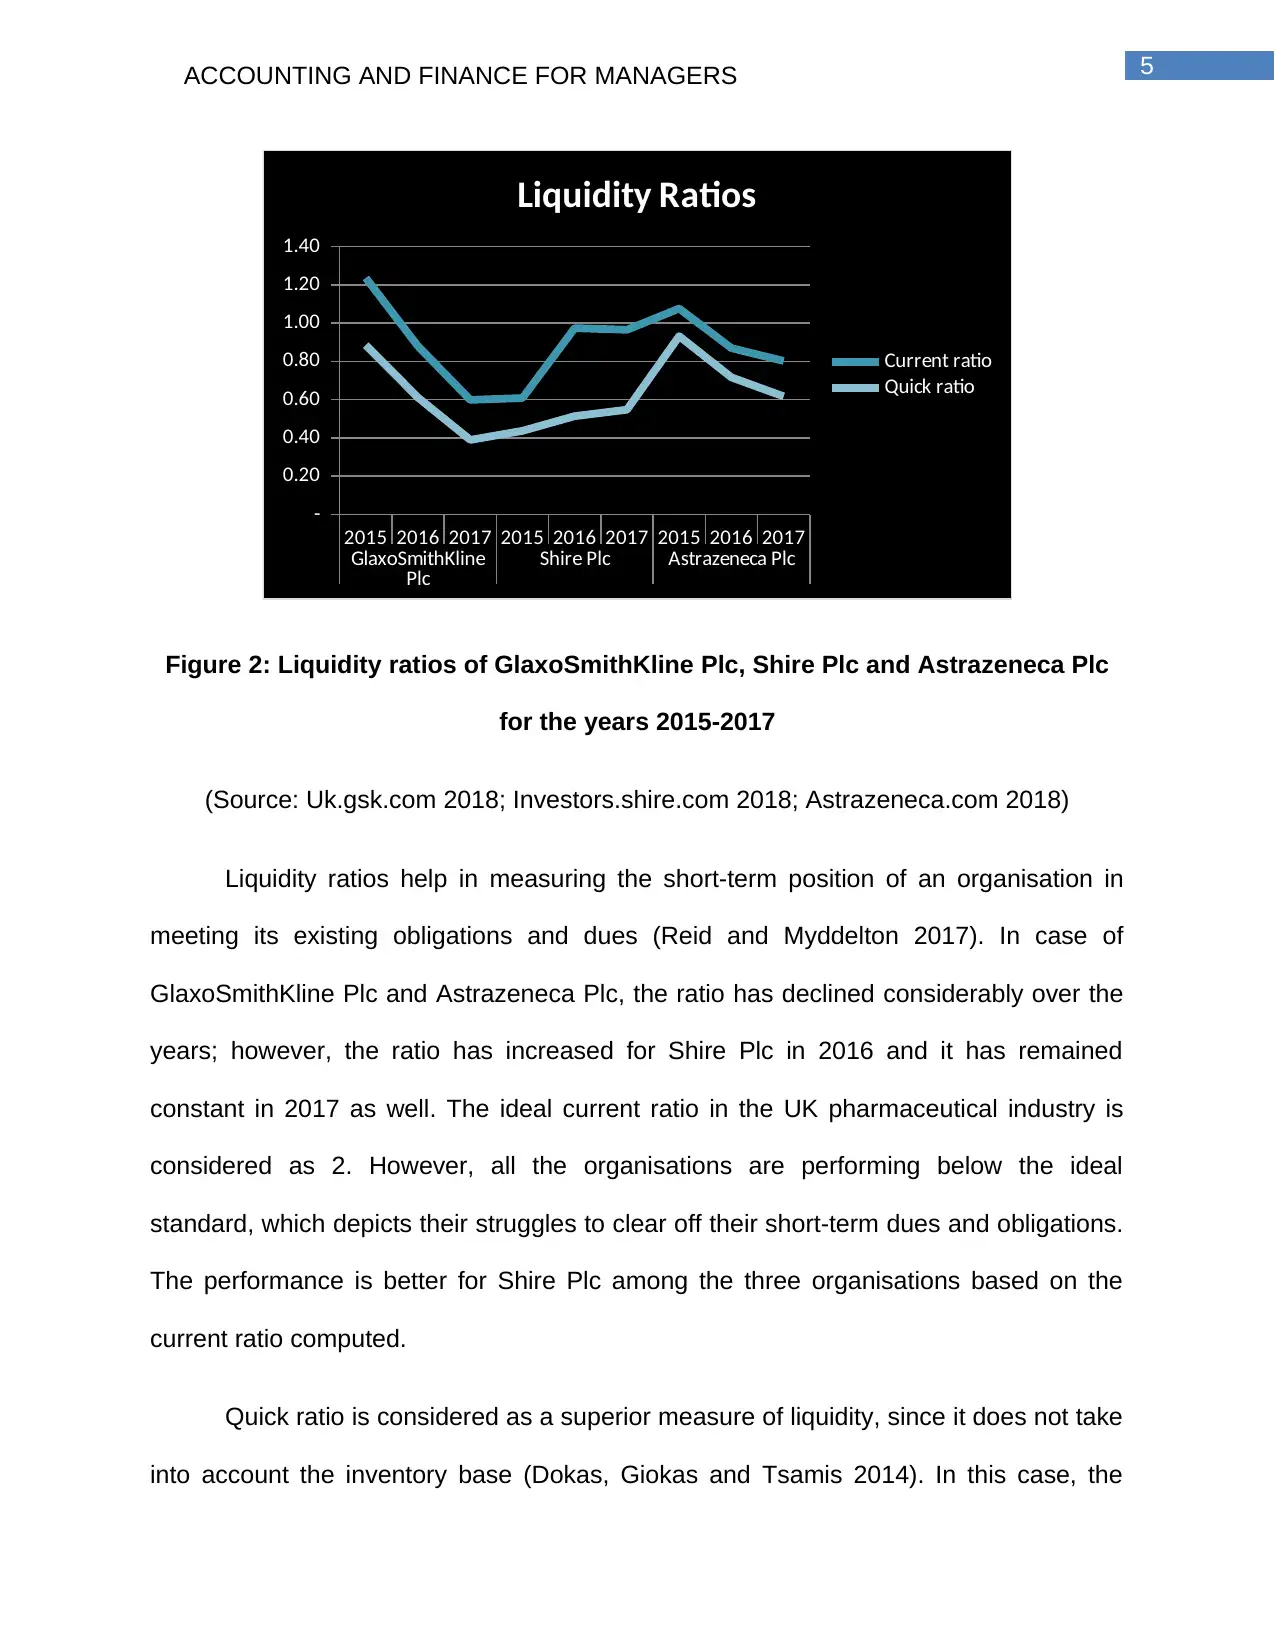
Figure 2: Liquidity ratios of GlaxoSmithKline Plc, Shire Plc and Astrazeneca Plc
for the years 2015-2017
(Source: Uk.gsk.com 2018; Investors.shire.com 2018; Astrazeneca.com 2018)
Liquidity ratios help in measuring the short-term position of an organisation in
meeting its existing obligations and dues (Reid and Myddelton 2017). In case of
GlaxoSmithKline Plc and Astrazeneca Plc, the ratio has declined considerably over the
years; however, the ratio has increased for Shire Plc in 2016 and it has remained
constant in 2017 as well. The ideal current ratio in the UK pharmaceutical industry is
considered as 2. However, all the organisations are performing below the ideal
standard, which depicts their struggles to clear off their short-term dues and obligations.
The performance is better for Shire Plc among the three organisations based on the
current ratio computed.
Quick ratio is considered as a superior measure of liquidity, since it does not take
into account the inventory base (Dokas, Giokas and Tsamis 2014). In this case, the
⊘ This is a preview!⊘
Do you want full access?
Subscribe today to unlock all pages.
Trusted by 1+ million students worldwide
trend is similar for GlaxoSmithKline Plc, as the ratio has declined from 0.88 in 2015 to
0.61 in 2016 and 0.39 in 2017. However, the ratio has increased for Shire Plc from 0.44
in 2015 to 0.51 in 2016 and 0.55 in 2017. Even though the ratio has declined from
Astrazeneca Plc, it is still higher compared to the other two organisations and higher the
ratio, the better is for the organisation. Hence, in terms of liquidity, Astrozeneca Plc is in
a better position in the UK pharmaceutical industry.
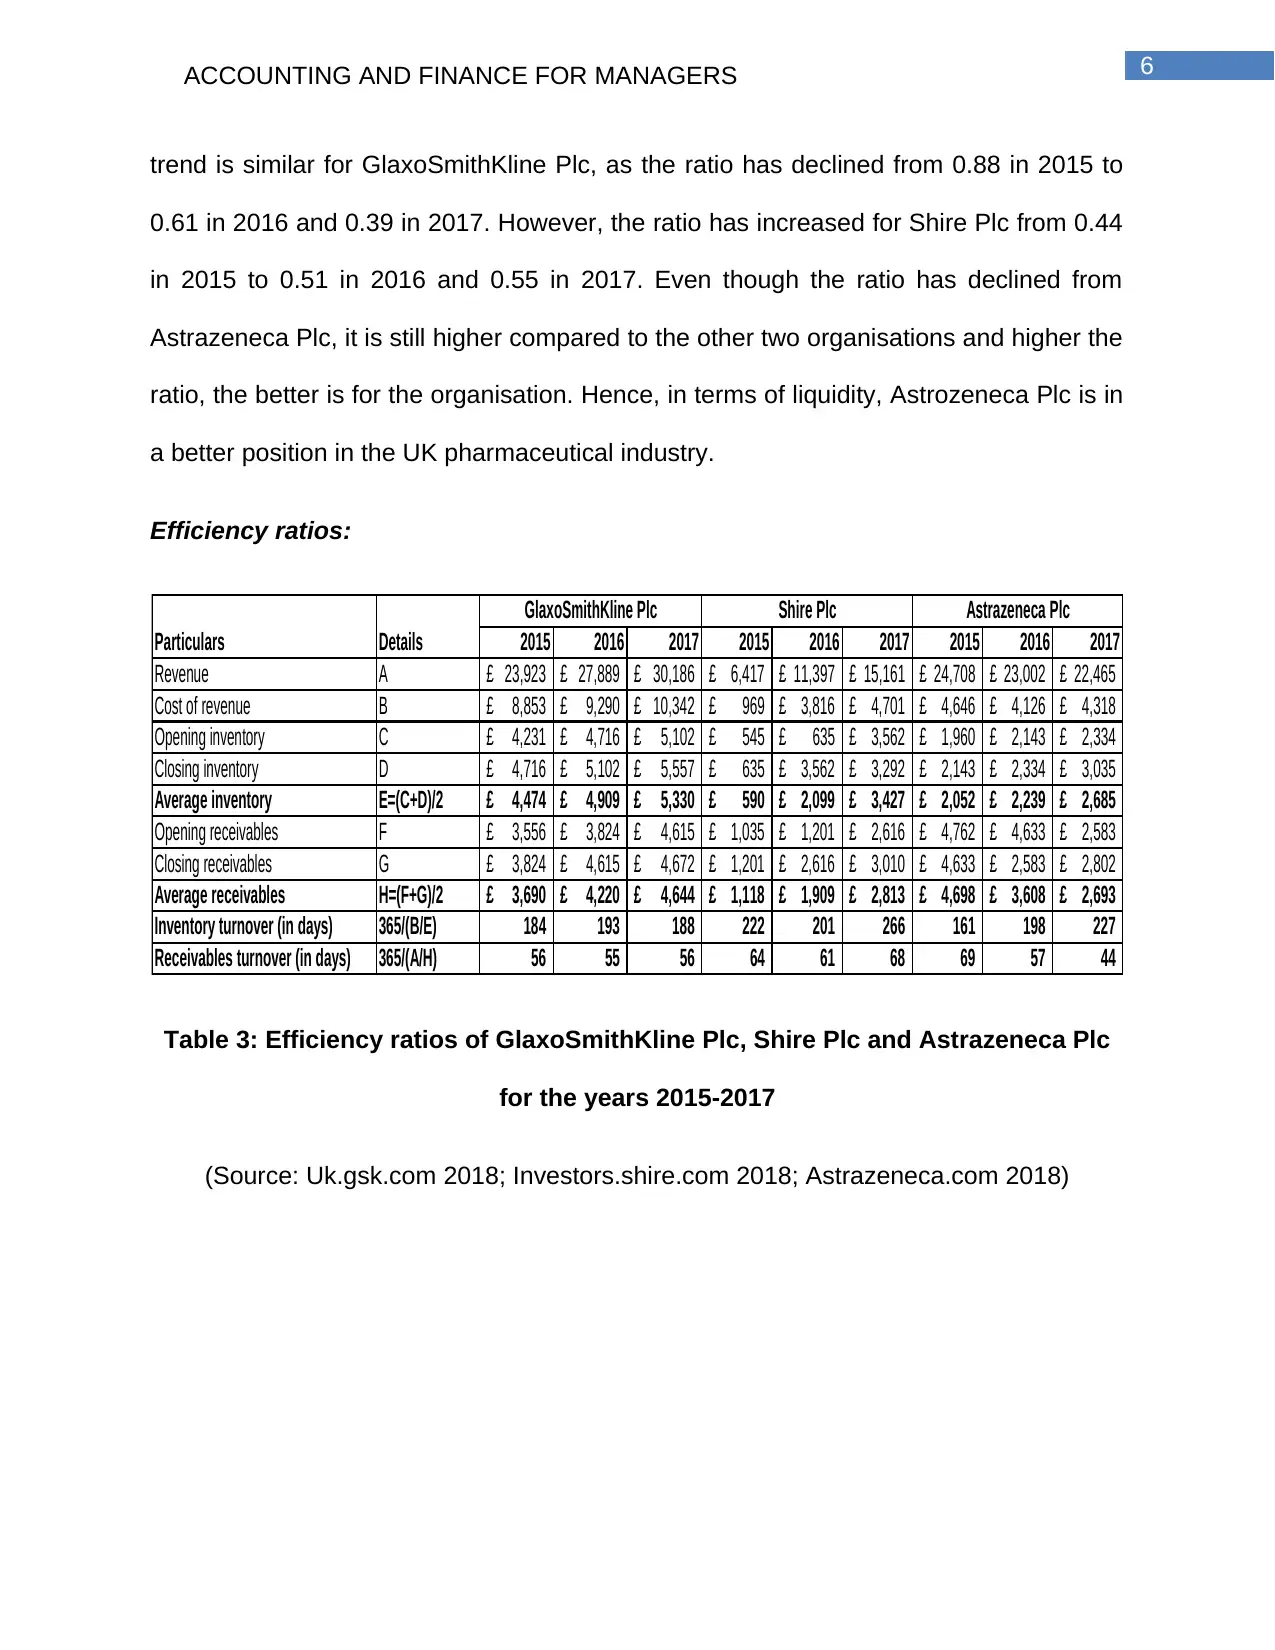
Efficiency ratios:
2015 2016 2017 2015 2016 2017 2015 2016 2017
Revenue A 23,923£ 27,889£ 30,186£ 6,417£ 11,397£ 15,161£ 24,708£ 23,002£ 22,465£
Cost of revenue B 8,853£ 9,290£ 10,342£ 969£ 3,816£ 4,701£ 4,646£ 4,126£ 4,318£
Opening inventory C 4,231£ 4,716£ 5,102£ 545£ 635£ 3,562£ 1,960£ 2,143£ 2,334£
Closing inventory D 4,716£ 5,102£ 5,557£ 635£ 3,562£ 3,292£ 2,143£ 2,334£ 3,035£
Average inventory E=(C+D)/2 4,474£ 4,909£ 5,330£ 590£ 2,099£ 3,427£ 2,052£ 2,239£ 2,685£
Opening receivables F 3,556£ 3,824£ 4,615£ 1,035£ 1,201£ 2,616£ 4,762£ 4,633£ 2,583£
Closing receivables G 3,824£ 4,615£ 4,672£ 1,201£ 2,616£ 3,010£ 4,633£ 2,583£ 2,802£
Average receivables H=(F+G)/2 3,690£ 4,220£ 4,644£ 1,118£ 1,909£ 2,813£ 4,698£ 3,608£ 2,693£
Inventory turnover (in days) 365/(B/E) 184 193 188 222 201 266 161 198 227
Receivables turnover (in days) 365/(A/H) 56 55 56 64 61 68 69 57 44
Particulars Details
GlaxoSmithKline Plc Shire Plc Astrazeneca Plc
Table 3: Efficiency ratios of GlaxoSmithKline Plc, Shire Plc and Astrazeneca Plc
for the years 2015-2017
(Source: Uk.gsk.com 2018; Investors.shire.com 2018; Astrazeneca.com 2018)
Paraphrase This Document
2015
2016
2017
2015
2016
2017
2015
2016
2017
GlaxoSmithKlin
e Plc Shire Plc Astrazeneca Plc
0%
10%
20%
30%
40%
50%
60%
70%
80%
90%
100%
Efficiency Ratios
Receivables turnover (in
days)
Inventory turnover (in
days)
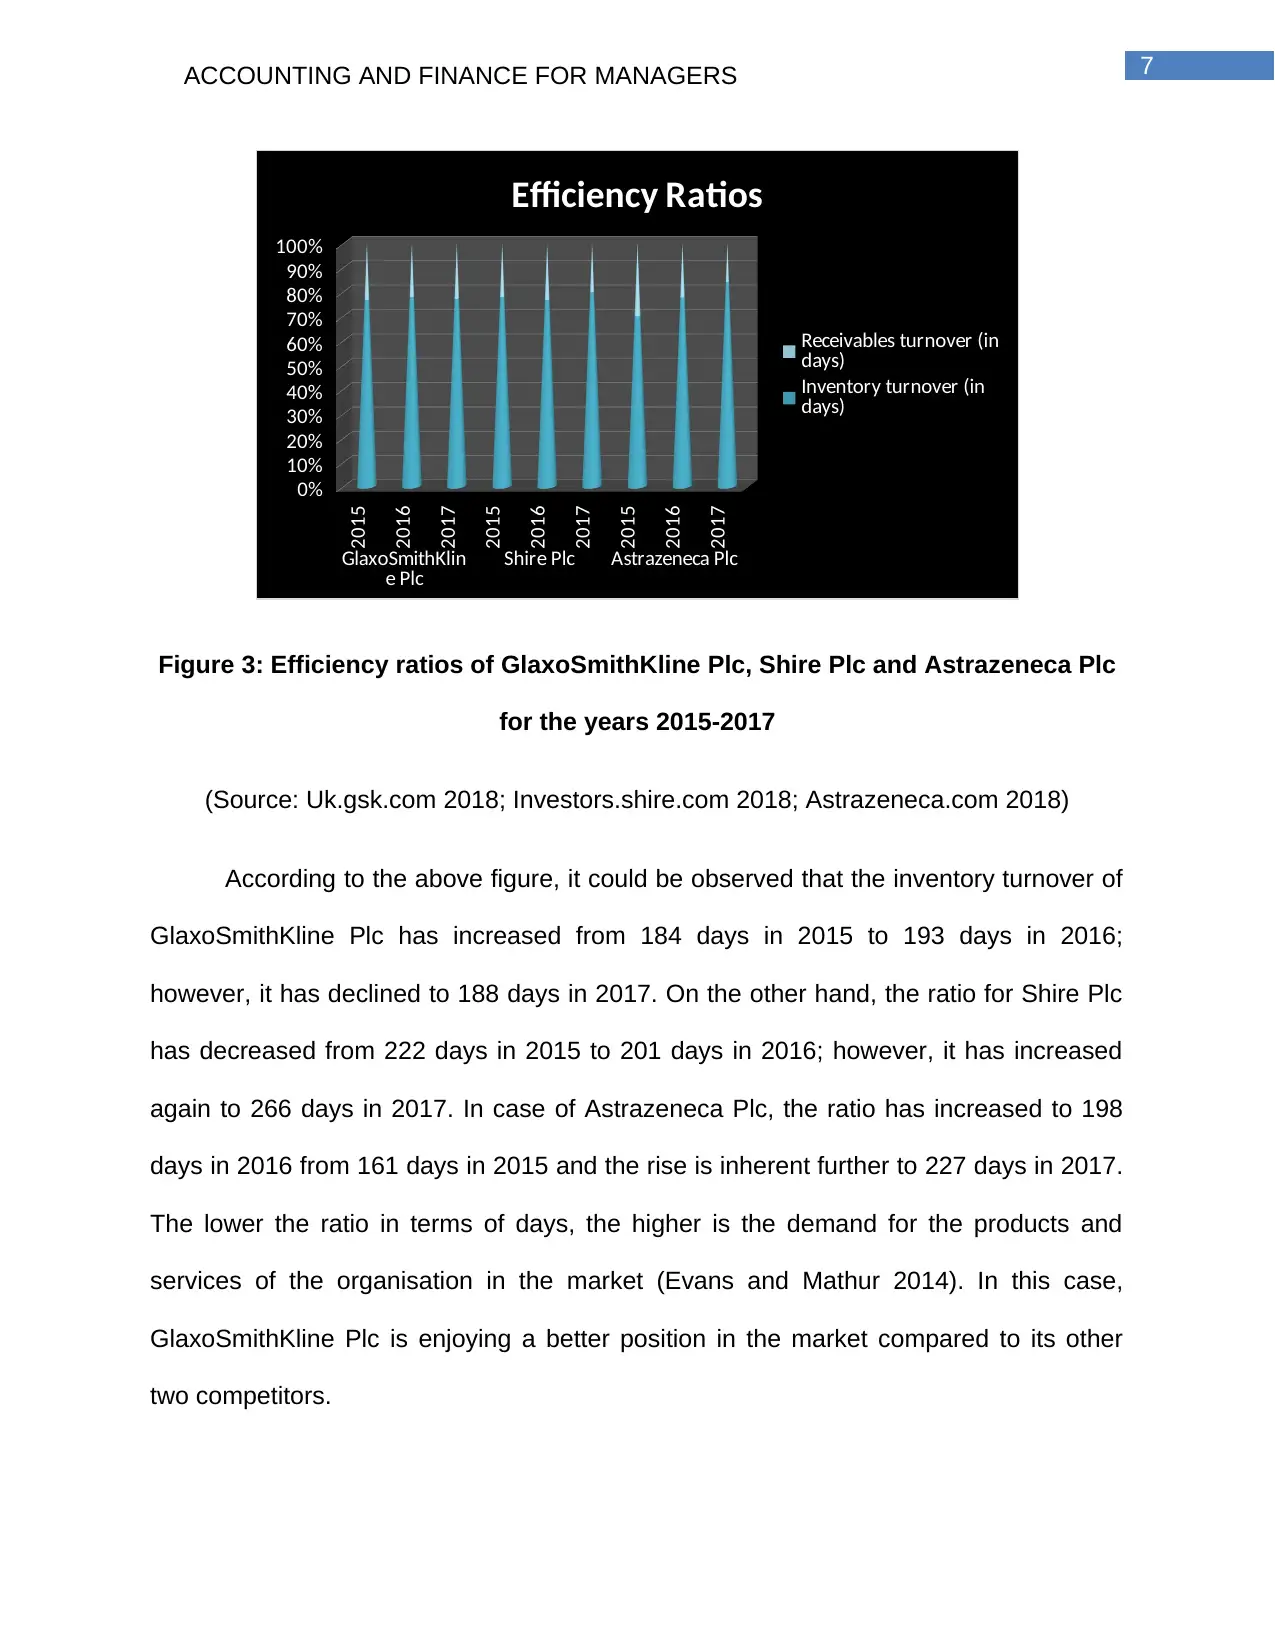
Figure 3: Efficiency ratios of GlaxoSmithKline Plc, Shire Plc and Astrazeneca Plc
for the years 2015-2017
(Source: Uk.gsk.com 2018; Investors.shire.com 2018; Astrazeneca.com 2018)
According to the above figure, it could be observed that the inventory turnover of
GlaxoSmithKline Plc has increased from 184 days in 2015 to 193 days in 2016;
however, it has declined to 188 days in 2017. On the other hand, the ratio for Shire Plc
has decreased from 222 days in 2015 to 201 days in 2016; however, it has increased
again to 266 days in 2017. In case of Astrazeneca Plc, the ratio has increased to 198
days in 2016 from 161 days in 2015 and the rise is inherent further to 227 days in 2017.
The lower the ratio in terms of days, the higher is the demand for the products and
services of the organisation in the market (Evans and Mathur 2014). In this case,
GlaxoSmithKline Plc is enjoying a better position in the market compared to its other
two competitors.
Receivables turnover denotes the time, in which an organisation collects its dues
from the customers for the products and services rendered at a past date (Almamy,
Aston and Ngwa 2016). The lower the ratio, the better it is for the organisation in
collecting cash from its customers to increase its working capital. In this case, the ratio
is lower for GlaxoSmithKline Plc and hence, in terms of efficiency, it could be inferred
that the organisation is enjoying competitive supremacy over the other two
organisations in the UK pharmaceutical industry.
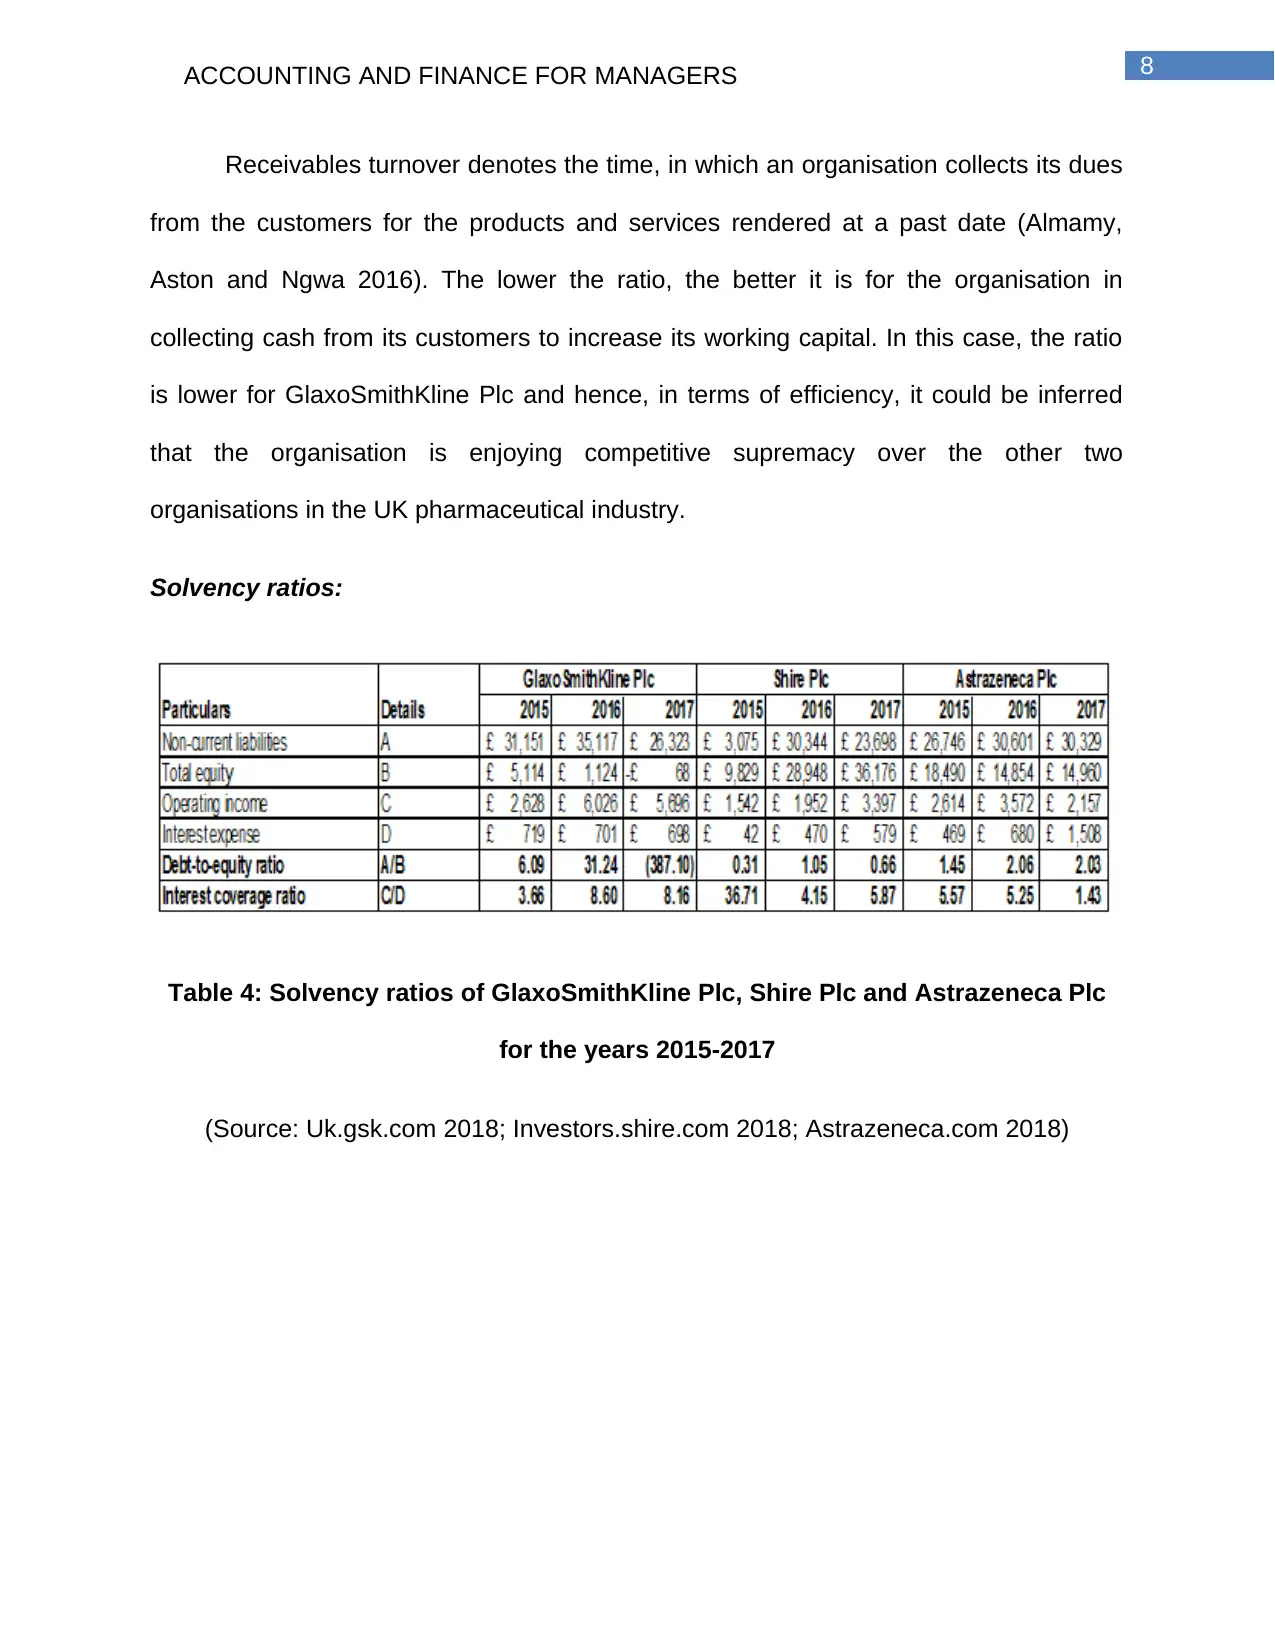
Solvency ratios:
Table 4: Solvency ratios of GlaxoSmithKline Plc, Shire Plc and Astrazeneca Plc
for the years 2015-2017
(Source: Uk.gsk.com 2018; Investors.shire.com 2018; Astrazeneca.com 2018)
⊘ This is a preview!⊘
Do you want full access?
Subscribe today to unlock all pages.
Trusted by 1+ million students worldwide
2015
2016
2017
2015
2016
2017
2015
2016
2017
GlaxoSmithKli
ne Plc Shire Plc Astrazeneca
Plc
-400.00
-350.00
-300.00
-250.00
-200.00
-150.00
-100.00
-50.00
-
50.00
Solvency Ratios
Interest coverage ratio
Debt-to-equity ratio
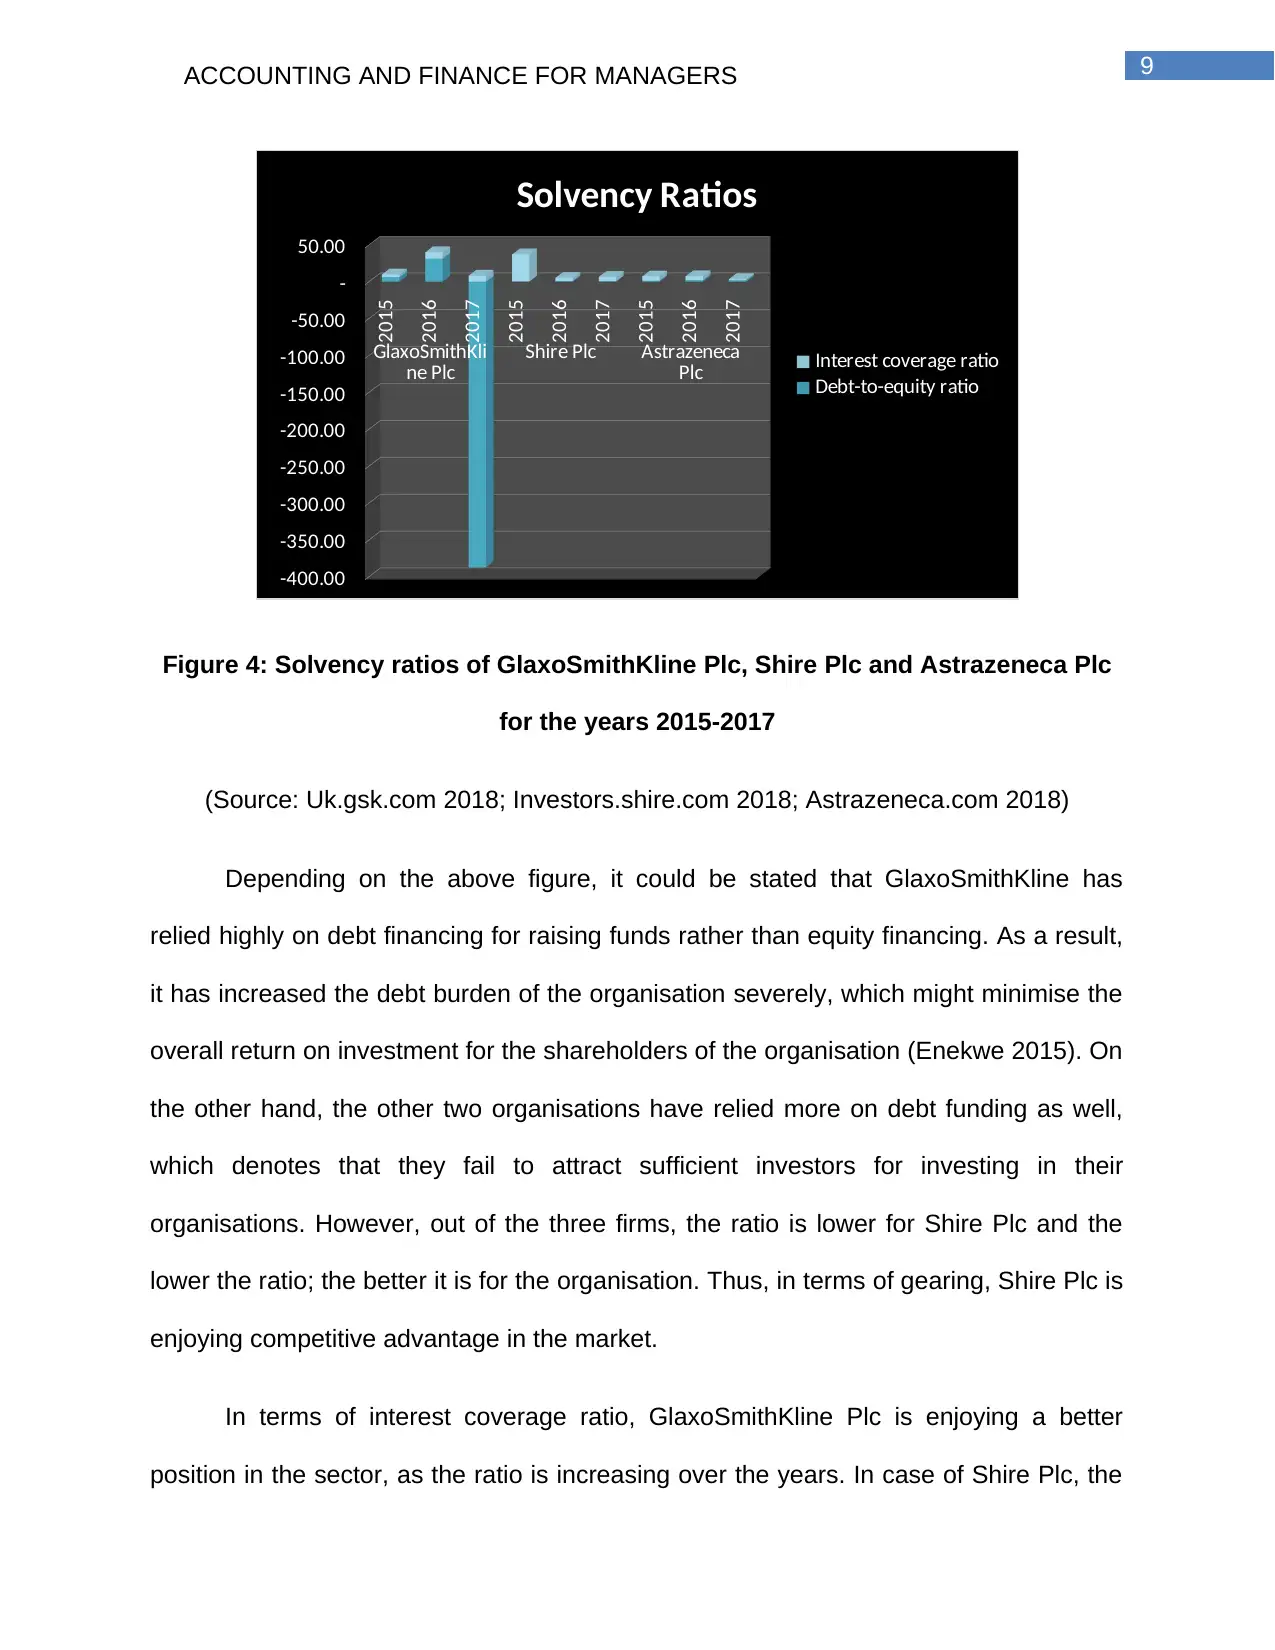
Figure 4: Solvency ratios of GlaxoSmithKline Plc, Shire Plc and Astrazeneca Plc
for the years 2015-2017
(Source: Uk.gsk.com 2018; Investors.shire.com 2018; Astrazeneca.com 2018)
Depending on the above figure, it could be stated that GlaxoSmithKline has
relied highly on debt financing for raising funds rather than equity financing. As a result,
it has increased the debt burden of the organisation severely, which might minimise the
overall return on investment for the shareholders of the organisation (Enekwe 2015). On
the other hand, the other two organisations have relied more on debt funding as well,
which denotes that they fail to attract sufficient investors for investing in their
organisations. However, out of the three firms, the ratio is lower for Shire Plc and the
lower the ratio; the better it is for the organisation. Thus, in terms of gearing, Shire Plc is
enjoying competitive advantage in the market.
In terms of interest coverage ratio, GlaxoSmithKline Plc is enjoying a better
position in the sector, as the ratio is increasing over the years. In case of Shire Plc, the
Paraphrase This Document
ratio has fallen massively in 2016 even though a slight increase is observed in 2017.
For Astrazeneca Plc, the ratio has declined over the years. Hence, it could be stated
that GlaxoSmithKline has better capability of clearing off its financing cost with the help
of adequate operating income.
Investment ratios:
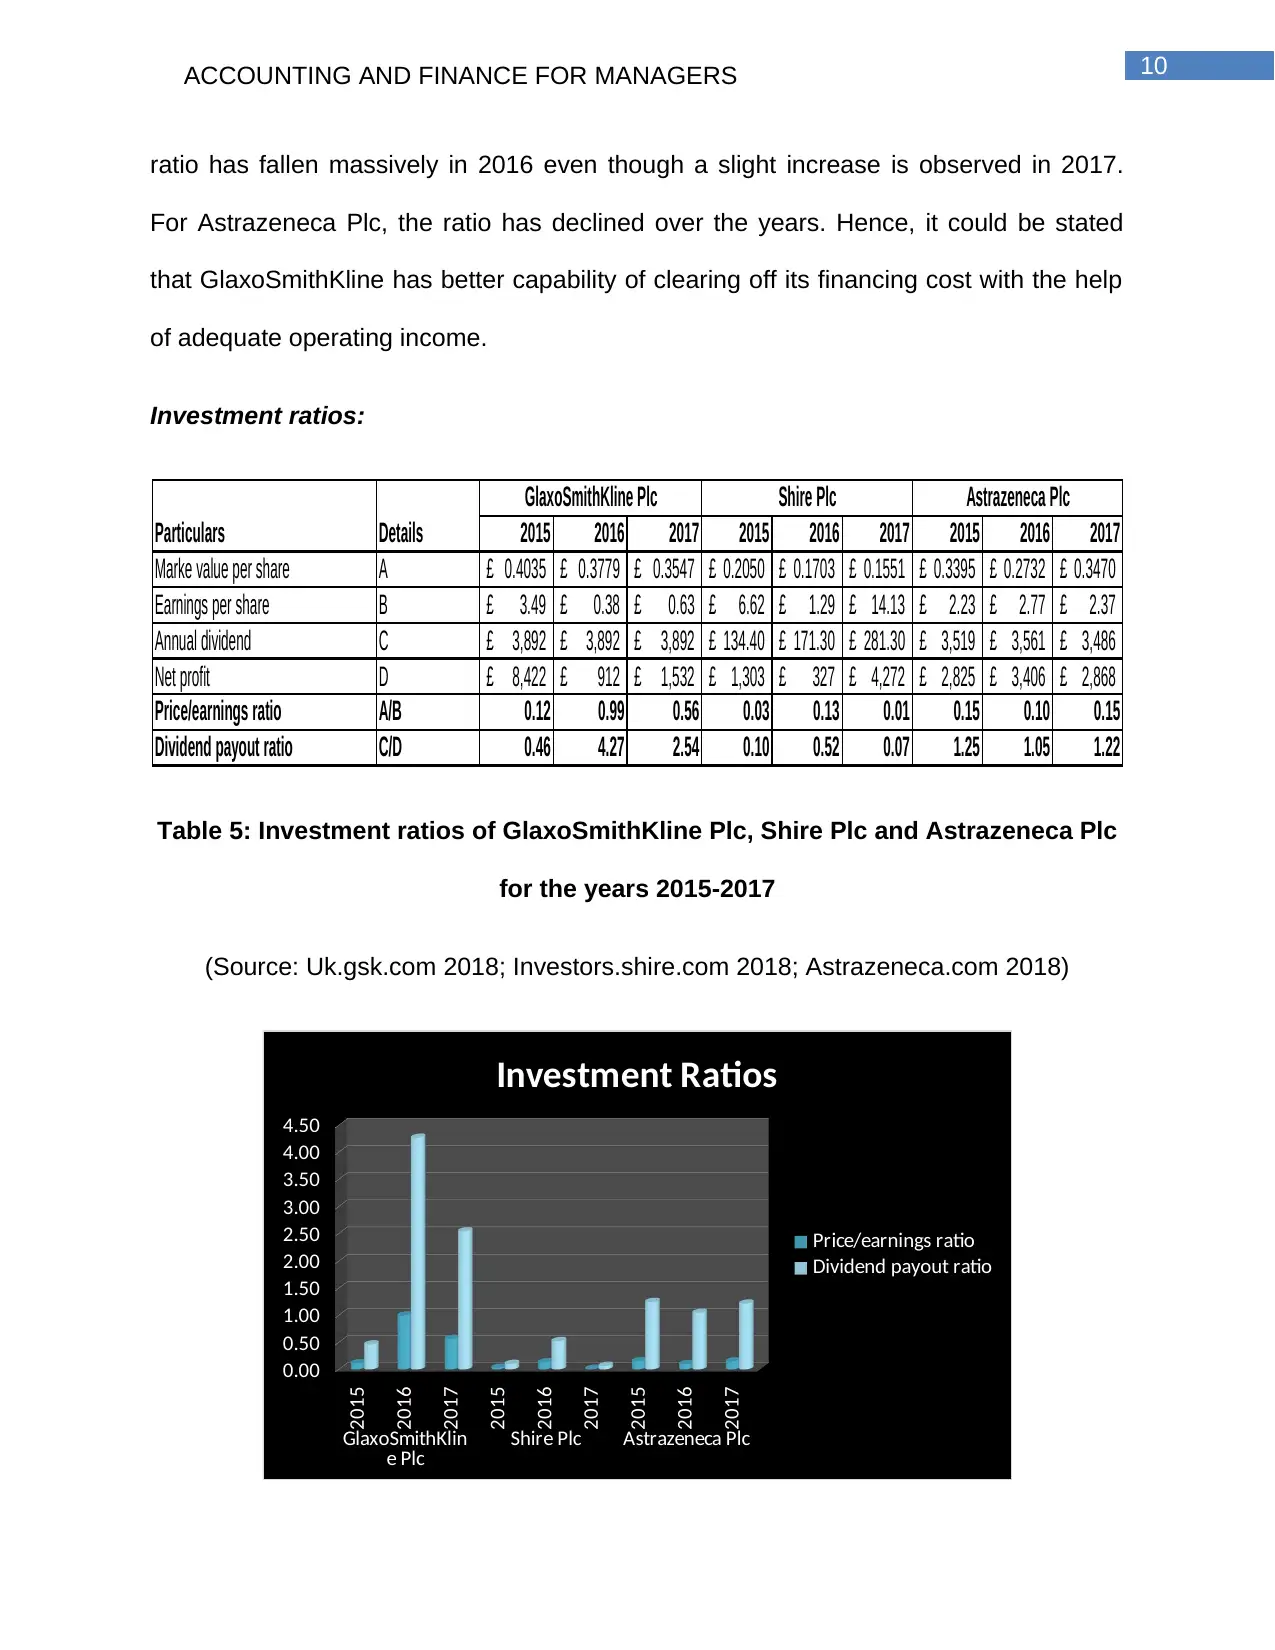
2015 2016 2017 2015 2016 2017 2015 2016 2017
Marke value per share A 0.4035£ 0.3779£ 0.3547£ 0.2050£ 0.1703£ 0.1551£ 0.3395£ 0.2732£ 0.3470£
Earnings per share B 3.49£ 0.38£ 0.63£ 6.62£ 1.29£ 14.13£ 2.23£ 2.77£ 2.37£
Annual dividend C 3,892£ 3,892£ 3,892£ 134.40£ 171.30£ 281.30£ 3,519£ 3,561£ 3,486£
Net profit D 8,422£ 912£ 1,532£ 1,303£ 327£ 4,272£ 2,825£ 3,406£ 2,868£
Price/earnings ratio A/B 0.12 0.99 0.56 0.03 0.13 0.01 0.15 0.10 0.15
Dividend payout ratio C/D 0.46 4.27 2.54 0.10 0.52 0.07 1.25 1.05 1.22
Particulars Details
GlaxoSmithKline Plc Shire Plc Astrazeneca Plc
Table 5: Investment ratios of GlaxoSmithKline Plc, Shire Plc and Astrazeneca Plc
for the years 2015-2017
(Source: Uk.gsk.com 2018; Investors.shire.com 2018; Astrazeneca.com 2018)
2015
2016
2017
2015
2016
2017
2015
2016
2017
GlaxoSmithKlin
e Plc Shire Plc Astrazeneca Plc
0.00
0.50
1.00
1.50
2.00
2.50
3.00
3.50
4.00
4.50
Investment Ratios
Price/earnings ratio
Dividend payout ratio
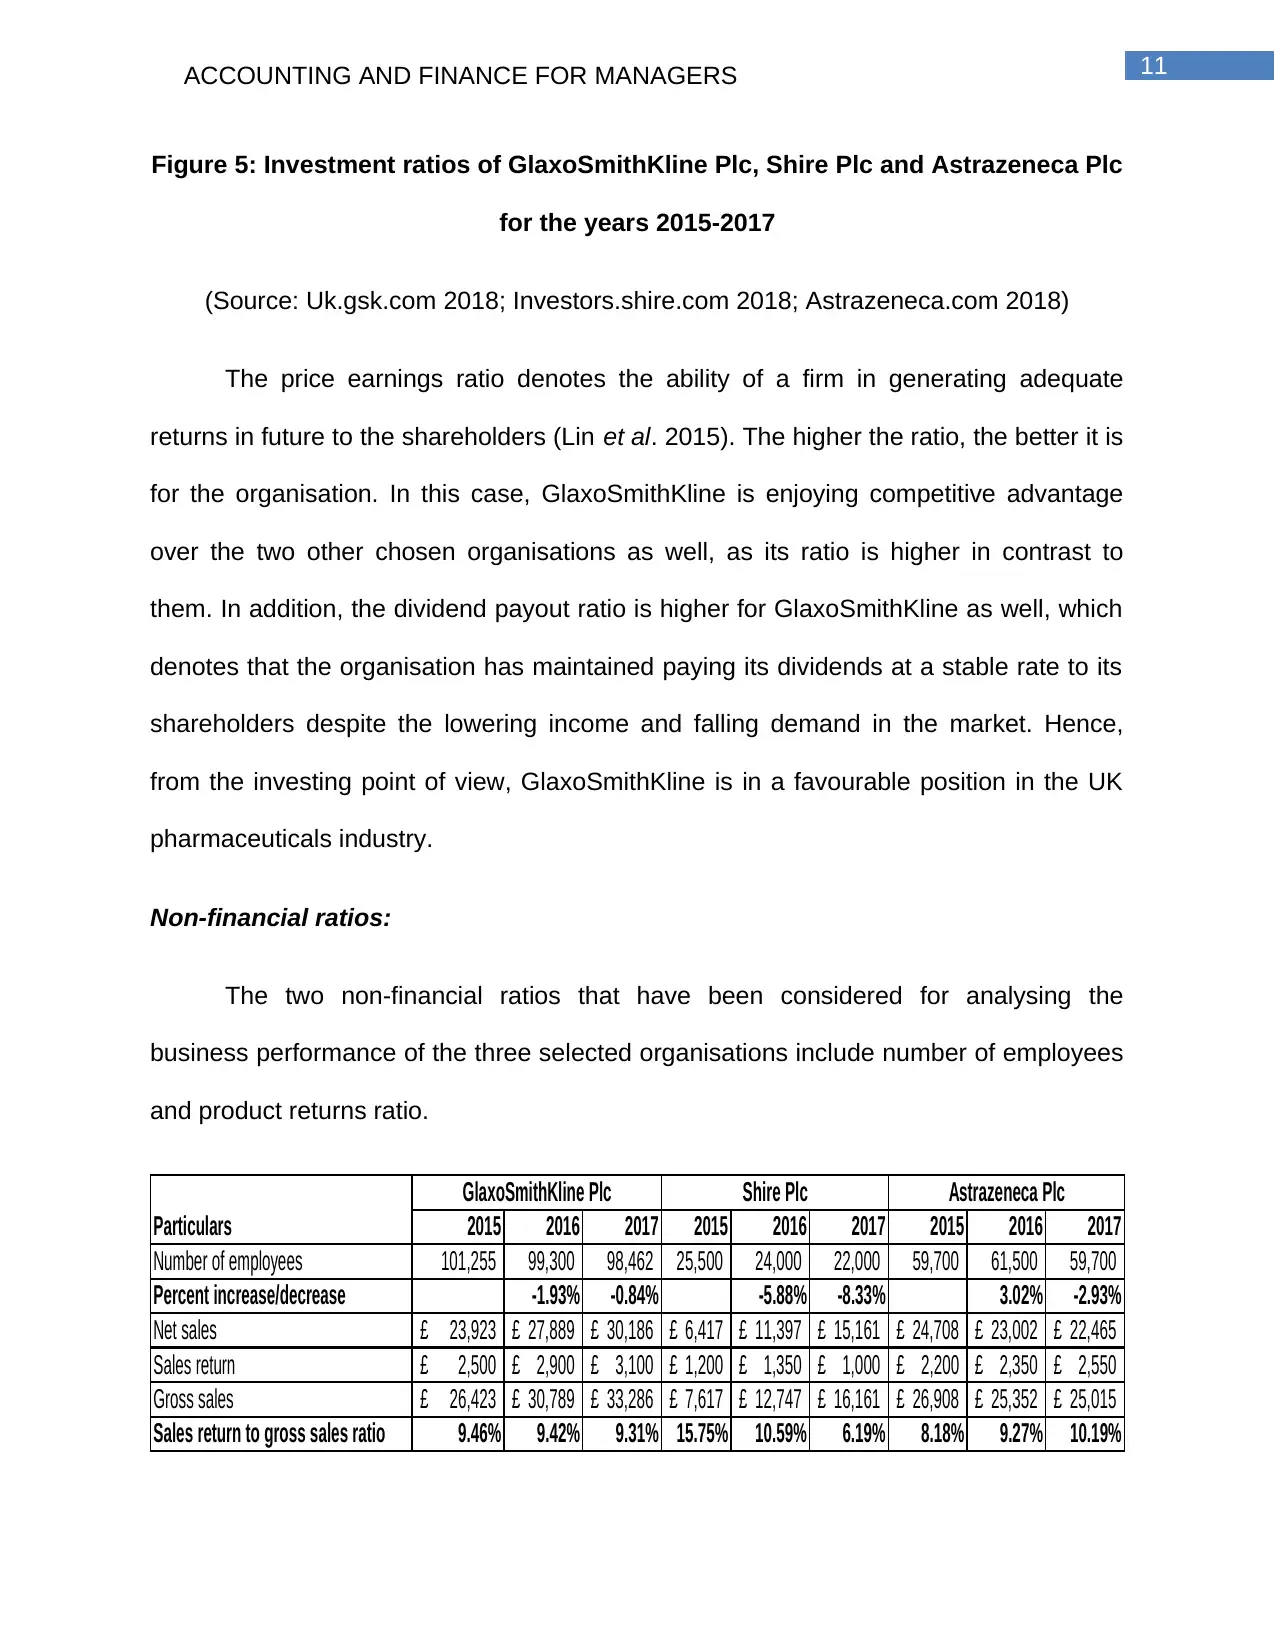
Figure 5: Investment ratios of GlaxoSmithKline Plc, Shire Plc and Astrazeneca Plc
for the years 2015-2017
(Source: Uk.gsk.com 2018; Investors.shire.com 2018; Astrazeneca.com 2018)
The price earnings ratio denotes the ability of a firm in generating adequate
returns in future to the shareholders (Lin et al. 2015). The higher the ratio, the better it is
for the organisation. In this case, GlaxoSmithKline is enjoying competitive advantage
over the two other chosen organisations as well, as its ratio is higher in contrast to
them. In addition, the dividend payout ratio is higher for GlaxoSmithKline as well, which
denotes that the organisation has maintained paying its dividends at a stable rate to its
shareholders despite the lowering income and falling demand in the market. Hence,
from the investing point of view, GlaxoSmithKline is in a favourable position in the UK
pharmaceuticals industry.
Non-financial ratios:
The two non-financial ratios that have been considered for analysing the
business performance of the three selected organisations include number of employees
and product returns ratio.
2015 2016 2017 2015 2016 2017 2015 2016 2017
Number of employees 101,255 99,300 98,462 25,500 24,000 22,000 59,700 61,500 59,700
Percent increase/decrease -1.93% -0.84% -5.88% -8.33% 3.02% -2.93%
Net sales 23,923£ 27,889£ 30,186£ 6,417£ 11,397£ 15,161£ 24,708£ 23,002£ 22,465£
Sales return 2,500£ 2,900£ 3,100£ 1,200£ 1,350£ 1,000£ 2,200£ 2,350£ 2,550£
Gross sales 26,423£ 30,789£ 33,286£ 7,617£ 12,747£ 16,161£ 26,908£ 25,352£ 25,015£
Sales return to gross sales ratio 9.46% 9.42% 9.31% 15.75% 10.59% 6.19% 8.18% 9.27% 10.19%
GlaxoSmithKline Plc Shire Plc Astrazeneca Plc
Particulars
⊘ This is a preview!⊘
Do you want full access?
Subscribe today to unlock all pages.
Trusted by 1+ million students worldwide
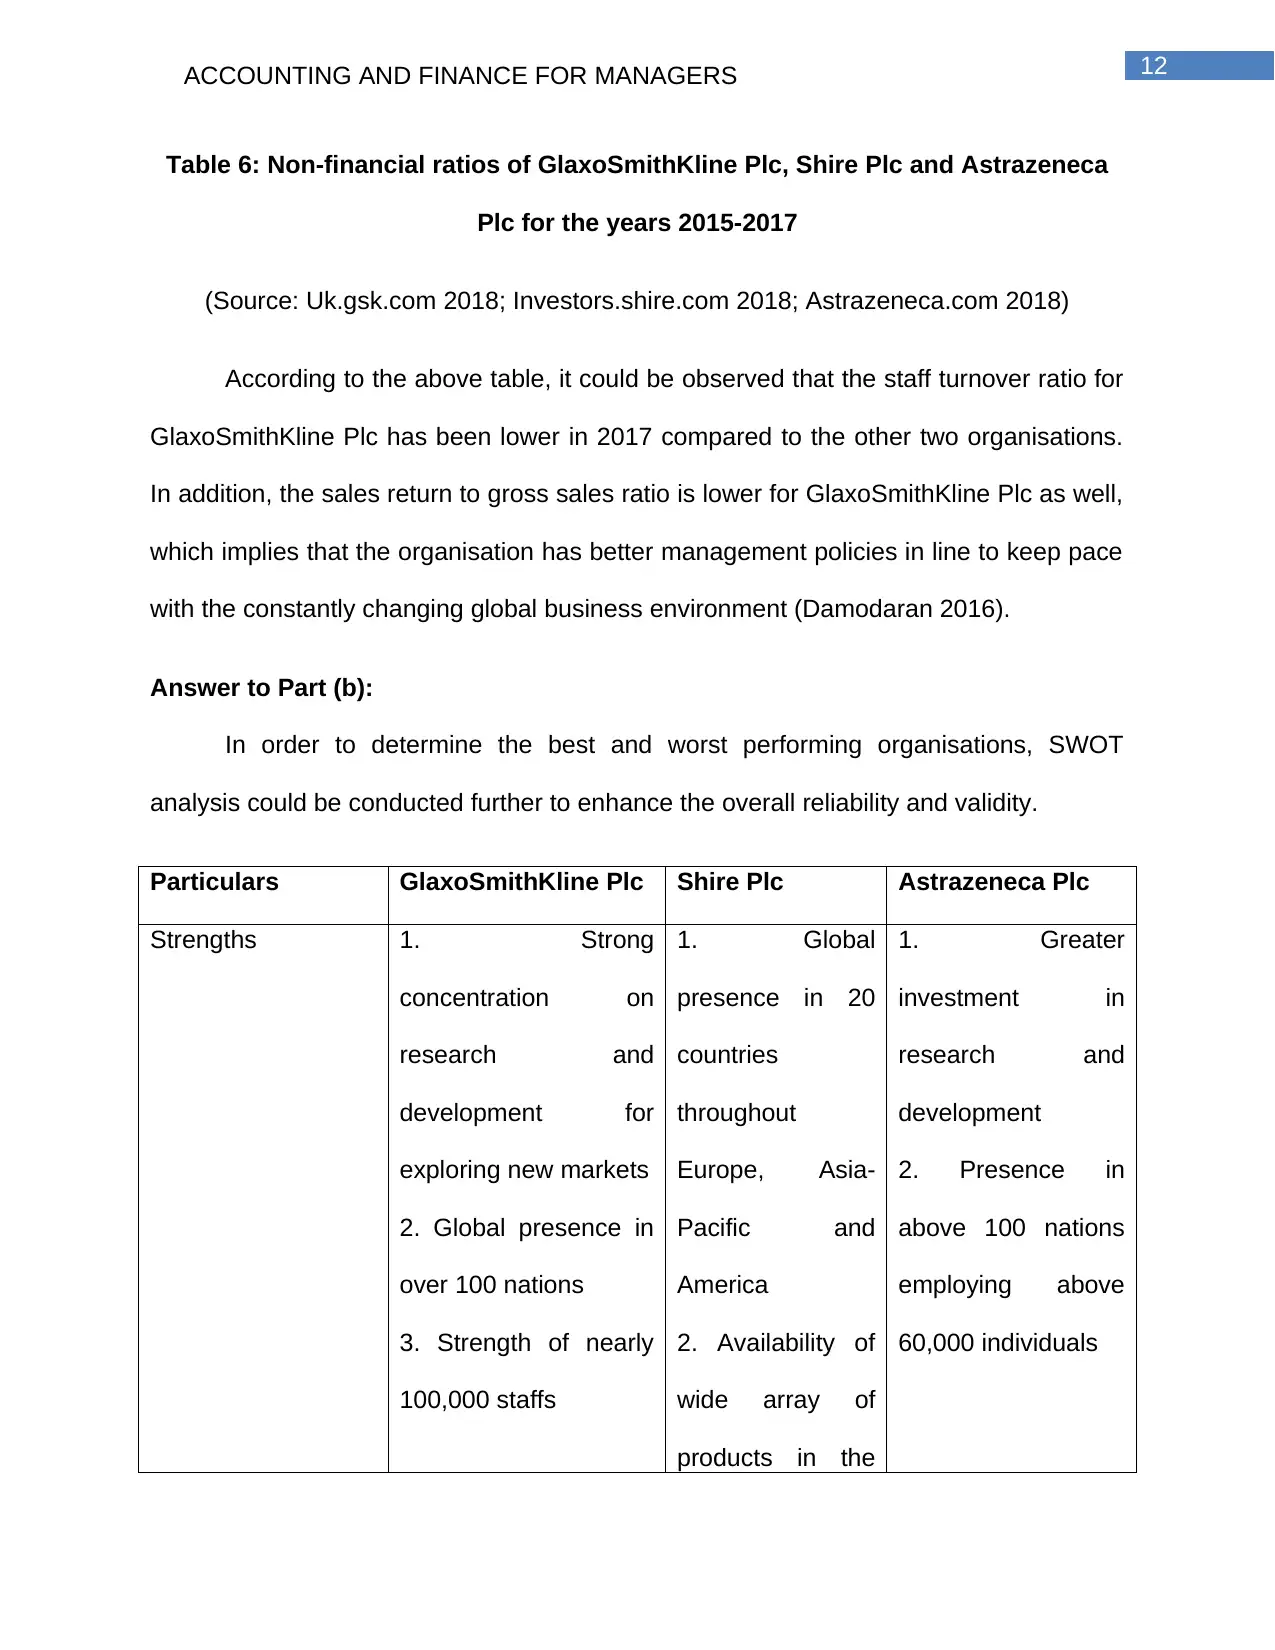
Table 6: Non-financial ratios of GlaxoSmithKline Plc, Shire Plc and Astrazeneca
Plc for the years 2015-2017
(Source: Uk.gsk.com 2018; Investors.shire.com 2018; Astrazeneca.com 2018)
According to the above table, it could be observed that the staff turnover ratio for
GlaxoSmithKline Plc has been lower in 2017 compared to the other two organisations.
In addition, the sales return to gross sales ratio is lower for GlaxoSmithKline Plc as well,
which implies that the organisation has better management policies in line to keep pace
with the constantly changing global business environment (Damodaran 2016).
Answer to Part (b):
In order to determine the best and worst performing organisations, SWOT
analysis could be conducted further to enhance the overall reliability and validity.
Particulars GlaxoSmithKline Plc Shire Plc Astrazeneca Plc
Strengths 1. Strong
concentration on
research and
development for
exploring new markets
2. Global presence in
over 100 nations
3. Strength of nearly
100,000 staffs
1. Global
presence in 20
countries
throughout
Europe, Asia-
Pacific and
America
2. Availability of
wide array of
products in the
1. Greater
investment in
research and
development
2. Presence in
above 100 nations
employing above
60,000 individuals
Paraphrase This Document
market
3. Effective core
in-house
expertise
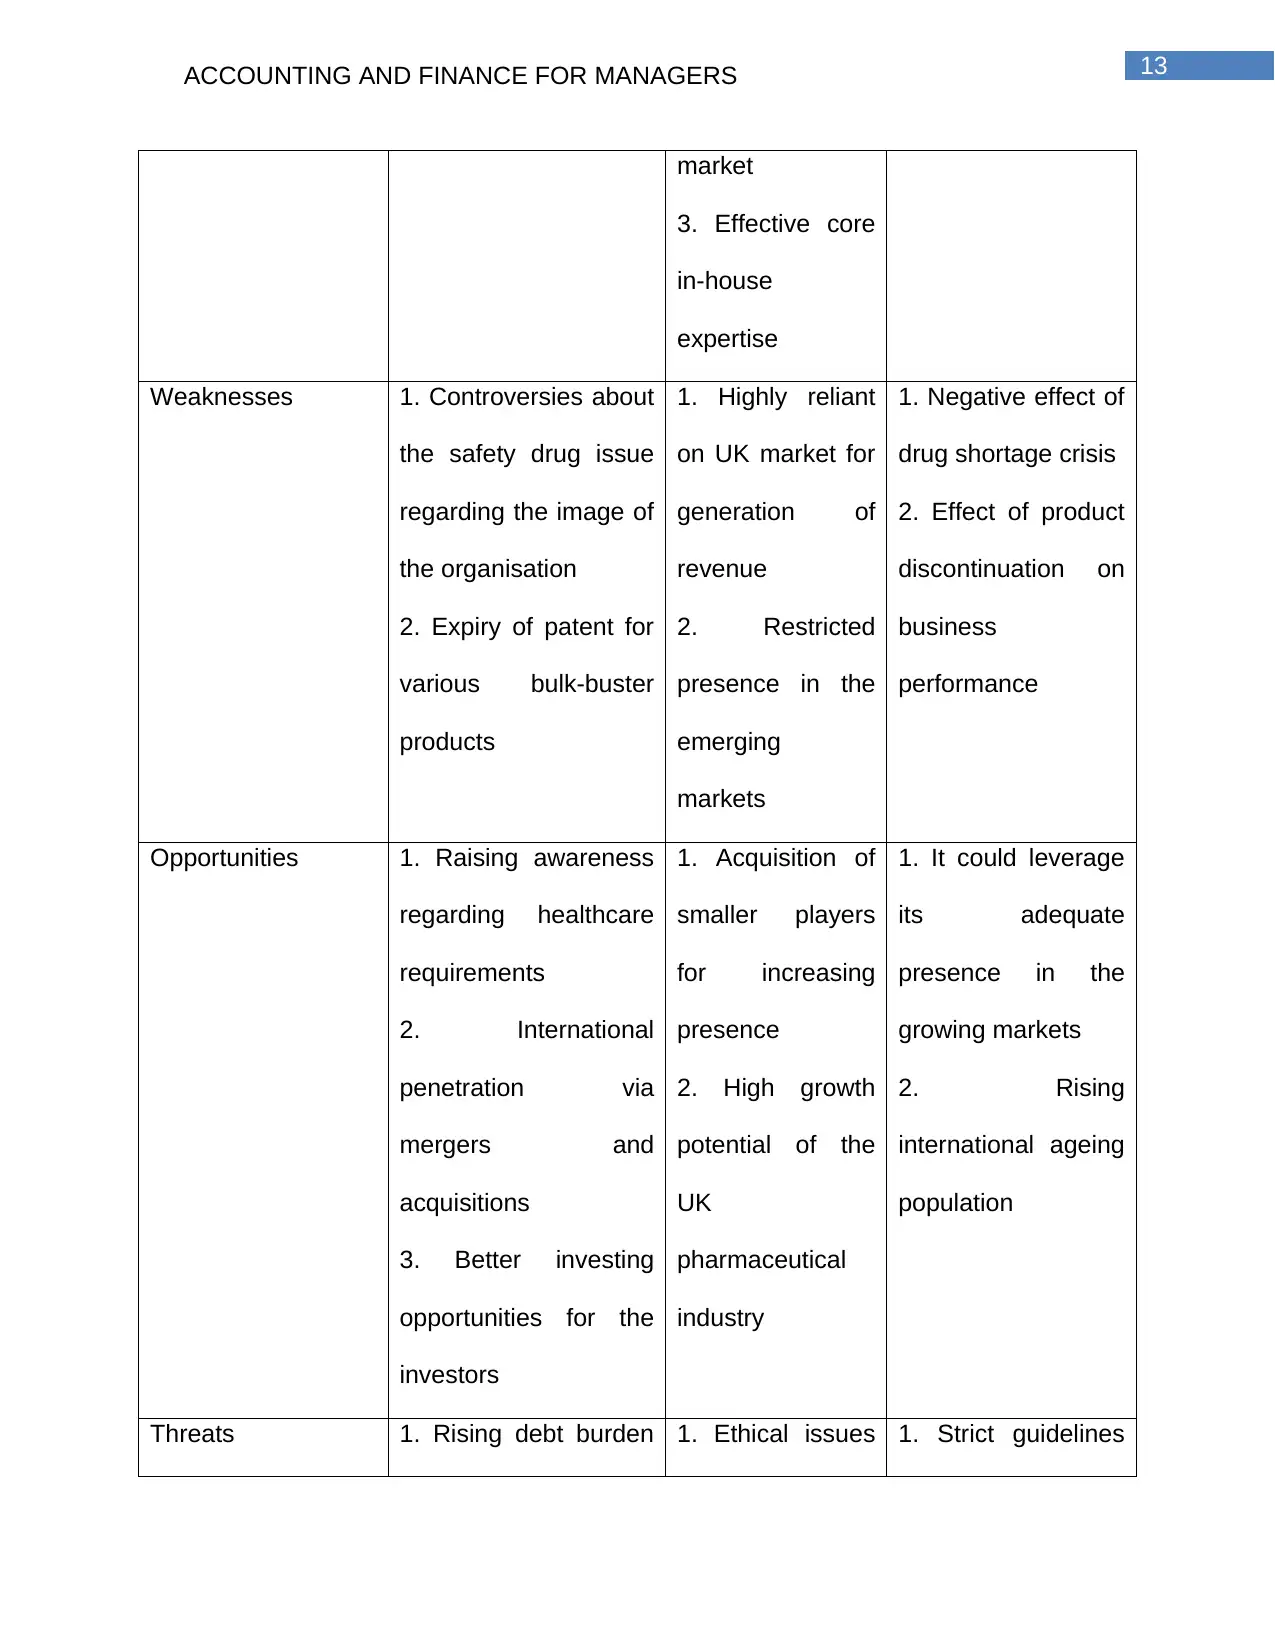
Weaknesses 1. Controversies about
the safety drug issue
regarding the image of
the organisation
2. Expiry of patent for
various bulk-buster
products
1. Highly reliant
on UK market for
generation of
revenue
2. Restricted
presence in the
emerging
markets
1. Negative effect of
drug shortage crisis
2. Effect of product
discontinuation on
business
performance
Opportunities 1. Raising awareness
regarding healthcare
requirements
2. International
penetration via
mergers and
acquisitions
3. Better investing
opportunities for the
investors
1. Acquisition of
smaller players
for increasing
presence
2. High growth
potential of the
UK
pharmaceutical
industry
1. It could leverage
its adequate
presence in the
growing markets
2. Rising
international ageing
population
Threats 1. Rising debt burden 1. Ethical issues 1. Strict guidelines
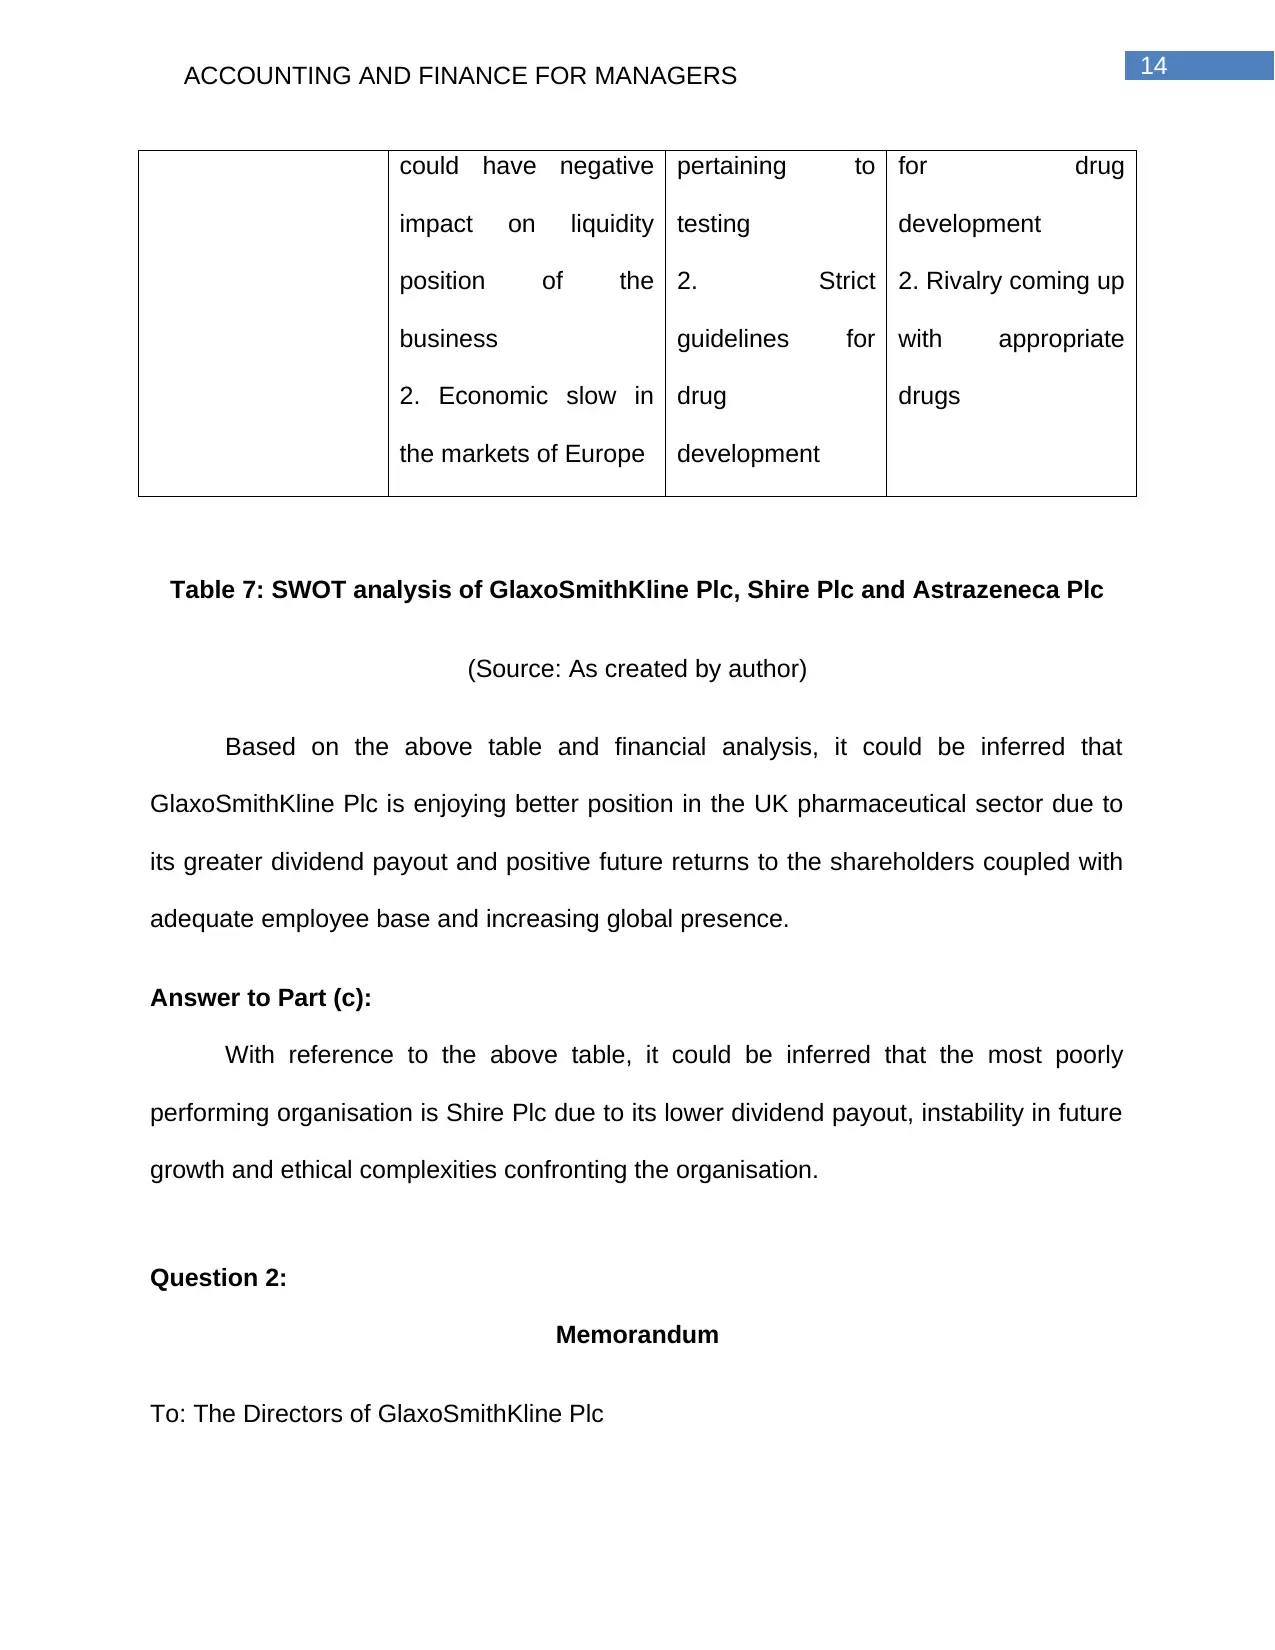
could have negative
impact on liquidity
position of the
business
2. Economic slow in
the markets of Europe
pertaining to
testing
2. Strict
guidelines for
drug
development
for drug
development
2. Rivalry coming up
with appropriate
drugs
Table 7: SWOT analysis of GlaxoSmithKline Plc, Shire Plc and Astrazeneca Plc
(Source: As created by author)
Based on the above table and financial analysis, it could be inferred that
GlaxoSmithKline Plc is enjoying better position in the UK pharmaceutical sector due to
its greater dividend payout and positive future returns to the shareholders coupled with
adequate employee base and increasing global presence.
Answer to Part (c):
With reference to the above table, it could be inferred that the most poorly
performing organisation is Shire Plc due to its lower dividend payout, instability in future
growth and ethical complexities confronting the organisation.
Question 2:
Memorandum
To: The Directors of GlaxoSmithKline Plc
⊘ This is a preview!⊘
Do you want full access?
Subscribe today to unlock all pages.
Trusted by 1+ million students worldwide
From:
Date: 09/04/2018
Subject: Investment Appraisal
The following memorandum is prepared in order to provide key details regarding
the importance of using investment appraisal techniques for the organisation. This is
elucidated in the following two parts:
Answer to Part (a):
Capital budgeting is a technique that helps the business organisations in
analysing several alternatives of capital investments and choosing the feasible
alternatives providing maximum returns (Burns and Walker 2015). This would be highly
important for the owners of GlaxoSmithKline Plc for gauging the profitability of a project
and the risks involved in the project. The main stages in the decision-making process of
capital investment and the role of investment appraisal in this process are described as
follows:
Identification of opportunities
Assessment of opportunities
Projections of cash flows
Selection of projects
Implementation
For instance, it is assumed that GlaxoSmithKline Plc is planning to purchase a
piece of machinery. In this case, the process of capital budgeting would start from the
Paraphrase This Document
identification of opportunities (Revellino and Mouritsen 2015). Therefore, the
organisation is looking for opportunities to double its production due to the high demand
of its products in the market. This could be identified in the form of opportunity available
to GlaxoSmithKline Plc. After exploring this opportunity, the organisation would shift to
the next stage of the capital budgeting process, which is evaluation of opportunities.
Thus, under this stage, the organisation would assess the opportunities like buying
machinery to double production from Company A or Company B, purchasing the semi-
automatic machine, subcontracting machinery or buying from outside (Baum and
Crosby 2014).
In this case, the organisation would decide to buy new machinery and after this
stage, it would project the future cash flows related to the decision of capital budgeting
to purchase automatic machine from Company A (Andor, Mohanty and Toth 2015). In
the fourth stage, depending on the estimation of cash flows and carrying out analysis of
net present value, internal rate of return and profitability index, the most feasible
outcome by using the mentioned techniques would be chosen. After this stage, the
machinery would be purchased and it would be set up in the factor. This is the way of
undertaking the capital budgeting decision in an organisation (Gotze, Northcott and
Schuster 2016).
Answer to Part (b):
It is assumed that GlaxoSmithKline Plc is considering two mutually exclusive
projects and the project having the maximum benefits would be considered. The cost of
capital or discount rate is assumed as 10%. The following example is considered, in
which the different types of investment appraisal techniques are applied:
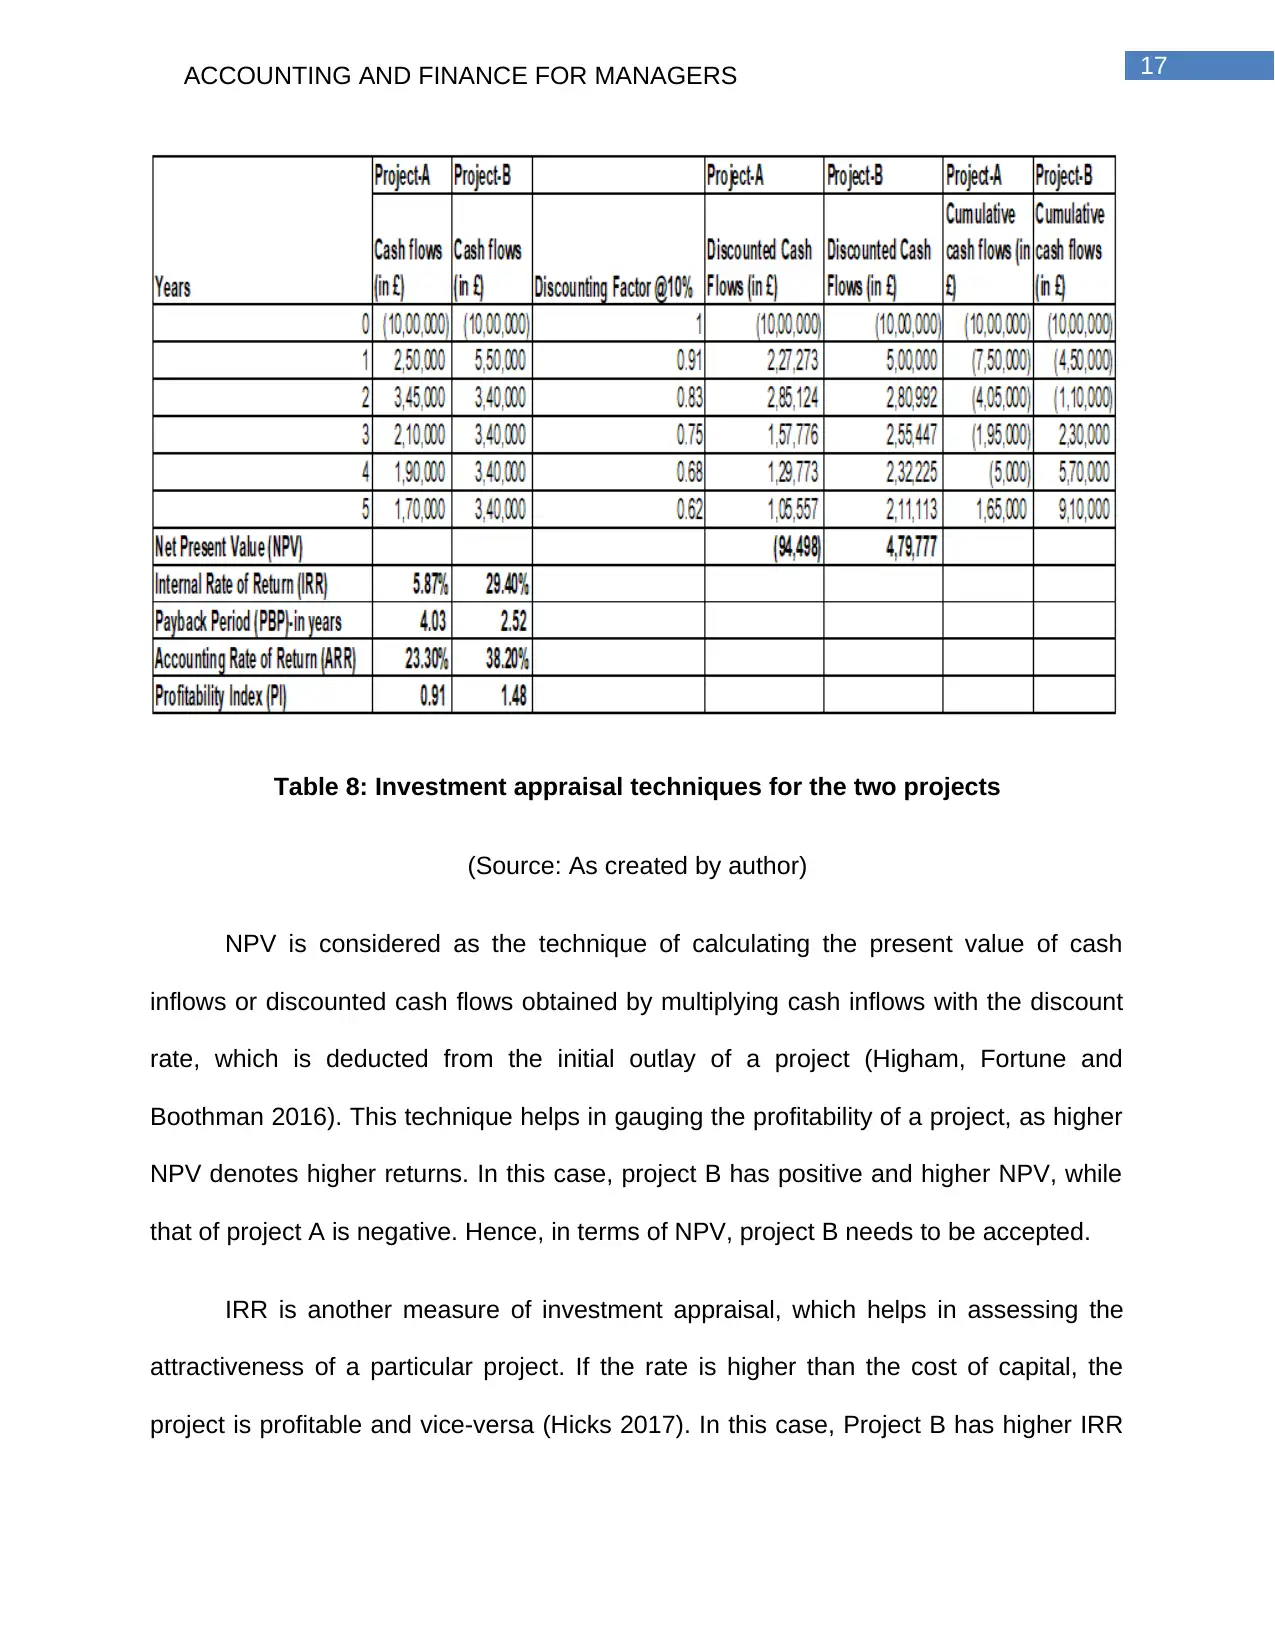
Table 8: Investment appraisal techniques for the two projects
(Source: As created by author)
NPV is considered as the technique of calculating the present value of cash
inflows or discounted cash flows obtained by multiplying cash inflows with the discount
rate, which is deducted from the initial outlay of a project (Higham, Fortune and
Boothman 2016). This technique helps in gauging the profitability of a project, as higher
NPV denotes higher returns. In this case, project B has positive and higher NPV, while
that of project A is negative. Hence, in terms of NPV, project B needs to be accepted.
IRR is another measure of investment appraisal, which helps in assessing the
attractiveness of a particular project. If the rate is higher than the cost of capital, the
project is profitable and vice-versa (Hicks 2017). In this case, Project B has higher IRR
⊘ This is a preview!⊘
Do you want full access?
Subscribe today to unlock all pages.
Trusted by 1+ million students worldwide
than the cost of capital, while the situation is just reverse in case of Project A. Thus,
project B needs to be accepted in this case.
PBP helps in estimating the time at which the initial investment made in the
project would be recovered. The lower the period, the better it is for the organisation. In
this case, project B has lower payback period compared to project A, which denotes the
feasibility of the former project.
ARR signifies the amount of profit in percentage form that an individual or an
organisation could make from the investment made. The higher the percentage, the
more profitable is the investment (Li and Trutnevyte 2017). In this case, ARR is higher
for project B than project A. Therefore, project B is to be accepted.
PI is an investment appraisal technique that helps in ranking projects, as it would
enable in quantifying the amount of value developed per unit of investment. A PI above
1 is considered feasible. In this case, the PI for project B is above 1, while that of project
B is below 1. Thus, it denotes that project B would be more profitable for
GlaxoSmithKline Plc.
Based on the hypothetical example, it is advised to the management of
GlaxoSmithKline Plc to progress ahead with project B, since it would help in maximising
the overall return on investment.
Paraphrase This Document
References:
Almamy, J., Aston, J. and Ngwa, L.N., 2016. An evaluation of Altman's Z-score using
cash flow ratio to predict corporate failure amid the recent financial crisis: Evidence from
the UK. Journal of Corporate Finance, 36, pp.278-285.
Andor, G., Mohanty, S.K. and Toth, T., 2015. Capital budgeting practices: A survey of
Central and Eastern European firms. Emerging Markets Review, 23, pp.148-172.
Astrazeneca.com., 2018. Investor relations. [online] Available at:
https://www.astrazeneca.com/investor-relations.html [Accessed 9 Apr. 2018].
Baum, A.E. and Crosby, N., 2014. Property investment appraisal. John Wiley & Sons.
Burns, R. and Walker, J., 2015. Capital budgeting surveys: the future is now.
Damodaran, A., 2016. Damodaran on valuation: security analysis for investment and
corporate finance (Vol. 324). John Wiley & Sons.
Dokas, I., Giokas, D. and Tsamis, A., 2014. Liquidity efficiency in the Greek listed firms:
a financial ratio based on data envelopment analysis. International Journal of Corporate
Finance and Accounting (IJCFA), 1(1), pp.40-59.
Enekwe, C.I., 2015. The relationship between financial ratio analysis and corporate
profitability: a study of selected quoted oil and gas companies in Nigeria. European
Journal of Accounting, Auditing and Finance Research, 3(2), pp.17-34.
Evans, J.R. and Mathur, A., 2014. Retailing and the period leading up to the Great
Recession: a model and a 25-year financial ratio analysis of US retailing. The
International Review of Retail, Distribution and Consumer Research, 24(1), pp.30-58.
Gotze, U., Northcott, D. and Schuster, P., 2016. INVESTMENT APPRAISAL.
SPRINGER-VERLAG BERLIN AN.
Hicks, C.L., 2017, July. MODERN PROJECT INVESTMENT APPRAISAL: RETURN TO
SIMPLICITY. In Process Optimisation: A Three-Day Symposium Organised by the
Midlands Branch of the Institution of Chemical Engineers and Held at the University of
Nottingham, 7–9 April 1987 (No. 61, p. 53). Elsevier.
Higham, A.P., Fortune, C. and Boothman, J.C., 2016. Sustainability and investment
appraisal for housing regeneration projects. Structural Survey, 34(2), pp.150-167.
Investors.shire.com.,2018. Archive. [online] Available at:
http://investors.shire.com/presentations-and-reports/annual-and-interim-reports/
archive.aspx [Accessed 9 Apr. 2018].
Li, F.G. and Trutnevyte, E., 2017. Investment appraisal of cost-optimal and near-optimal
pathways for the UK electricity sector transition to 2050. Applied energy, 189, pp.89-
109.
Lin, C.C., Chiu, A.A., Huang, S.Y. and Yen, D.C., 2015. Detecting the financial
statement fraud: The analysis of the differences between data mining techniques and
experts’ judgments. Knowledge-Based Systems, 89, pp.459-470.
Reid, W. and Myddelton, D.R., 2017. The meaning of company accounts. Routledge.
⊘ This is a preview!⊘
Do you want full access?
Subscribe today to unlock all pages.
Trusted by 1+ million students worldwide
Revellino, S. and Mouritsen, J., 2015. The Maieutic Force of Mediating Instruments:
Compromising in Capital Budgeting. In IPA Conference 2015.
Uk.gsk.com., 2018. Annual reports | GSK UK. [online] Available at:
http://uk.gsk.com/en-gb/investors/annual-reports/ [Accessed 9 Apr. 2018].
Vogel, H.L., 2014. Entertainment industry economics: A guide for financial analysis.
Cambridge University Press.
Warren, C.S. and Jones, J., 2018. Corporate financial accounting. Cengage Learning.
Paraphrase This Document
Appendices:
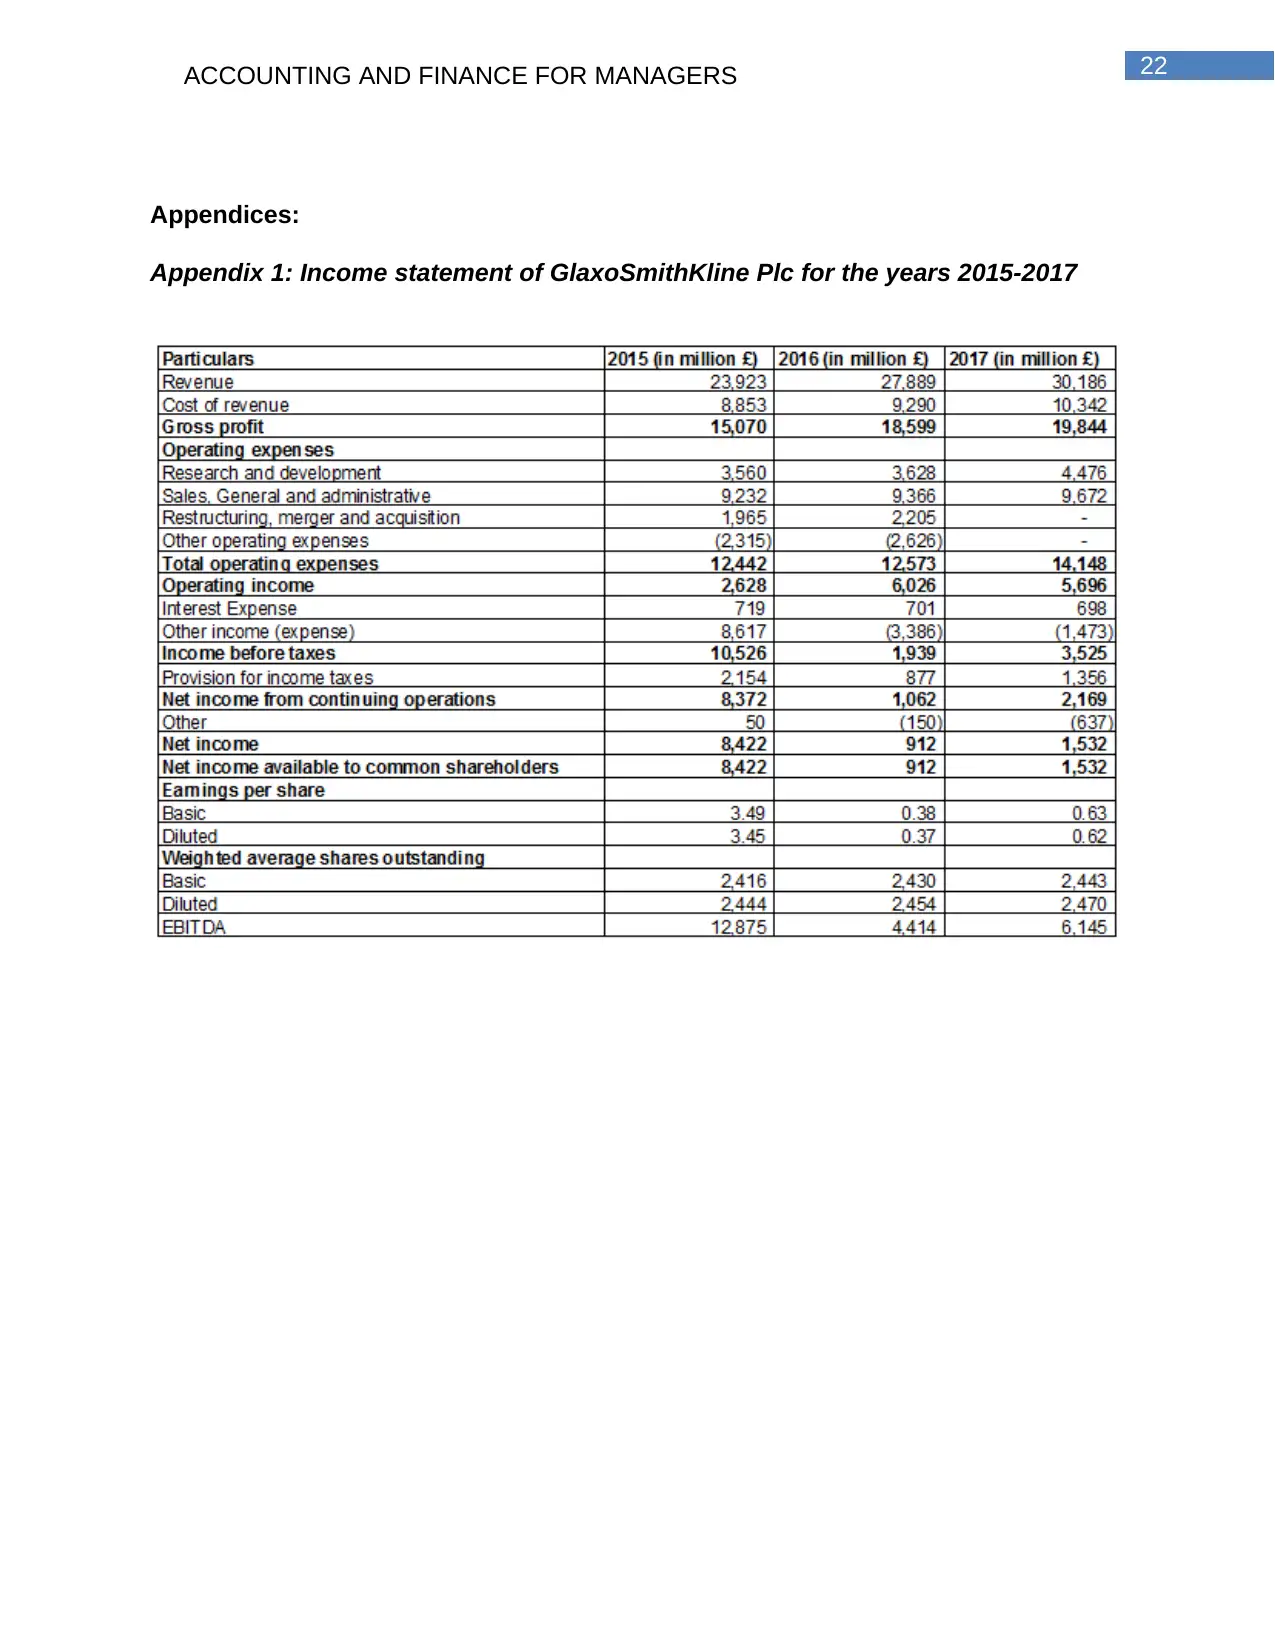
Appendix 1: Income statement of GlaxoSmithKline Plc for the years 2015-2017
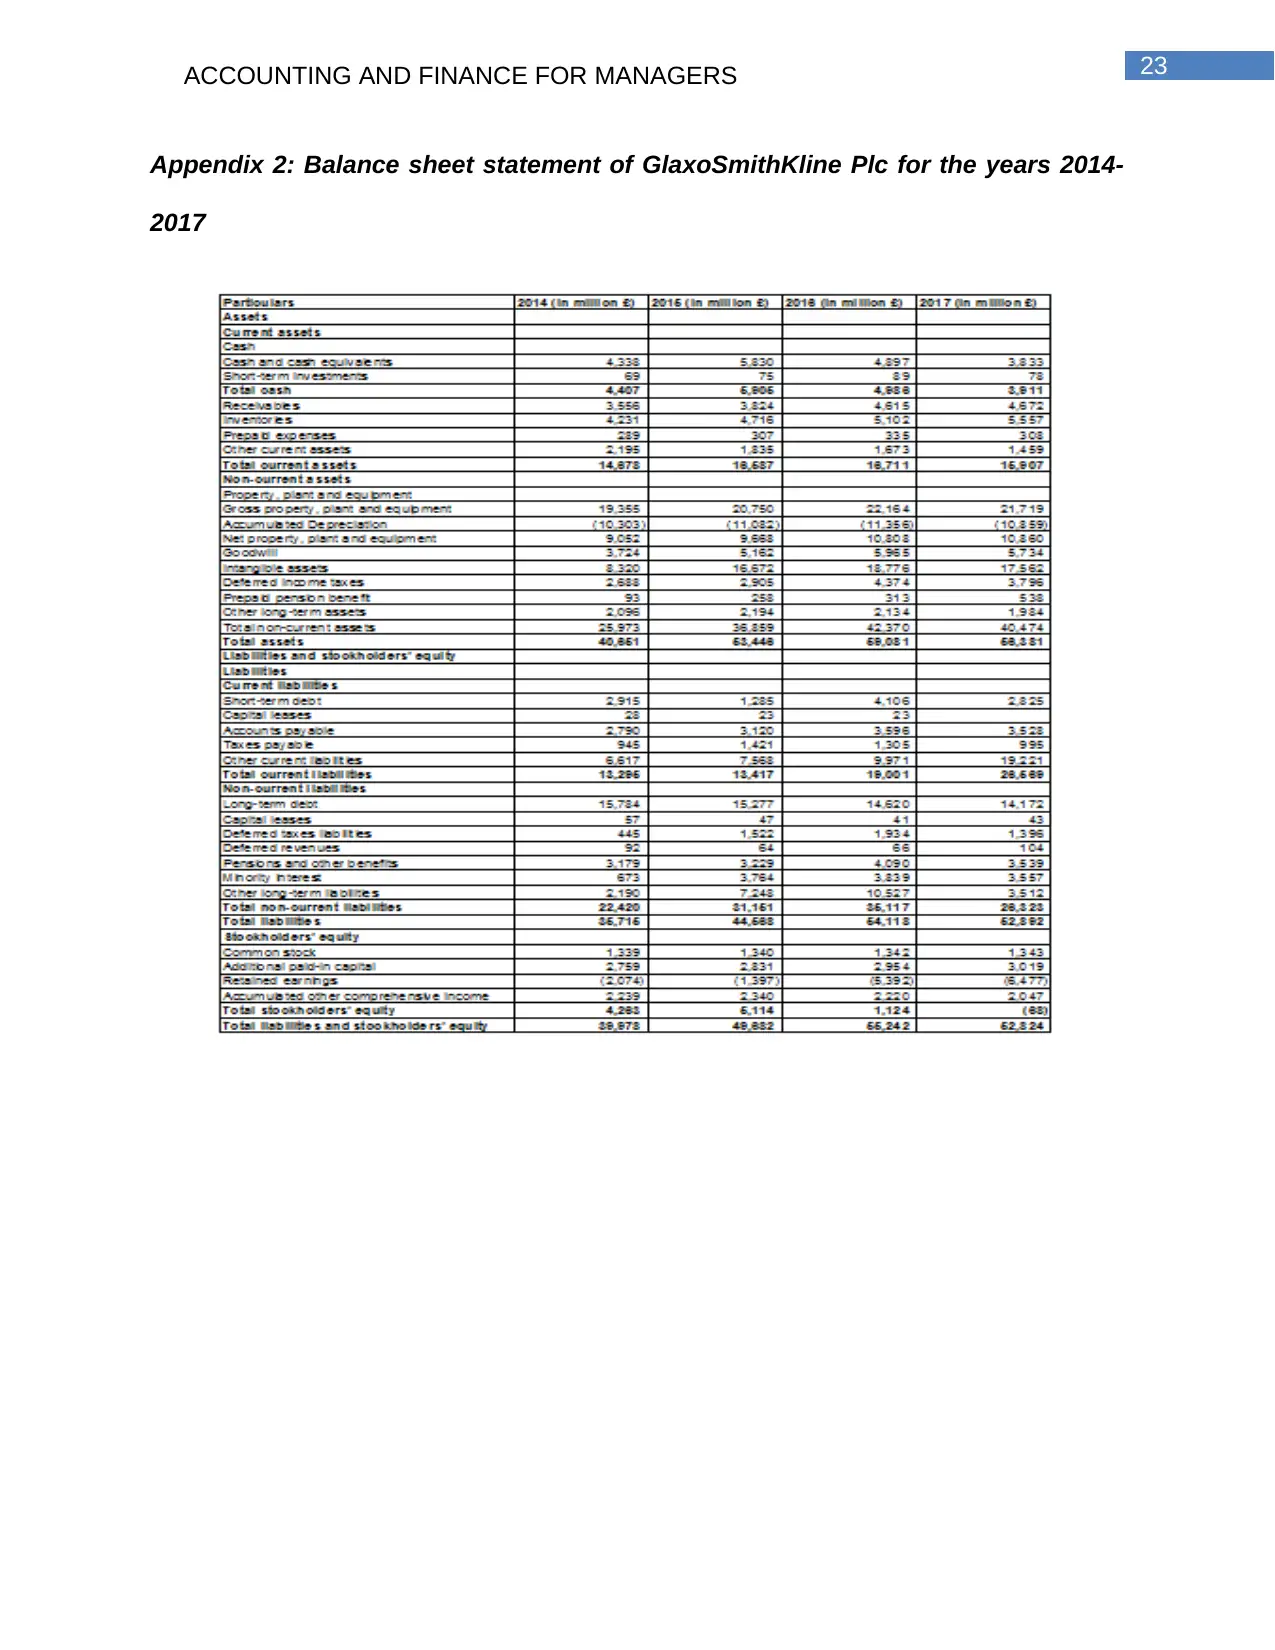
Appendix 2: Balance sheet statement of GlaxoSmithKline Plc for the years 2014-
2017
⊘ This is a preview!⊘
Do you want full access?
Subscribe today to unlock all pages.
Trusted by 1+ million students worldwide
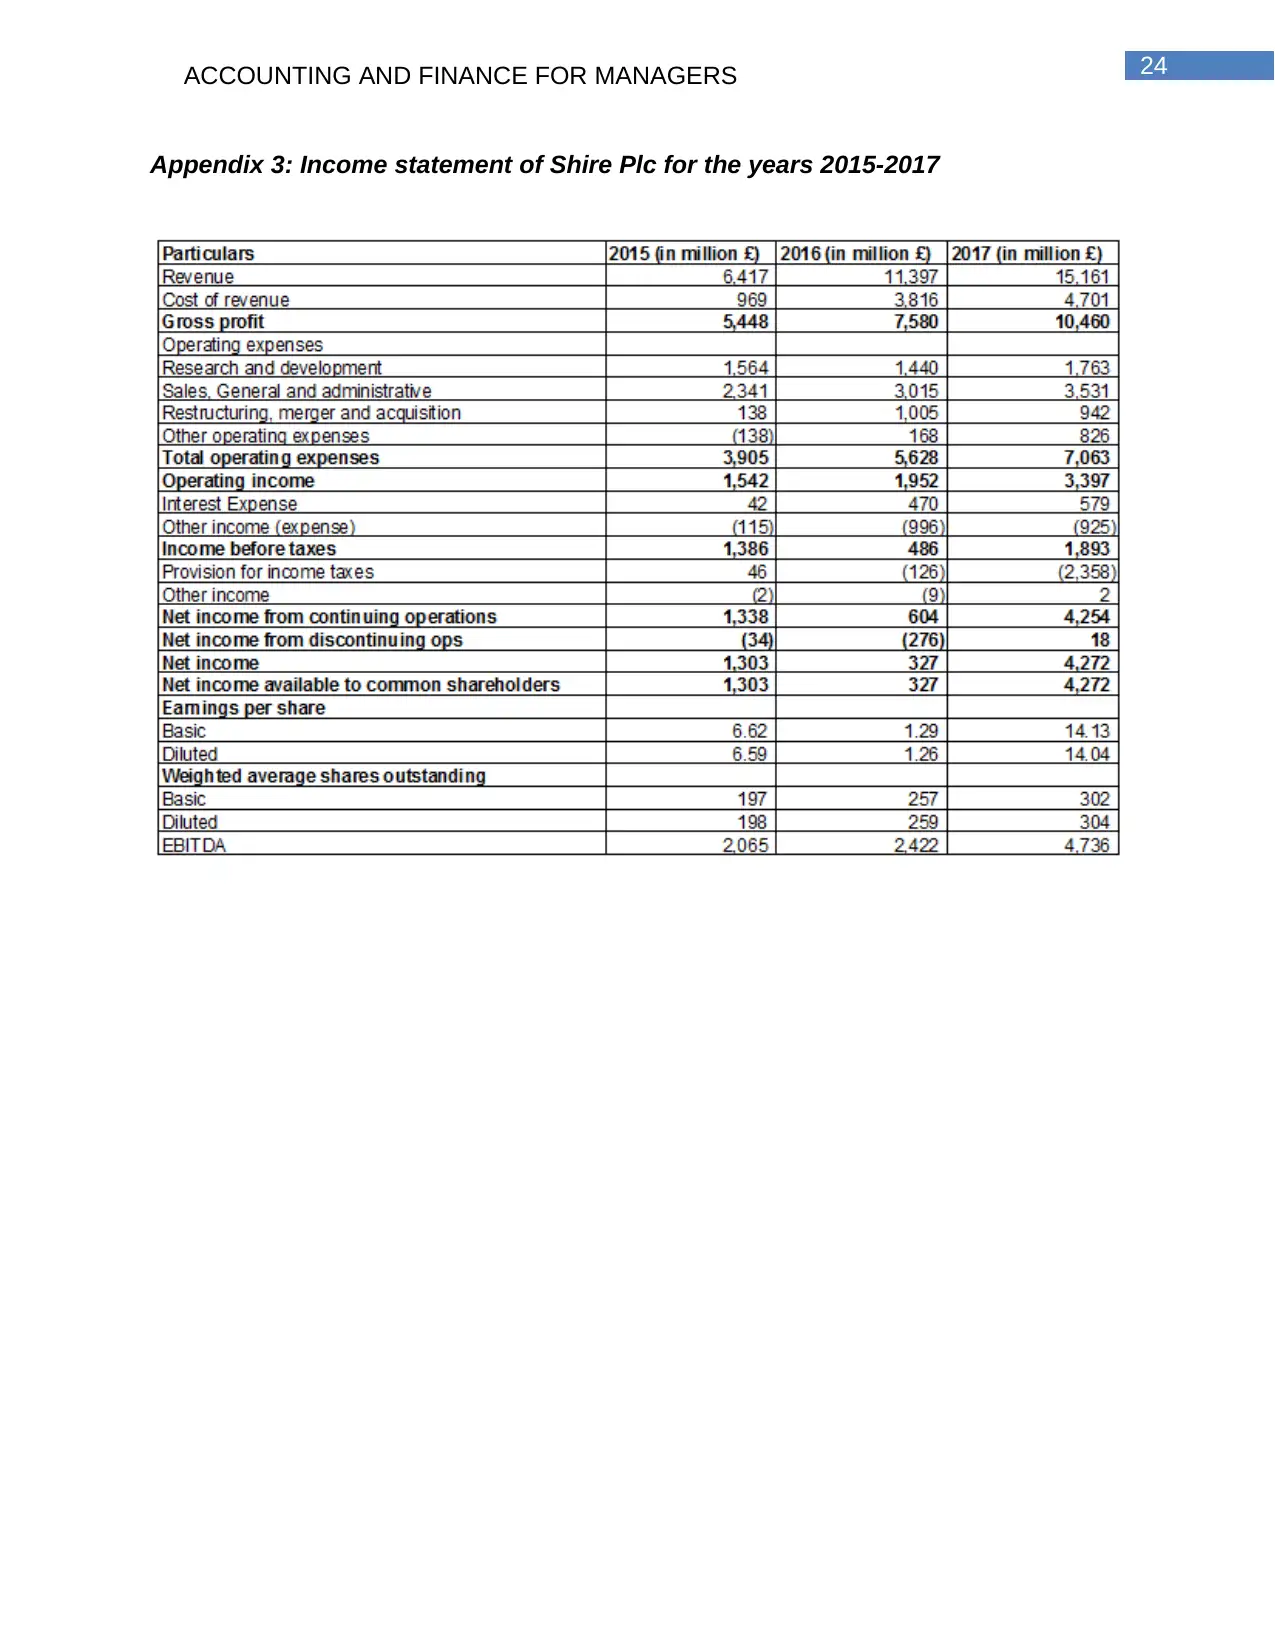
Appendix 3: Income statement of Shire Plc for the years 2015-2017
Paraphrase This Document

Appendix 4: Balance sheet statement of Shire Plc for the years 2014-2017
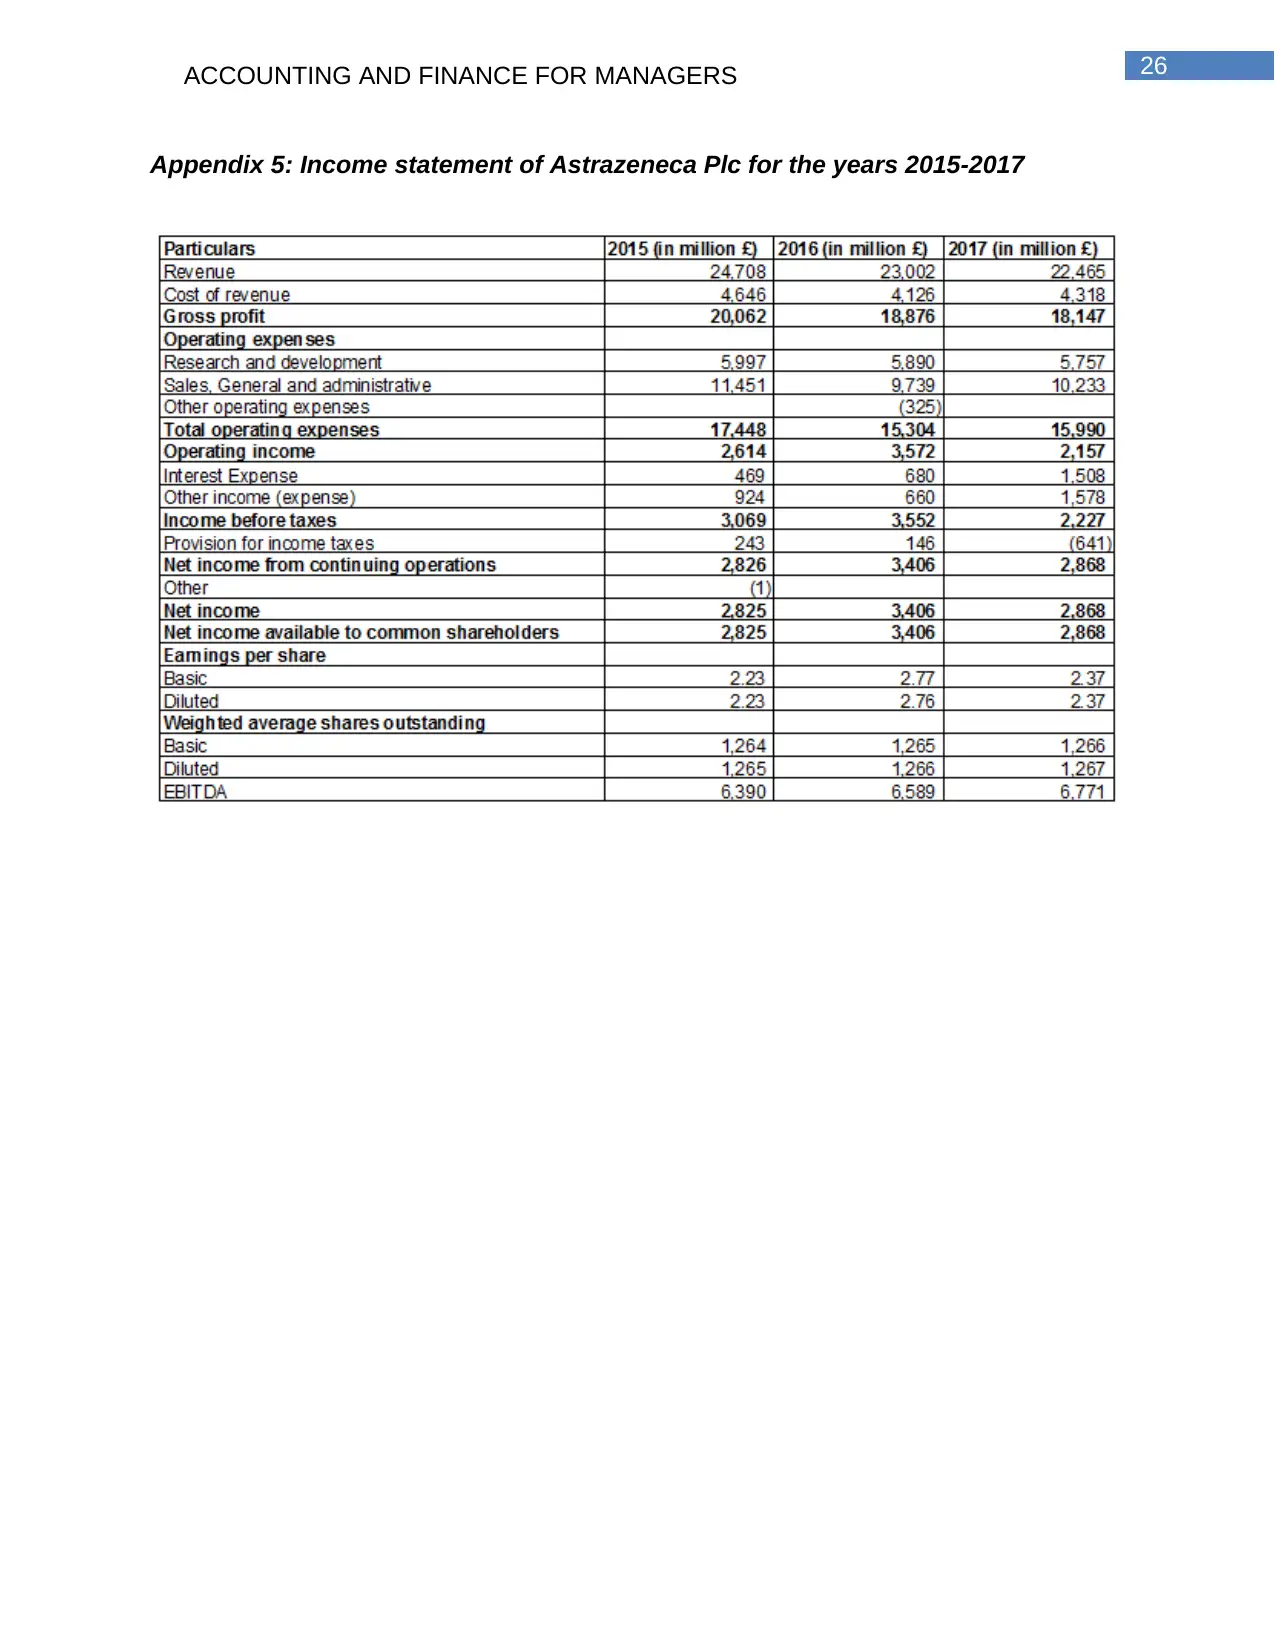
Appendix 5: Income statement of Astrazeneca Plc for the years 2015-2017
⊘ This is a preview!⊘
Do you want full access?
Subscribe today to unlock all pages.
Trusted by 1+ million students worldwide
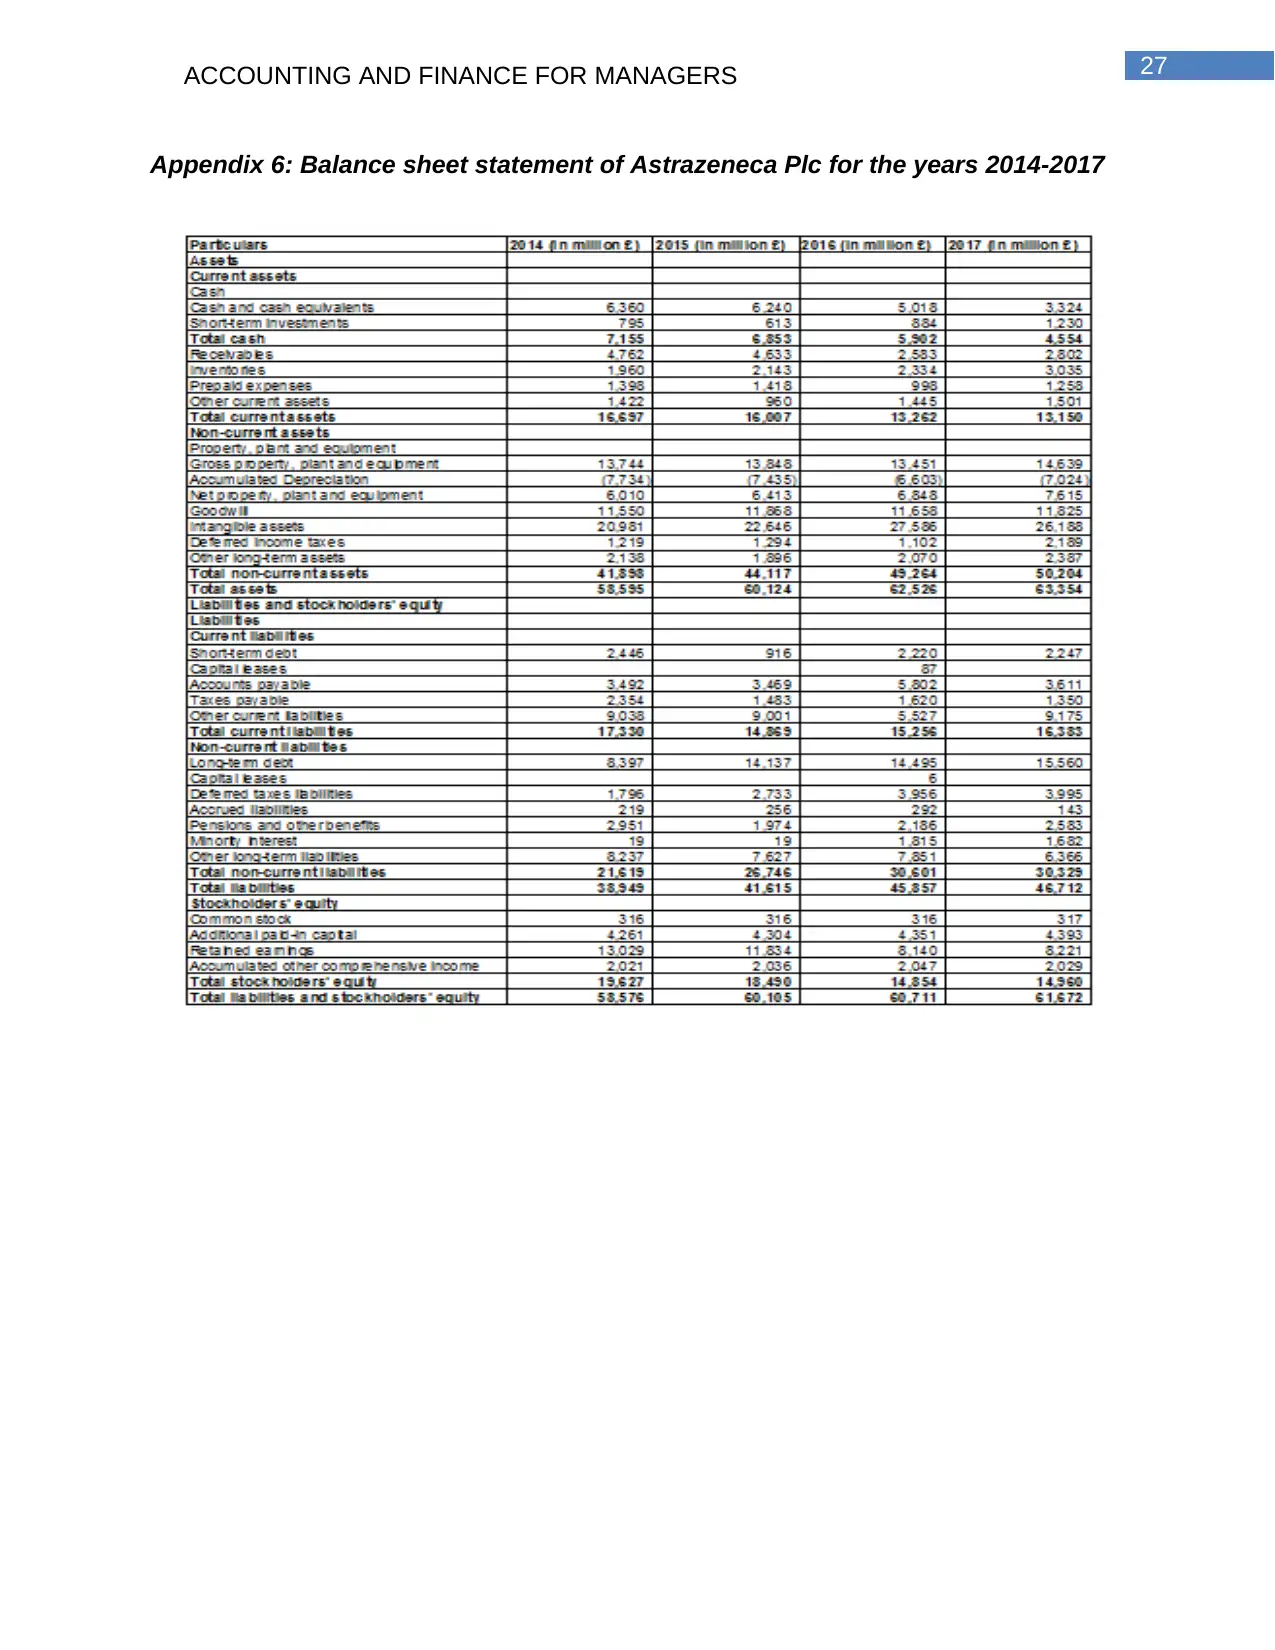
Appendix 6: Balance sheet statement of Astrazeneca Plc for the years 2014-2017
Related Documents


Your All-in-One AI-Powered Toolkit for Academic Success.
+13062052269
info@desklib.com
Available 24*7 on WhatsApp / Email
![[object Object]](/_next/static/media/star-bottom.7253800d.svg)
© 2024 | Zucol Services PVT LTD | All rights reserved.