Analysis of Financial Performance in Malaysian Retail Sector
VerifiedAdded on 2023/06/03
|20
|3968
|196
AI Summary
The report evaluates investment opportunities in the Malaysian retail sector by analysing the financial condition of Atlan Holdings Berhad and Hai-O-Enterprise Berhad using ratio analysis. It also provides suggestions for changes in financial strategy and investment recommendations.
Contribute Materials
Your contribution can guide someone’s learning journey. Share your
documents today.
Running head: ANALYSIS OF FINANCIAL PERFORMANCE
Analysis of Financial Performance
Name of the Student:
Name of the University:
Author’s Note:
Course ID:
Analysis of Financial Performance
Name of the Student:
Name of the University:
Author’s Note:
Course ID:
Secure Best Marks with AI Grader
Need help grading? Try our AI Grader for instant feedback on your assignments.
1ANALYSIS OF FINANCIAL PERFORMANCE
Executive Summary:
The report is prepared for evaluating the investment opportunities in the Malaysian retail sector for which
two organisations listed in Bursa Malaysia are chosen. These organisations include Atlan Holdings
Berhad and Hai-O-Enterprise Berhad. It has been found out that Hai-O-Enterprise Berhad has better
financial condition than Atlan Holdings Berhad because of improved profitability, efficiency and leverage
positions. On the other hand, it is found that Atlan is struggling to maintain its competitive position in the
Malaysian retail sector in contrast to Hai-O-Enterprise Berhad due to declining profitability and increased
blockage of working capital in the form of trade receivables. Moreover, the share price analysis clearly
indicates that Hai-O-Enterprise is a better investment opportunity for the investors, as investing in the
shares of the organisation would maximise their overall return on investment.
2ANALYSIS OF FINANCIAL PERFORMANCE
Table of Contents
Introduction:................................................................................................................................................3
Analysis of the financial statements using ratio analysis:............................................................................3
Changes in the capital structure:..................................................................................................................6
Evaluation of performance from the viewpoint of the creditors:.................................................................7
Suggestions to changes in financial strategy from the viewpoint of CFO:...................................................7
Share price analysis from the perspective of investors:...............................................................................8
Investment recommendation:.......................................................................................................................9
Conclusion:..................................................................................................................................................9
References:................................................................................................................................................10
Appendices:...............................................................................................................................................12
3ANALYSIS OF FINANCIAL PERFORMANCE
Introduction:
The current report aims to analyse the financial markets and investment opportunities in
Malaysia. For meeting the purpose of this assignment, two listed companies in Bursa Malaysia have been
chosen and they include Atlan Holdings Berhad and Hai-O Enterprise Berhad. These two organisations
are operating in the Malaysian retail sector having sound reputation in the market. In order to analyse
investment opportunities, ratio analysis is used for evaluating the financial condition of the two selected
organisations. Based on the outcomes, they are evaluated further from the perspectives of the creditors
and capital structure. After such evaluation, suggestions are provided to both the organisations from the
viewpoints of their CFOs. Finally, share price analysis is conducted to provide investment
recommendations in the two organisations.
Analysis of the financial statements using ratio analysis:
For analysing the financial statements of Atlan Holdings Berhad and Hai-O-Enterprise Berhad,
ratio analysis technique is used, as it provides a complete picture of the financial condition of an
organisation (Brigham et al. 2016). The following types of ratios are used for evaluation of the financial
condition of the two above-mentioned organisations:
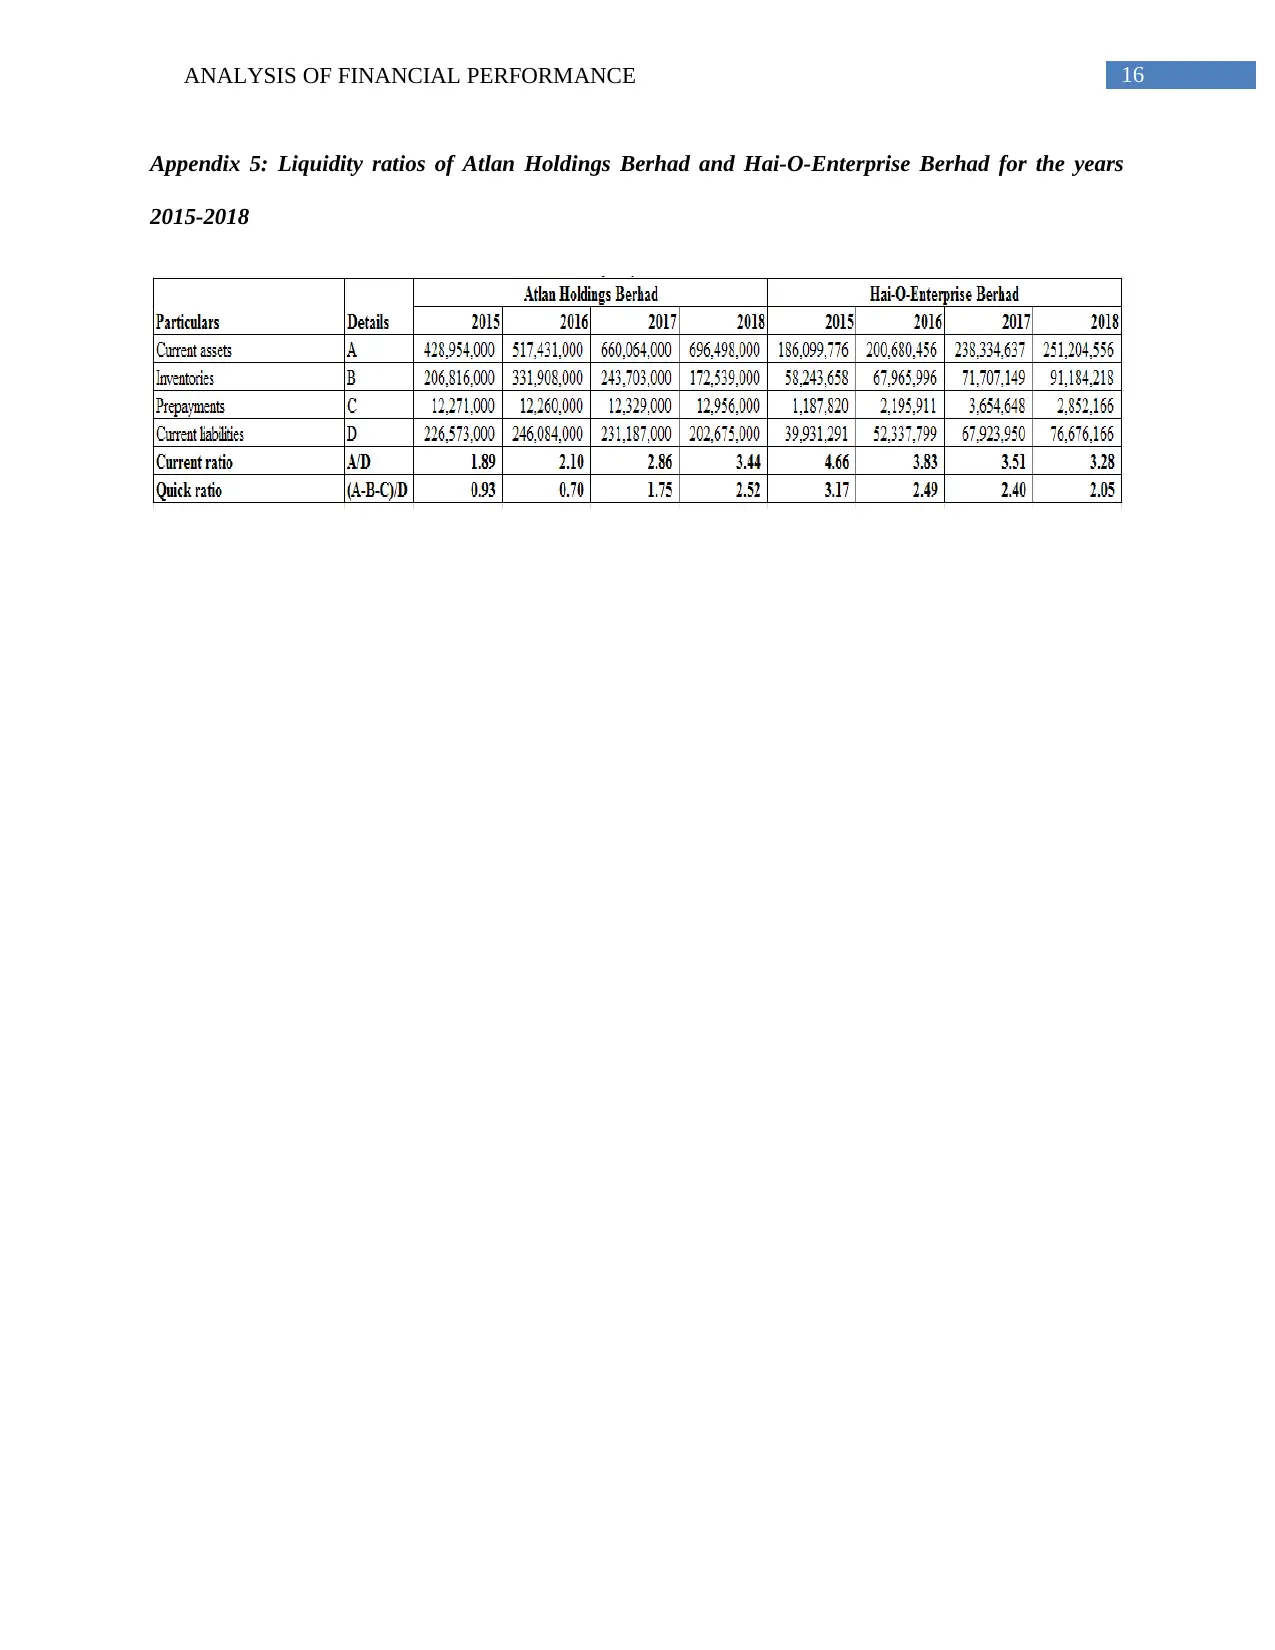
Liquidity ratios:
For assessing the liquidity position of Atlan Holdings Berhad and Hai-O-Enterprise Berhad, the
two liquidity ratios used include current ratio and quick ratio (Refer to Appendices, Appendix 5). It has
been found that current ratio is observed to increase from 1.89 in 2015 to 3.44 in 2018 for Atlan Holdings
Berhad, while the same tends to decline from 4.66 in 2015 to 3.28 in 2018. For Atlan, the ratio has
increased due to significant rise in cash and bank balances along with accounts receivable while trade and
other payables have fallen over the years (Atlan.com.my 2018). In case of Hai-O-Enterprise Berhad,
significant rise in trade and other payables is the main reason behind the fall in current ratio. However, it
is noteworthy to mention that the ratio for both companies is well above the ideal standard of 2
Introduction:
The current report aims to analyse the financial markets and investment opportunities in
Malaysia. For meeting the purpose of this assignment, two listed companies in Bursa Malaysia have been
chosen and they include Atlan Holdings Berhad and Hai-O Enterprise Berhad. These two organisations
are operating in the Malaysian retail sector having sound reputation in the market. In order to analyse
investment opportunities, ratio analysis is used for evaluating the financial condition of the two selected
organisations. Based on the outcomes, they are evaluated further from the perspectives of the creditors
and capital structure. After such evaluation, suggestions are provided to both the organisations from the
viewpoints of their CFOs. Finally, share price analysis is conducted to provide investment
recommendations in the two organisations.
Analysis of the financial statements using ratio analysis:
For analysing the financial statements of Atlan Holdings Berhad and Hai-O-Enterprise Berhad,
ratio analysis technique is used, as it provides a complete picture of the financial condition of an
organisation (Brigham et al. 2016). The following types of ratios are used for evaluation of the financial
condition of the two above-mentioned organisations:
Liquidity ratios:
For assessing the liquidity position of Atlan Holdings Berhad and Hai-O-Enterprise Berhad, the
two liquidity ratios used include current ratio and quick ratio (Refer to Appendices, Appendix 5). It has
been found that current ratio is observed to increase from 1.89 in 2015 to 3.44 in 2018 for Atlan Holdings
Berhad, while the same tends to decline from 4.66 in 2015 to 3.28 in 2018. For Atlan, the ratio has
increased due to significant rise in cash and bank balances along with accounts receivable while trade and
other payables have fallen over the years (Atlan.com.my 2018). In case of Hai-O-Enterprise Berhad,
significant rise in trade and other payables is the main reason behind the fall in current ratio. However, it
is noteworthy to mention that the ratio for both companies is well above the ideal standard of 2
Secure Best Marks with AI Grader
Need help grading? Try our AI Grader for instant feedback on your assignments.
4ANALYSIS OF FINANCIAL PERFORMANCE
(Buehlmaier and Whited 2018). This implies that both organisations have large amount of idle cash,
which could not be invested to improve existing business operations.
The same trends are observed in case of quick ratio, which is a better measure of liquidity, as it
excludes prepayments and inventories while analysing the liquidity position of an organisation
(Damodaran 2016). In case of Atlan Holdings Berhad, it has minimised its stock holdings over the year,
while Hai-O-Enterprise Berhad has increased its inventory base. Therefore, both the organisations are
needed to minimise their trade receivables so as to increase their cash and bank balances.
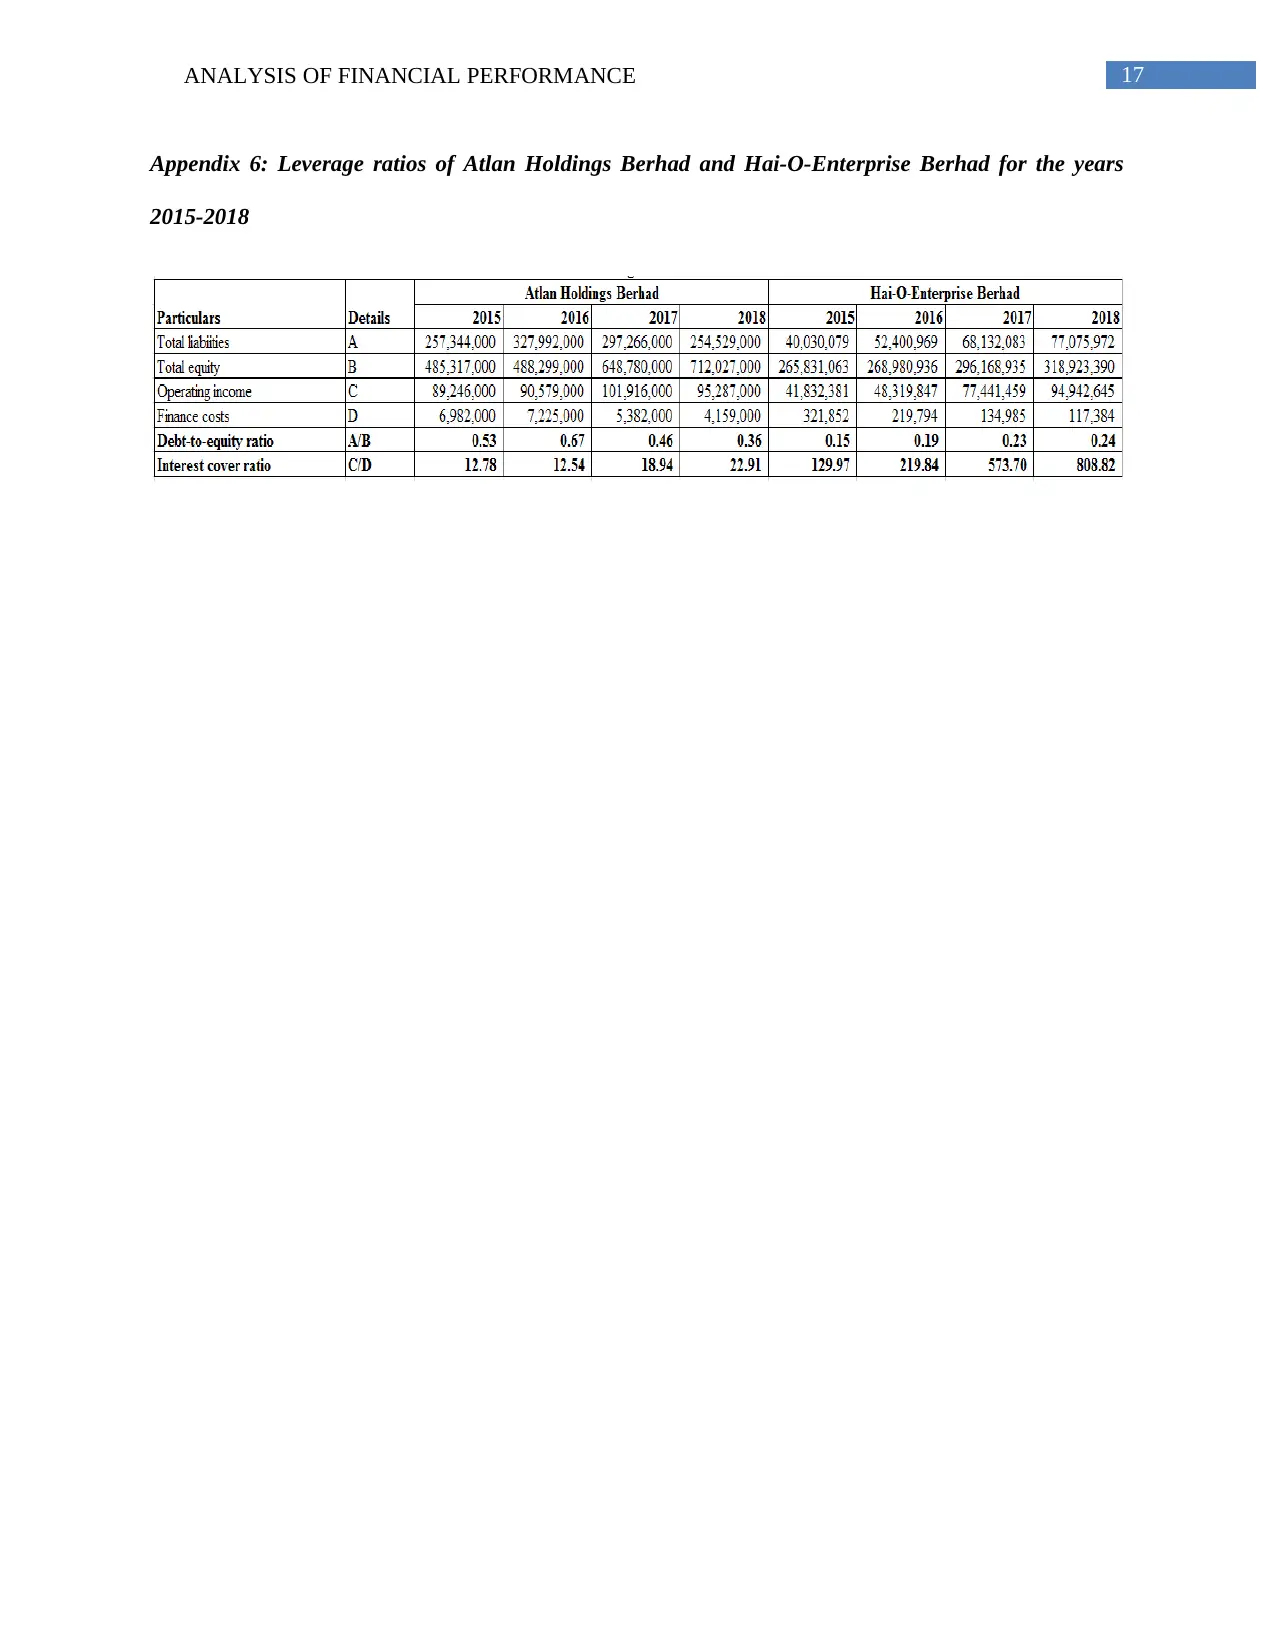
Leverage ratios:
In order to dissect the leverage position of Atlan Holdings Berhad and Hai-O-Enterprise Berhad,
the two liquidity ratios used include debt-to-equity ratio and interest cover ratio (Refer to Appendices,
Appendix 6). For Atlan, debt-to-equity ratio has increased in 2016 after which decline could be observed
consecutively in the next two years. The reason is that the organisation has minimised its debt funding for
avoiding interest payments and it has issued additional equity shares to obtain more funds from the
market. For Hai-O-Enterprise Berhad, ratio has increased over the years from 0.15 in 2015 to 0.24 in
2018 (Hai-o.com.my 2018). However, the ratio is still lower than Atlan, as it has focused on increasing its
retained earnings for future investment operations. A lower ratio is always favourable, as it denotes less
risky position of the organisation (Dokas, Giokas and Tsamis 2014).
On the other hand, interest cover ratio helps in determining whether an organisation possesses the
capability of supporting additional debt. In case of Atlan, the ratio has increased from 12.78 in 2015 to
22.91 in 2018 and for Hai-O-Enterprise; the ratio is significantly higher from 129.97 in 2015 to 808.82 in
2018. The ratio for both the organisations is well above the ideal standard of 1, which denotes that they
have adequate amount of money for settling their interest payments on debt. Therefore, in terms of
leverage, Hai-O-Enterprise has better leverage position than Atlan in the Malaysian retail sector.
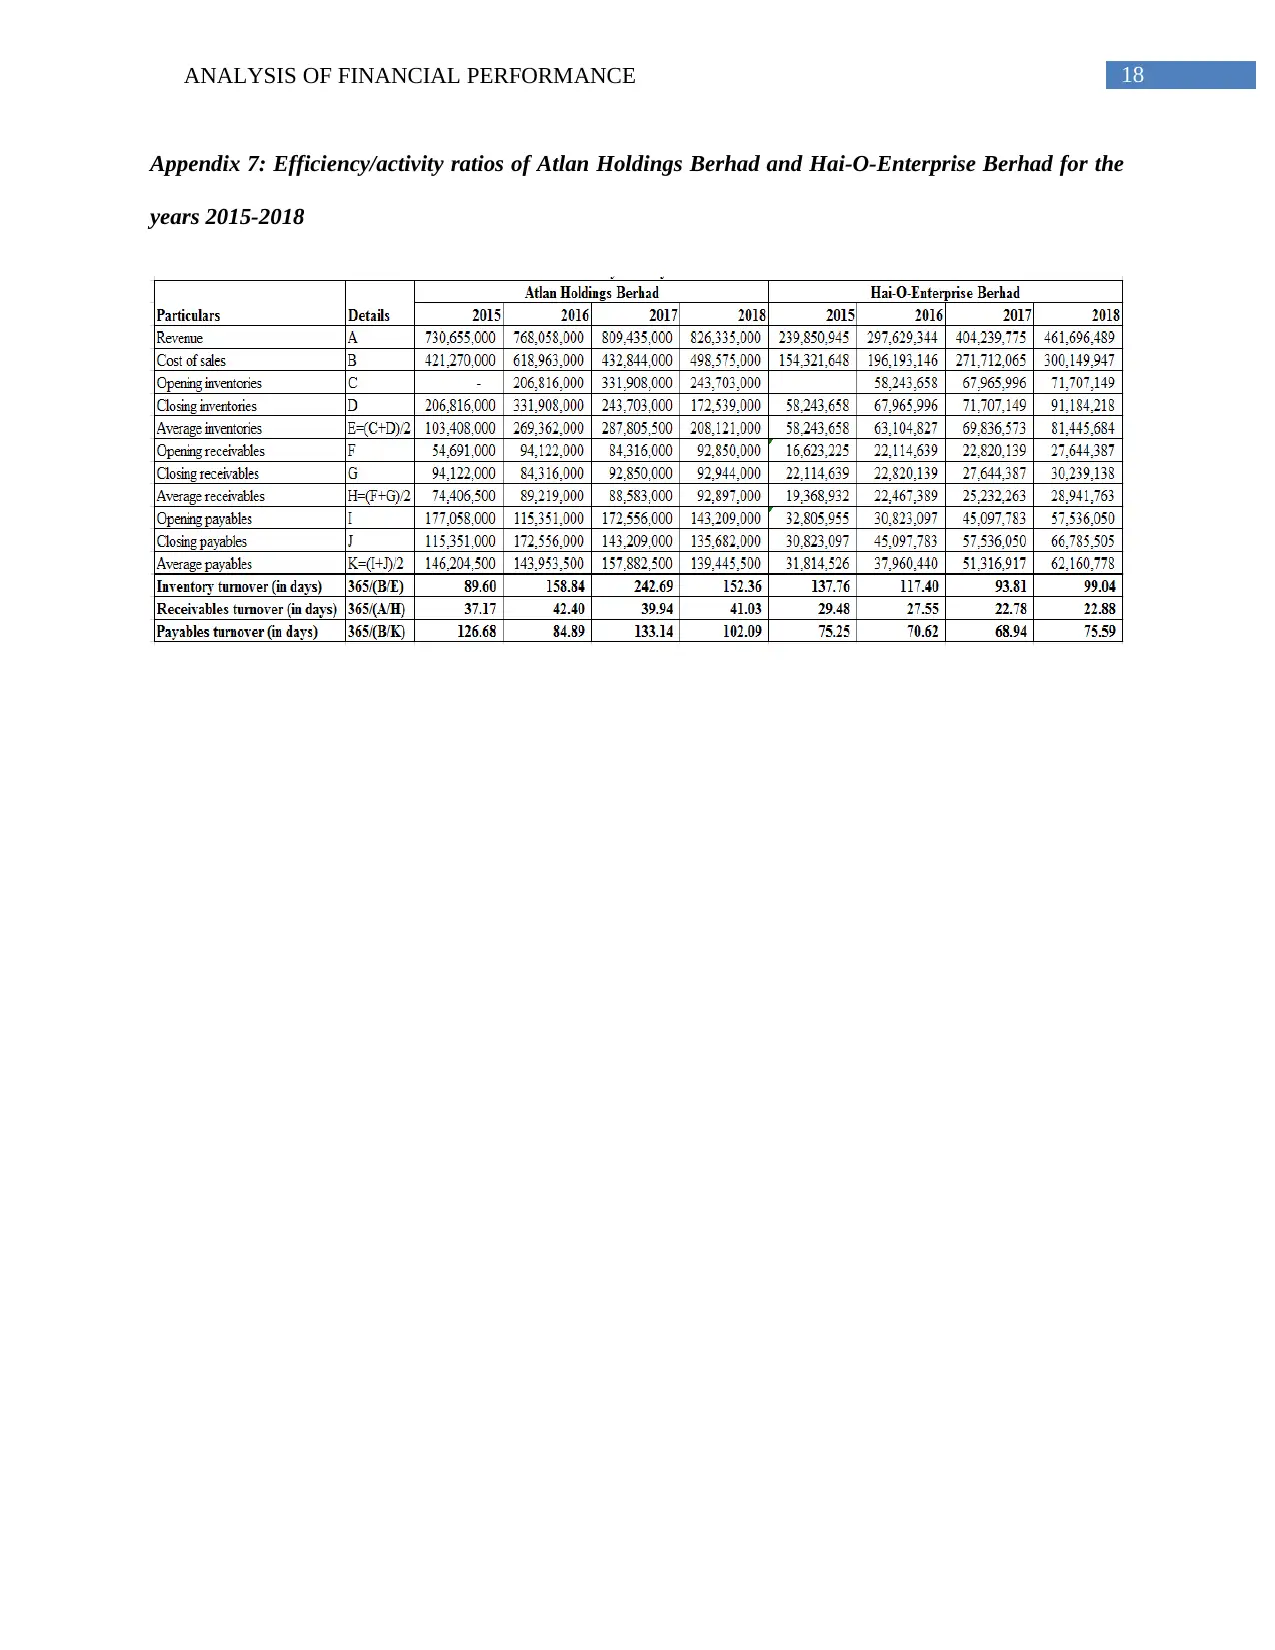
Efficiency/activity ratios:
In order to dissect the efficiency position of Atlan Holdings Berhad and Hai-O-Enterprise
Berhad, the three liquidity ratios used include inventory turnover, receivables turnover and payables
(Buehlmaier and Whited 2018). This implies that both organisations have large amount of idle cash,
which could not be invested to improve existing business operations.
The same trends are observed in case of quick ratio, which is a better measure of liquidity, as it
excludes prepayments and inventories while analysing the liquidity position of an organisation
(Damodaran 2016). In case of Atlan Holdings Berhad, it has minimised its stock holdings over the year,
while Hai-O-Enterprise Berhad has increased its inventory base. Therefore, both the organisations are
needed to minimise their trade receivables so as to increase their cash and bank balances.
Leverage ratios:
In order to dissect the leverage position of Atlan Holdings Berhad and Hai-O-Enterprise Berhad,
the two liquidity ratios used include debt-to-equity ratio and interest cover ratio (Refer to Appendices,
Appendix 6). For Atlan, debt-to-equity ratio has increased in 2016 after which decline could be observed
consecutively in the next two years. The reason is that the organisation has minimised its debt funding for
avoiding interest payments and it has issued additional equity shares to obtain more funds from the
market. For Hai-O-Enterprise Berhad, ratio has increased over the years from 0.15 in 2015 to 0.24 in
2018 (Hai-o.com.my 2018). However, the ratio is still lower than Atlan, as it has focused on increasing its
retained earnings for future investment operations. A lower ratio is always favourable, as it denotes less
risky position of the organisation (Dokas, Giokas and Tsamis 2014).
On the other hand, interest cover ratio helps in determining whether an organisation possesses the
capability of supporting additional debt. In case of Atlan, the ratio has increased from 12.78 in 2015 to
22.91 in 2018 and for Hai-O-Enterprise; the ratio is significantly higher from 129.97 in 2015 to 808.82 in
2018. The ratio for both the organisations is well above the ideal standard of 1, which denotes that they
have adequate amount of money for settling their interest payments on debt. Therefore, in terms of
leverage, Hai-O-Enterprise has better leverage position than Atlan in the Malaysian retail sector.
Efficiency/activity ratios:
In order to dissect the efficiency position of Atlan Holdings Berhad and Hai-O-Enterprise
Berhad, the three liquidity ratios used include inventory turnover, receivables turnover and payables
5ANALYSIS OF FINANCIAL PERFORMANCE
turnover ratios (Refer to Appendices, Appendix 7). Inventory turnover for Atlan is observed to increase
from 2015 to 2017; however, it has fallen in 2018. The reason is that the company has reduced its
inventory base in the year 2018 due to which adequate sales could be generated. On the other hand, the
ratio has fallen from 137.76 days in 2015 to 93.81 days in 2017 for Hai-O-Enterprise Berhad; however, it
has risen again to 99.04 days in 2018. This is because the organisation has experienced an increase in cost
of sales due to which excessive focus has been kept on increasing inventory base, which is lower than the
actual market demand. It is evident that despite such increase, Hai-O-Enterprise Berhad is still managing
to release its inventory at a faster rate than Atlan Holdings Berhad.
Receivables turnover ratio helps in identifying the time taken by an organisation to collect the
amounts owed from the debtors (Hoskin, Fizzell and Cherry 2014). The trend is fluctuating for Atlan
Holdings Berhad and in case of Hai-O-Enterprise Berhad, decline could be observed until 2017 with a
slight decrease in 2018. However, the ratio for Hai-O-Enterprise Berhad is comparatively lower than
Atlan Holdings Berhad, as it has adopted a stringent debtor policy in order to maximise its availability of
working capital.
Payables turnover ratio, on the contrary, is an efficiency ratio that assesses the ability of an
organisation in repaying its debts owed to the suppliers and the creditors (Ibn-Homaid and Tijani 2015).
The trend has been fluctuating for Atlan Holdings Limited and in case of Hai-O-Enterprise Berhad, the
ratio has declined until 2017 followed by an increase in the next year. A higher figure is deemed to be
favourable, as it implies that the organisation has managed to retain cash in hand for a longer timeframe.
However, excessive delay in settling creditor payments might result in loss of trust for the creditors and
they might not be willing to extend payments terms in future (Jordan 2014). Thus, in terms of payables
turnover, Hai-O-Enterprise Berhad is enjoying competitive advantage over Atlan Holdings Berhad in the
retail sector of Malaysia.
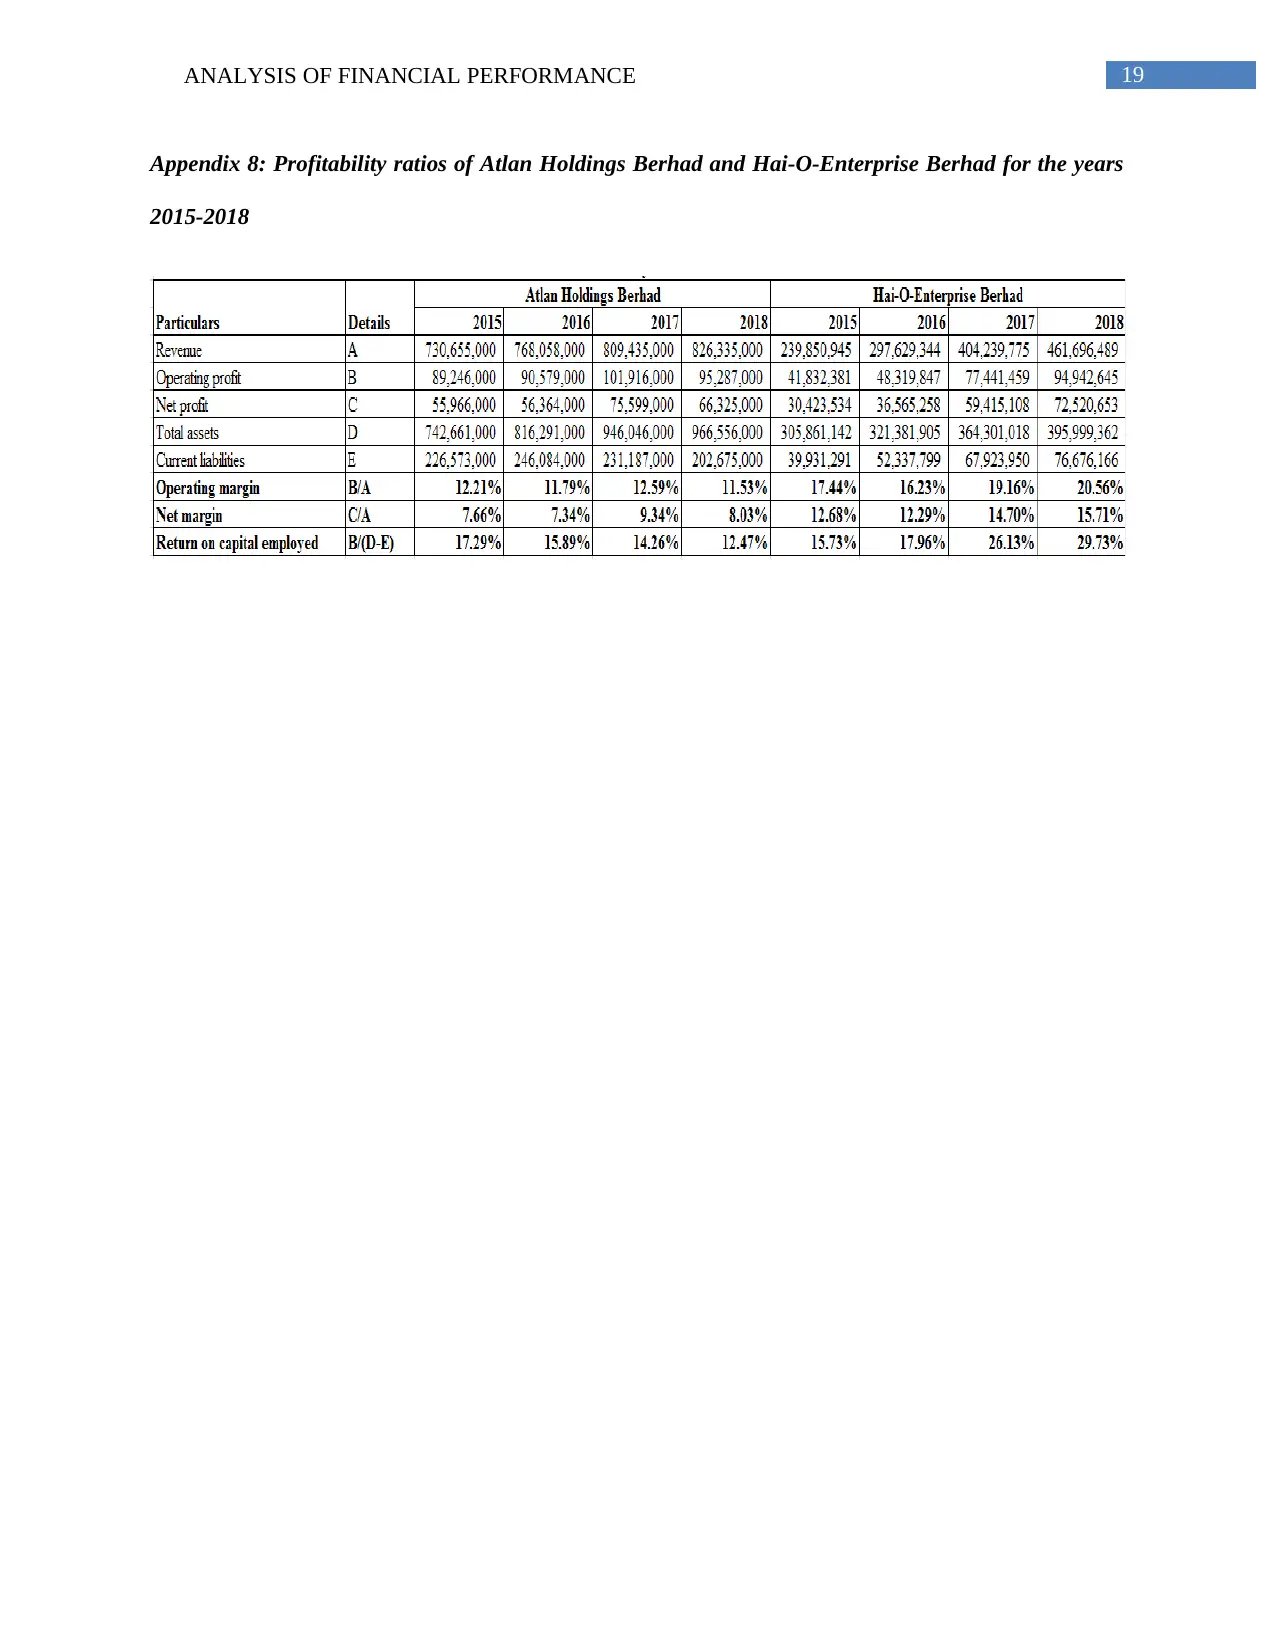
Profitability ratios:
For assessing the profitability position of Atlan Holdings Berhad and Hai-O-Enterprise Berhad,
the two liquidity ratios used include operating margin, net margin and return on capital employed (Refer
turnover ratios (Refer to Appendices, Appendix 7). Inventory turnover for Atlan is observed to increase
from 2015 to 2017; however, it has fallen in 2018. The reason is that the company has reduced its
inventory base in the year 2018 due to which adequate sales could be generated. On the other hand, the
ratio has fallen from 137.76 days in 2015 to 93.81 days in 2017 for Hai-O-Enterprise Berhad; however, it
has risen again to 99.04 days in 2018. This is because the organisation has experienced an increase in cost
of sales due to which excessive focus has been kept on increasing inventory base, which is lower than the
actual market demand. It is evident that despite such increase, Hai-O-Enterprise Berhad is still managing
to release its inventory at a faster rate than Atlan Holdings Berhad.
Receivables turnover ratio helps in identifying the time taken by an organisation to collect the
amounts owed from the debtors (Hoskin, Fizzell and Cherry 2014). The trend is fluctuating for Atlan
Holdings Berhad and in case of Hai-O-Enterprise Berhad, decline could be observed until 2017 with a
slight decrease in 2018. However, the ratio for Hai-O-Enterprise Berhad is comparatively lower than
Atlan Holdings Berhad, as it has adopted a stringent debtor policy in order to maximise its availability of
working capital.
Payables turnover ratio, on the contrary, is an efficiency ratio that assesses the ability of an
organisation in repaying its debts owed to the suppliers and the creditors (Ibn-Homaid and Tijani 2015).
The trend has been fluctuating for Atlan Holdings Limited and in case of Hai-O-Enterprise Berhad, the
ratio has declined until 2017 followed by an increase in the next year. A higher figure is deemed to be
favourable, as it implies that the organisation has managed to retain cash in hand for a longer timeframe.
However, excessive delay in settling creditor payments might result in loss of trust for the creditors and
they might not be willing to extend payments terms in future (Jordan 2014). Thus, in terms of payables
turnover, Hai-O-Enterprise Berhad is enjoying competitive advantage over Atlan Holdings Berhad in the
retail sector of Malaysia.
Profitability ratios:
For assessing the profitability position of Atlan Holdings Berhad and Hai-O-Enterprise Berhad,
the two liquidity ratios used include operating margin, net margin and return on capital employed (Refer
6ANALYSIS OF FINANCIAL PERFORMANCE
to Appendices, Appendix 8). In terms of operating margin, the ratio has been comparatively higher for
Hai-O-Enterprise Berhad, as it has generated income from other sources despite the rise in operating
expenses. On the other hand, Atlan has encountered a considerable increase in raw materials and
consumables used, due to which operating margin has declined in 2018. The situation is found to be
similar for both organisations in terms of net margin as well, which clearly implies that Hai-O-Enterprise
Berhad has generated more profit than Atlan in the Malaysian retail sector. Finally, in terms of return on
capital employed, the ratio has declined over the years for Atlan and the situation is just the opposite for
Hai-O-Enterprise Berhad. This is because the latter has increased its asset base compared to the other,
which resulted in additional return on capital (Miller-Nobles, Mattison and Matsumura 2016). Hence, in
terms of profitability, the position of Hai-O-Enterprise Berhad is found to be better than Atlan in the retail
sector of Malaysia.
Changes in the capital structure:
The capital structure of Atlan Holdings and Hai-O-Enterprise Berhad has been analysed and has
been observed that there have been certain changes in their debt and equity funding proportion. From
analysing the changes in capital structure, it is gathered that there have been certain changes regarding the
ways in which these companies develop growth strategies trough using funds (Zainudin and Hashim
2016). In case of Atlan Holdings it has been observed that the company has made changes in its capital
structure and havedecreased its debt funding in order to avoid its interest payments. This change took
place because of the reason that it issued some additional equity shares in order to attain funds from the
market. However, in case of Hai-O-Enterprise Berhad it has been observed that its capital structure had
changes and focussed on making increased debt funding. However, such change is minor and it does not
indicate that the company can face any financial risk (Vogel 2014). This is because the company is
focussed on increasing its retained earnings for all its future investment business operations.
Paraphrase This Document
Need a fresh take? Get an instant paraphrase of this document with our AI Paraphraser
7ANALYSIS OF FINANCIAL PERFORMANCE
Evaluation of performance from the viewpoint of the creditors:
The performance for Atlan Holdings and Hai-O-Enterprise Berhad has been analysed from the
creditors’ point of view. The payables turnover ratio results of these two companies revealed that this
ratio for Atlan Holdings indicates an increasing trend and for Hai-O-Enterprise Berhad Company, this is
observed to be a decreasing trend. In case of Atlan, it can be said that the company is paying its suppliers
in a rapid manner which reveals its improved financial condition (Uechi et al. 2015). The company also
made timely payments after entering into a sales agreement. On the other hand, for Hai-O-Enterprise
Berhad it is evidenced that the company is not that efficient to pay its suppliers on time which signifies its
weakening financial situation. This situation took place as the company’s business activities became slow
and the company is involved in negotiating with its suppliers regarding absorbing some sales and service
tax to deal with weak market condition.
Suggestions to changes in financial strategy from the viewpoint of CFO:
Certain change suggestions regarding financial strategies are offered for Atlan Holdings and Hai-
O-Enterprise Berhad Company in their financial strategies for enhancing their performance position in the
industry. Both the companies recommended shifting its focus from maintaining an increased inventory
and considering maintaining their working capital in cash (Mousa 2015). In case of Atlan Holdings the
company must focus on developing stringent repayment policies for debtors so that they make their
payments on time and do not extend their repayment term on aa regular basis. This can enhance business
everyday business activities of the company.
8ANALYSIS OF FINANCIAL PERFORMANCE
Share price analysis from the perspective of investors:
01/01/2014
01/05/2014
01/09/2014
01/01/2015
01/05/2015
01/09/2015
01/01/2016
01/05/2016
01/09/2016
01/01/2017
01/05/2017
01/09/2017
01/01/2018
01/05/2018
01/09/2018
0
1
2
3
4
5
6
Share Price Performance
Share price of Atlan Holdings
Berhad
Share price of Hai-O-Enterprise
Berhad
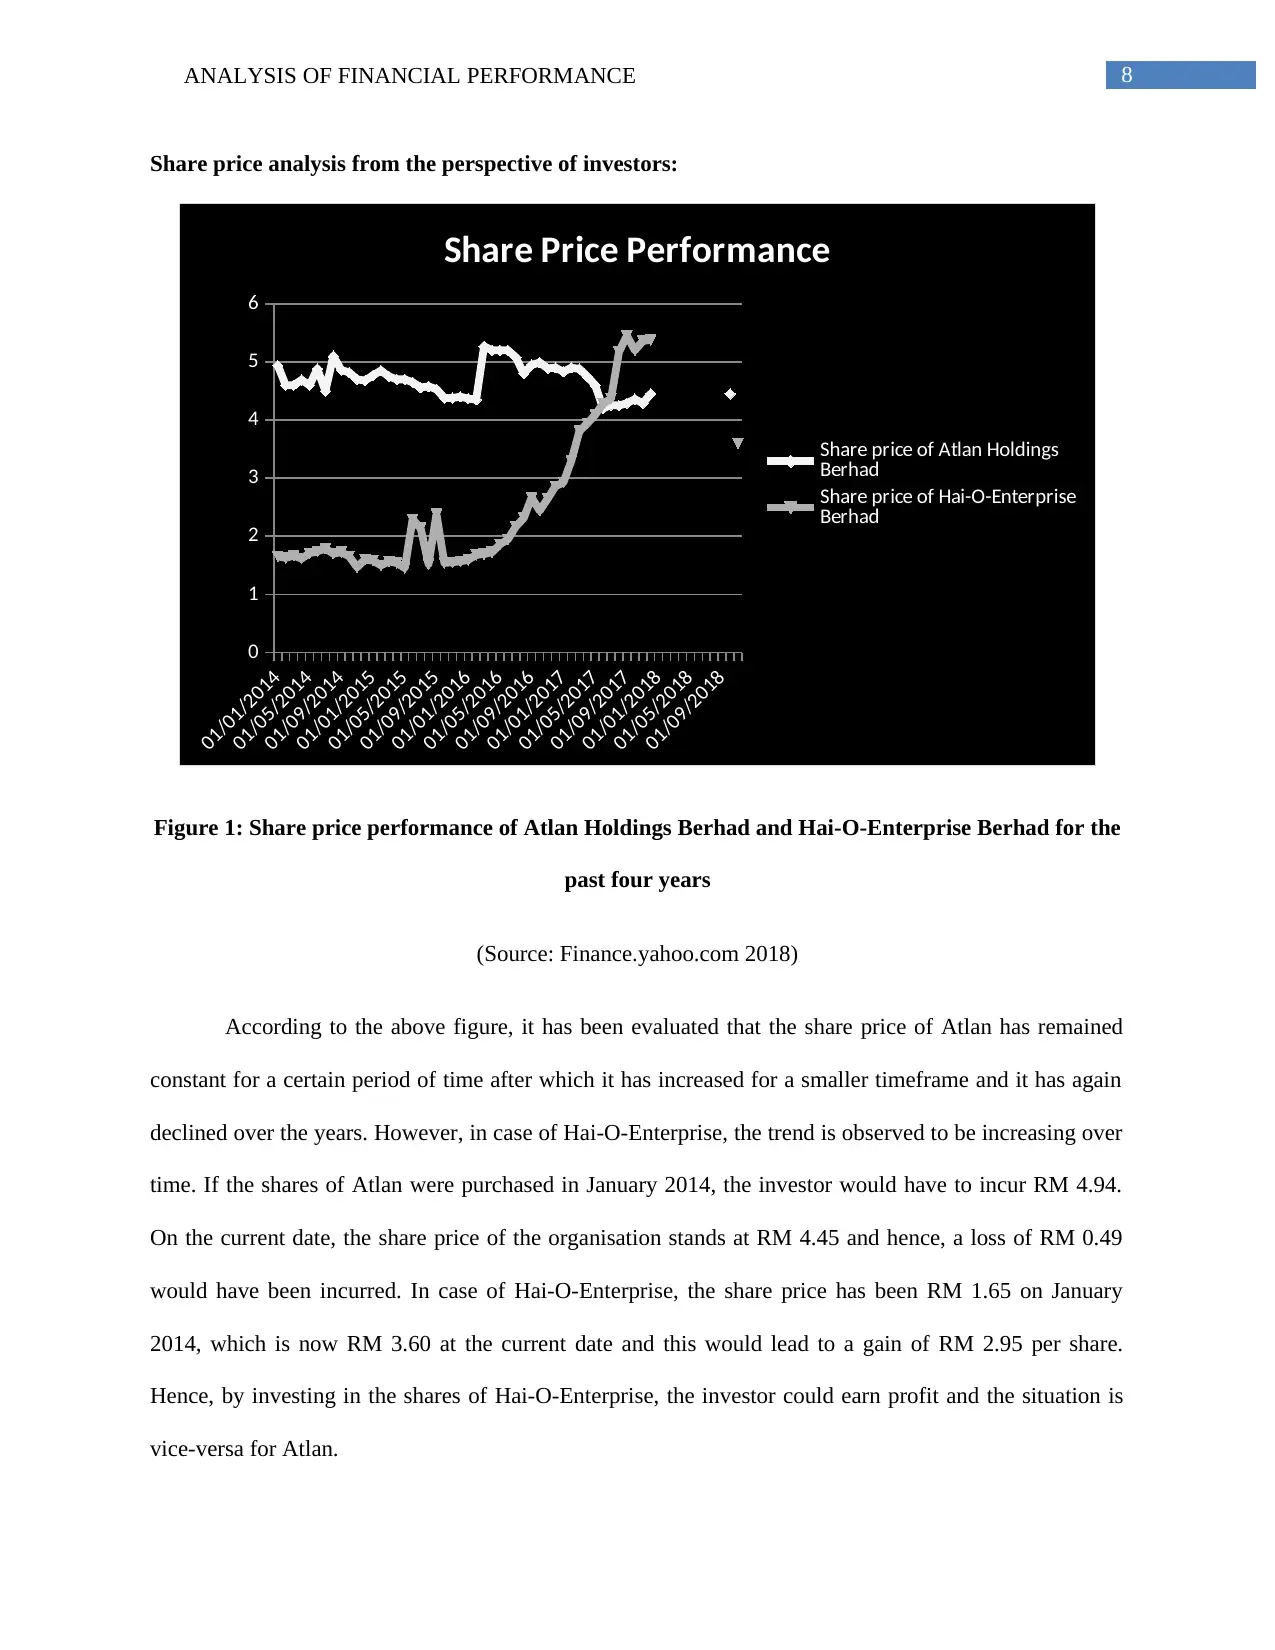
Figure 1: Share price performance of Atlan Holdings Berhad and Hai-O-Enterprise Berhad for the
past four years
(Source: Finance.yahoo.com 2018)
According to the above figure, it has been evaluated that the share price of Atlan has remained
constant for a certain period of time after which it has increased for a smaller timeframe and it has again
declined over the years. However, in case of Hai-O-Enterprise, the trend is observed to be increasing over
time. If the shares of Atlan were purchased in January 2014, the investor would have to incur RM 4.94.
On the current date, the share price of the organisation stands at RM 4.45 and hence, a loss of RM 0.49
would have been incurred. In case of Hai-O-Enterprise, the share price has been RM 1.65 on January
2014, which is now RM 3.60 at the current date and this would lead to a gain of RM 2.95 per share.
Hence, by investing in the shares of Hai-O-Enterprise, the investor could earn profit and the situation is
vice-versa for Atlan.
Share price analysis from the perspective of investors:
01/01/2014
01/05/2014
01/09/2014
01/01/2015
01/05/2015
01/09/2015
01/01/2016
01/05/2016
01/09/2016
01/01/2017
01/05/2017
01/09/2017
01/01/2018
01/05/2018
01/09/2018
0
1
2
3
4
5
6
Share Price Performance
Share price of Atlan Holdings
Berhad
Share price of Hai-O-Enterprise
Berhad
Figure 1: Share price performance of Atlan Holdings Berhad and Hai-O-Enterprise Berhad for the
past four years
(Source: Finance.yahoo.com 2018)
According to the above figure, it has been evaluated that the share price of Atlan has remained
constant for a certain period of time after which it has increased for a smaller timeframe and it has again
declined over the years. However, in case of Hai-O-Enterprise, the trend is observed to be increasing over
time. If the shares of Atlan were purchased in January 2014, the investor would have to incur RM 4.94.
On the current date, the share price of the organisation stands at RM 4.45 and hence, a loss of RM 0.49
would have been incurred. In case of Hai-O-Enterprise, the share price has been RM 1.65 on January
2014, which is now RM 3.60 at the current date and this would lead to a gain of RM 2.95 per share.
Hence, by investing in the shares of Hai-O-Enterprise, the investor could earn profit and the situation is
vice-versa for Atlan.
9ANALYSIS OF FINANCIAL PERFORMANCE
Investment recommendation:
The above discussion clearly makes it apparent that Hai-O-Enterprise Berhad is a favourable
investment opportunity for any investor to maximise the level of earnings. This is supported by upward
trend in financial ratios and positive share price performance of the organisation. On the other hand, it is
found that Atlan is struggling to maintain its competitive position in the Malaysian retail sector in contrast
to Hai-O-Enterprise Berhad due to declining profitability and increased blockage of working capital in the
form of trade receivables. Moreover, the share price has declined over the years and therefore, it is
recommended to invest some money in the shares of Hai-O-Enterprise Berhad for maximising return on
investment.
Conclusion:
It is identified from the above evaluation that Hai-O-Enterprise Berhad has better financial
condition than Atlan Holdings Berhad because of improved profitability, efficiency and leverage
positions. The only deficiency is found in the liquidity position and accordingly, recommendations are
provided from the perspective of CFO. Moreover, the share price analysis clearly indicates that Hai-O-
Enterprise is a better investment opportunity for the investors, as investing in the shares of the
organisation would maximise their overall return on investment.
Secure Best Marks with AI Grader
Need help grading? Try our AI Grader for instant feedback on your assignments.
10ANALYSIS OF FINANCIAL PERFORMANCE
References:
Atlan.com.my., 2018. Atlan Holdings Bhd. [online] Available at:
http://www.atlan.com.my/annualreport.html [Accessed 1 Nov. 2018].
Brigham, E.F., Ehrhardt, M.C., Nason, R.R. and Gessaroli, J., 2016. Financial Managment: Theory And
Practice, Canadian Edition. Nelson Education.
Buehlmaier, M.M. and Whited, T.M., 2018. Are financial constraints priced? Evidence from textual
analysis. The Review of Financial Studies, 31(7), pp.2693-2728.
Damodaran, A., 2016. Damodaran on valuation: security analysis for investment and corporate
finance (Vol. 324). John Wiley & Sons.
Dokas, I., Giokas, D. and Tsamis, A., 2014. Liquidity efficiency in the Greek listed firms: a financial ratio
based on data envelopment analysis. International Journal of Corporate Finance and Accounting
(IJCFA), 1(1), pp.40-59.
Finance.yahoo.com., 2018. [online] Available at: https://finance.yahoo.com/quote/7668.KL/ [Accessed 1
Nov. 2018].
Finance.yahoo.com., 2018. [online] Available at: https://finance.yahoo.com/quote/7048.KL/ [Accessed 1
Nov. 2018].
Hai-o.com.my., 2018. Hai-O Enterprise Berhad. [online] Available at:
https://www.hai-o.com.my/bursa.php [Accessed 1 Nov. 2018].
Hoskin, R.E., Fizzell, M.R. and Cherry, D.C., 2014. Financial Accounting: a user perspective. Wiley
Global Education.
11ANALYSIS OF FINANCIAL PERFORMANCE
Ibn-Homaid, N.T. and Tijani, I.A., 2015. Financial analysis of a construction company in Saudi
Arabia. International Journal of Construction Engineering and Management, 4(3), pp.80-86.
Jordan, B., 2014. Fundamentals of investments. McGraw-Hill Higher Education.
Miller-Nobles, T.L., Mattison, B. and Matsumura, E.M., 2016. Horngren's Financial & Managerial
Accounting: The Managerial Chapters. Pearson.
Mousa, G.A., 2015. Financial Ratios versus Data Envelopment Analysis: The Efficiency Assessment of
Banking Sector in Bahrain Bourse. International Journal of Business and Statistical Analysis, 2(2), pp.75-
84.
Uechi, L., Akutsu, T., Stanley, H.E., Marcus, A.J. and Kenett, D.Y., 2015. Sector dominance ratio
analysis of financial markets. Physica A: Statistical Mechanics and its Applications, 421, pp.488-509.
Vogel, H.L., 2014. Entertainment industry economics: A guide for financial analysis. Cambridge
University Press.
Zainudin, E.F. and Hashim, H.A., 2016. Detecting fraudulent financial reporting using financial
ratio. Journal of Financial Reporting and Accounting, 14(2), pp.266-278.
12ANALYSIS OF FINANCIAL PERFORMANCE
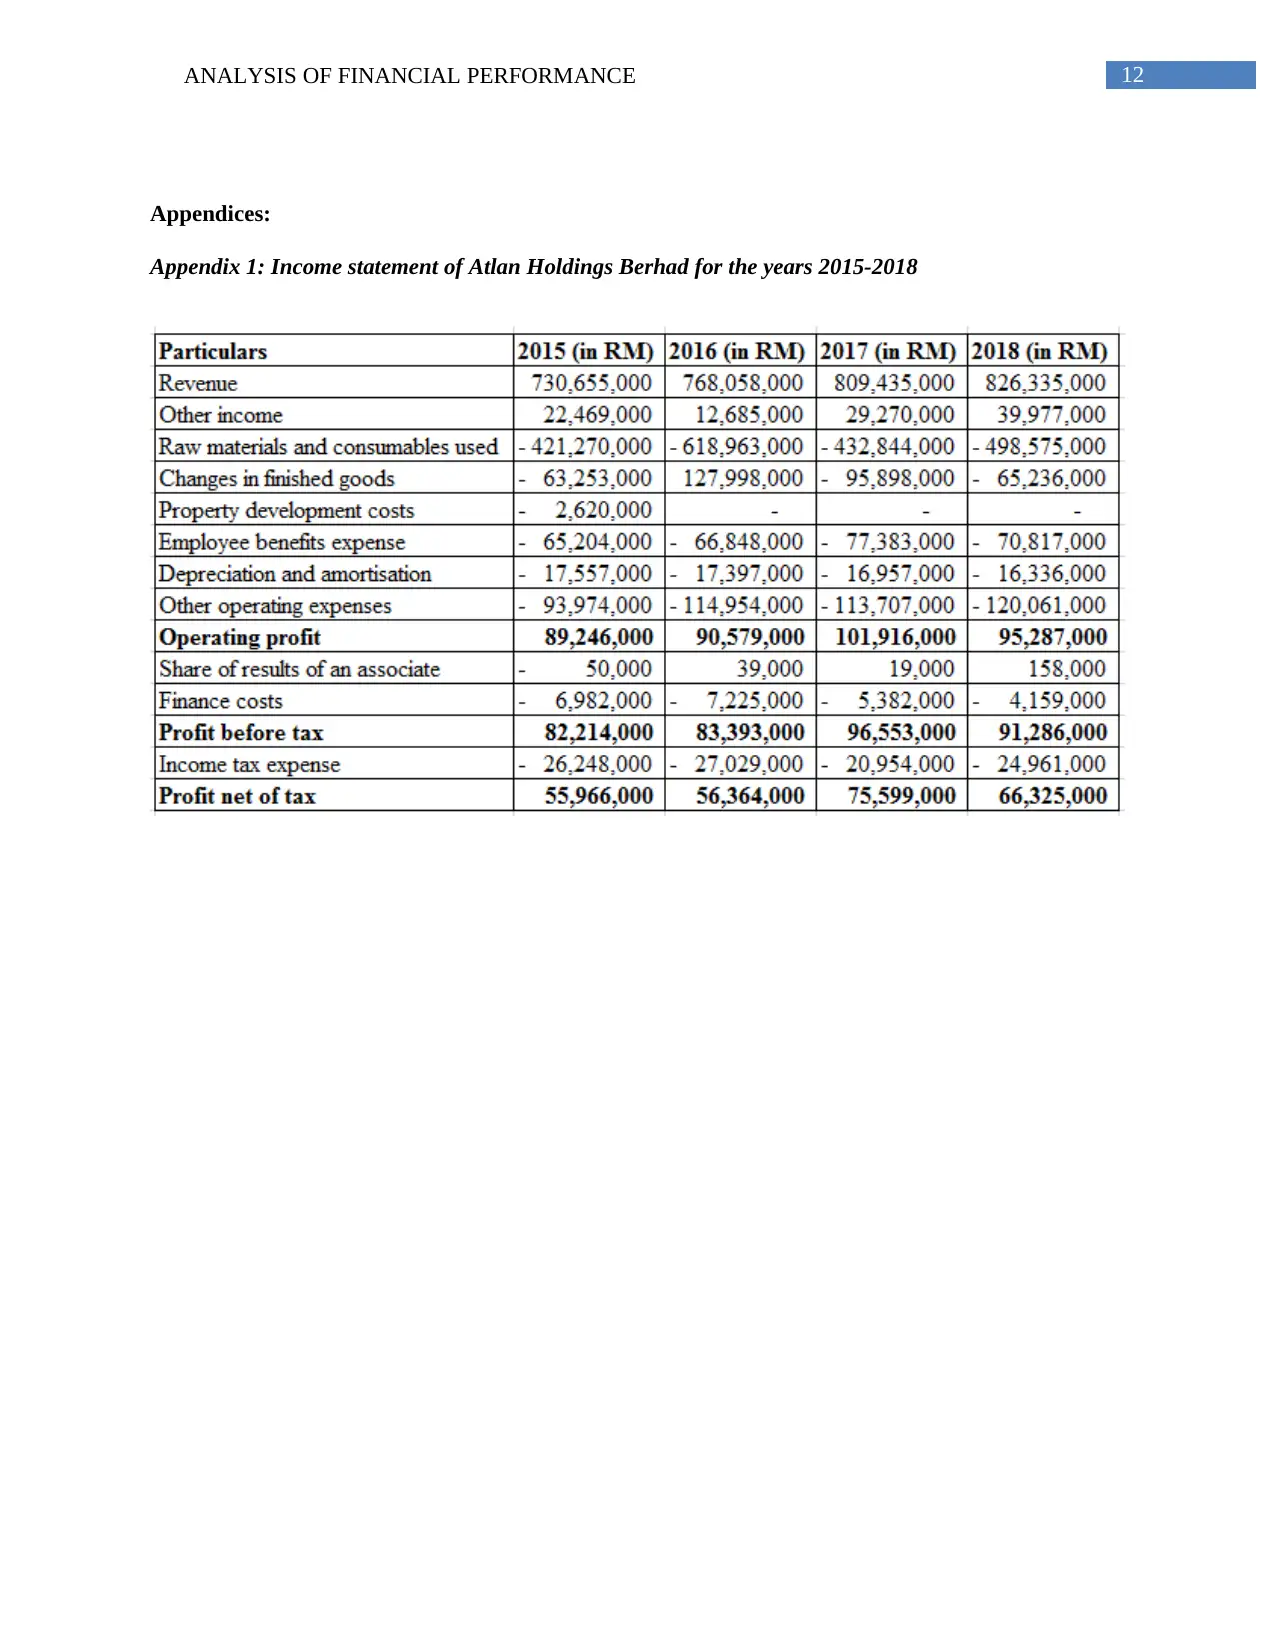
Appendices:
Appendix 1: Income statement of Atlan Holdings Berhad for the years 2015-2018
Appendices:
Appendix 1: Income statement of Atlan Holdings Berhad for the years 2015-2018
Paraphrase This Document
Need a fresh take? Get an instant paraphrase of this document with our AI Paraphraser
13ANALYSIS OF FINANCIAL PERFORMANCE
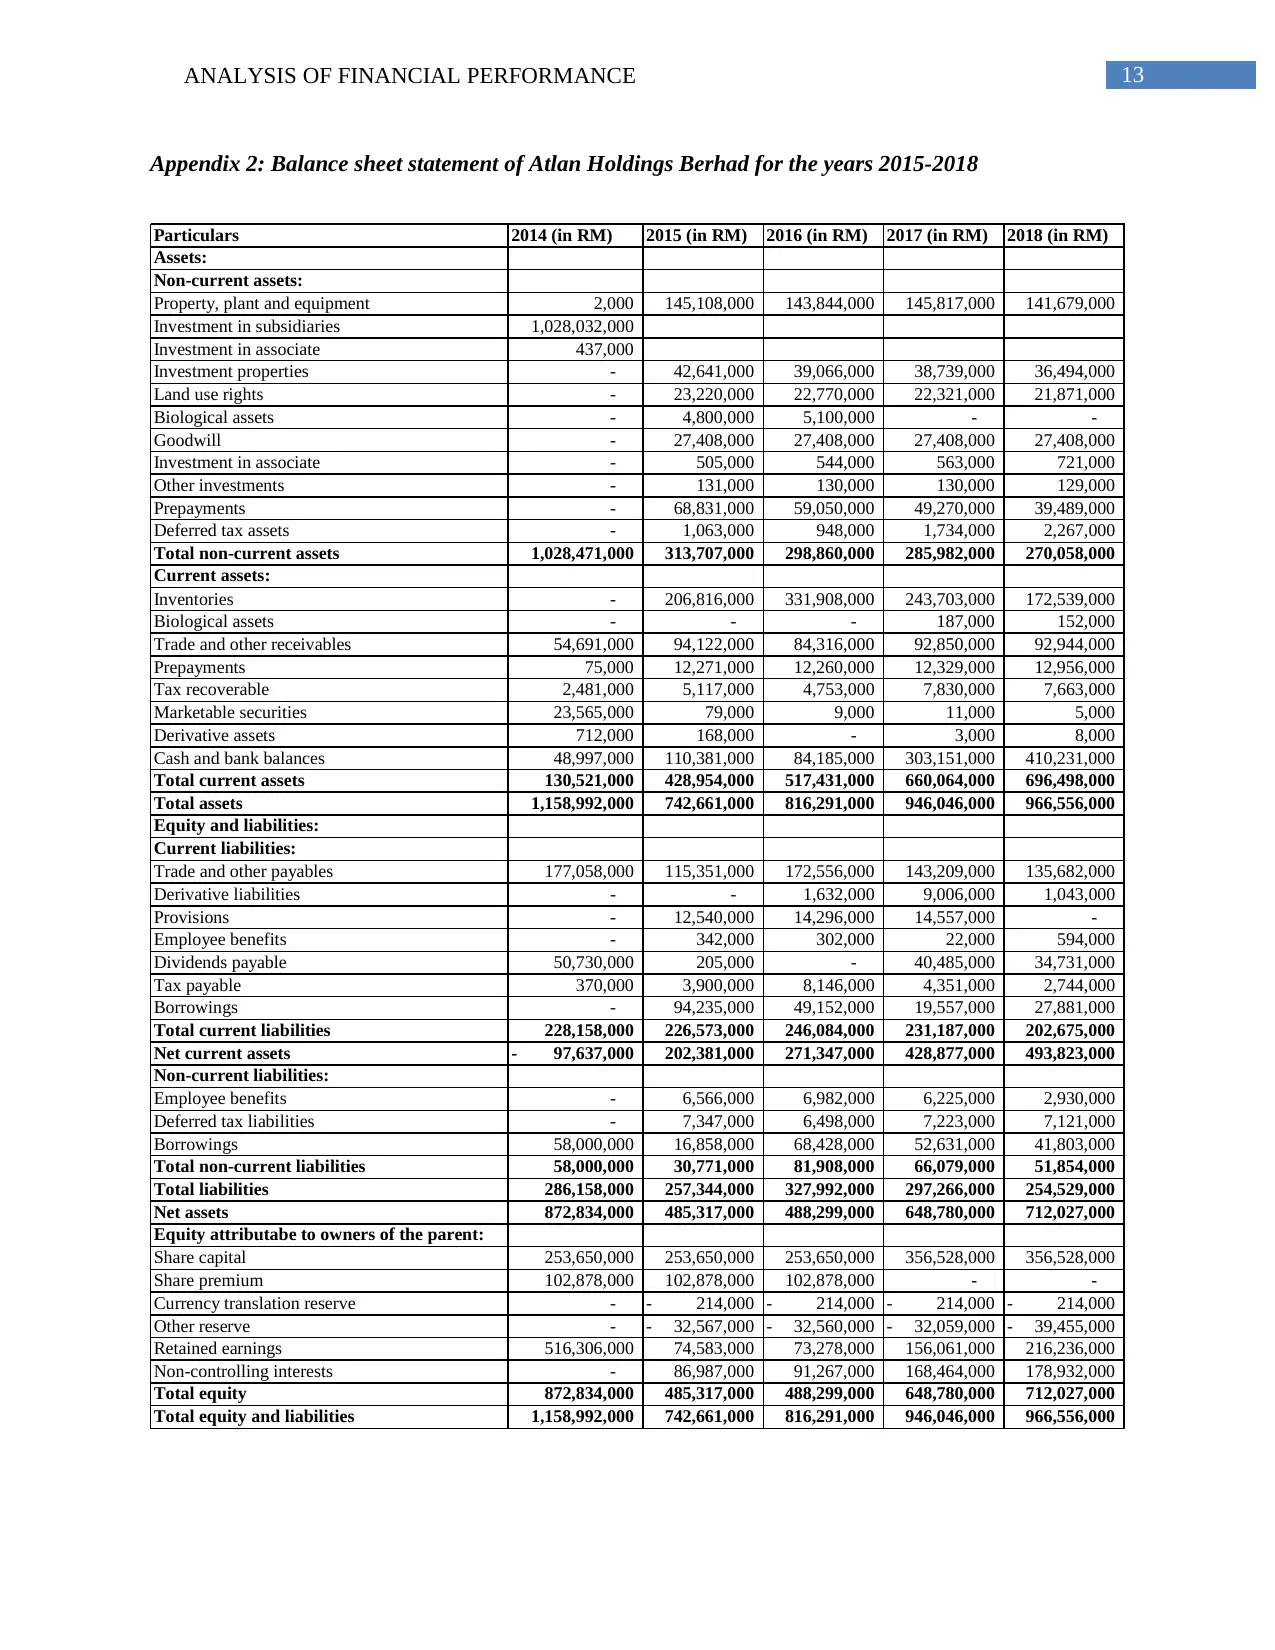
Appendix 2: Balance sheet statement of Atlan Holdings Berhad for the years 2015-2018
Particulars 2014 (in RM) 2015 (in RM) 2016 (in RM) 2017 (in RM) 2018 (in RM)
Assets:
Non-current assets:
Property, plant and equipment 2,000 145,108,000 143,844,000 145,817,000 141,679,000
Investment in subsidiaries 1,028,032,000
Investment in associate 437,000
Investment properties - 42,641,000 39,066,000 38,739,000 36,494,000
Land use rights - 23,220,000 22,770,000 22,321,000 21,871,000
Biological assets - 4,800,000 5,100,000 - -
Goodwill - 27,408,000 27,408,000 27,408,000 27,408,000
Investment in associate - 505,000 544,000 563,000 721,000
Other investments - 131,000 130,000 130,000 129,000
Prepayments - 68,831,000 59,050,000 49,270,000 39,489,000
Deferred tax assets - 1,063,000 948,000 1,734,000 2,267,000
Total non-current assets 1,028,471,000 313,707,000 298,860,000 285,982,000 270,058,000
Current assets:
Inventories - 206,816,000 331,908,000 243,703,000 172,539,000
Biological assets - - - 187,000 152,000
Trade and other receivables 54,691,000 94,122,000 84,316,000 92,850,000 92,944,000
Prepayments 75,000 12,271,000 12,260,000 12,329,000 12,956,000
Tax recoverable 2,481,000 5,117,000 4,753,000 7,830,000 7,663,000
Marketable securities 23,565,000 79,000 9,000 11,000 5,000
Derivative assets 712,000 168,000 - 3,000 8,000
Cash and bank balances 48,997,000 110,381,000 84,185,000 303,151,000 410,231,000
Total current assets 130,521,000 428,954,000 517,431,000 660,064,000 696,498,000
Total assets 1,158,992,000 742,661,000 816,291,000 946,046,000 966,556,000
Equity and liabilities:
Current liabilities:
Trade and other payables 177,058,000 115,351,000 172,556,000 143,209,000 135,682,000
Derivative liabilities - - 1,632,000 9,006,000 1,043,000
Provisions - 12,540,000 14,296,000 14,557,000 -
Employee benefits - 342,000 302,000 22,000 594,000
Dividends payable 50,730,000 205,000 - 40,485,000 34,731,000
Tax payable 370,000 3,900,000 8,146,000 4,351,000 2,744,000
Borrowings - 94,235,000 49,152,000 19,557,000 27,881,000
Total current liabilities 228,158,000 226,573,000 246,084,000 231,187,000 202,675,000
Net current assets 97,637,000- 202,381,000 271,347,000 428,877,000 493,823,000
Non-current liabilities:
Employee benefits - 6,566,000 6,982,000 6,225,000 2,930,000
Deferred tax liabilities - 7,347,000 6,498,000 7,223,000 7,121,000
Borrowings 58,000,000 16,858,000 68,428,000 52,631,000 41,803,000
Total non-current liabilities 58,000,000 30,771,000 81,908,000 66,079,000 51,854,000
Total liabilities 286,158,000 257,344,000 327,992,000 297,266,000 254,529,000
Net assets 872,834,000 485,317,000 488,299,000 648,780,000 712,027,000
Equity attributabe to owners of the parent:
Share capital 253,650,000 253,650,000 253,650,000 356,528,000 356,528,000
Share premium 102,878,000 102,878,000 102,878,000 - -
Currency translation reserve - 214,000- 214,000- 214,000- 214,000-
Other reserve - 32,567,000- 32,560,000- 32,059,000- 39,455,000-
Retained earnings 516,306,000 74,583,000 73,278,000 156,061,000 216,236,000
Non-controlling interests - 86,987,000 91,267,000 168,464,000 178,932,000
Total equity 872,834,000 485,317,000 488,299,000 648,780,000 712,027,000
Total equity and liabilities 1,158,992,000 742,661,000 816,291,000 946,046,000 966,556,000
14ANALYSIS OF FINANCIAL PERFORMANCE
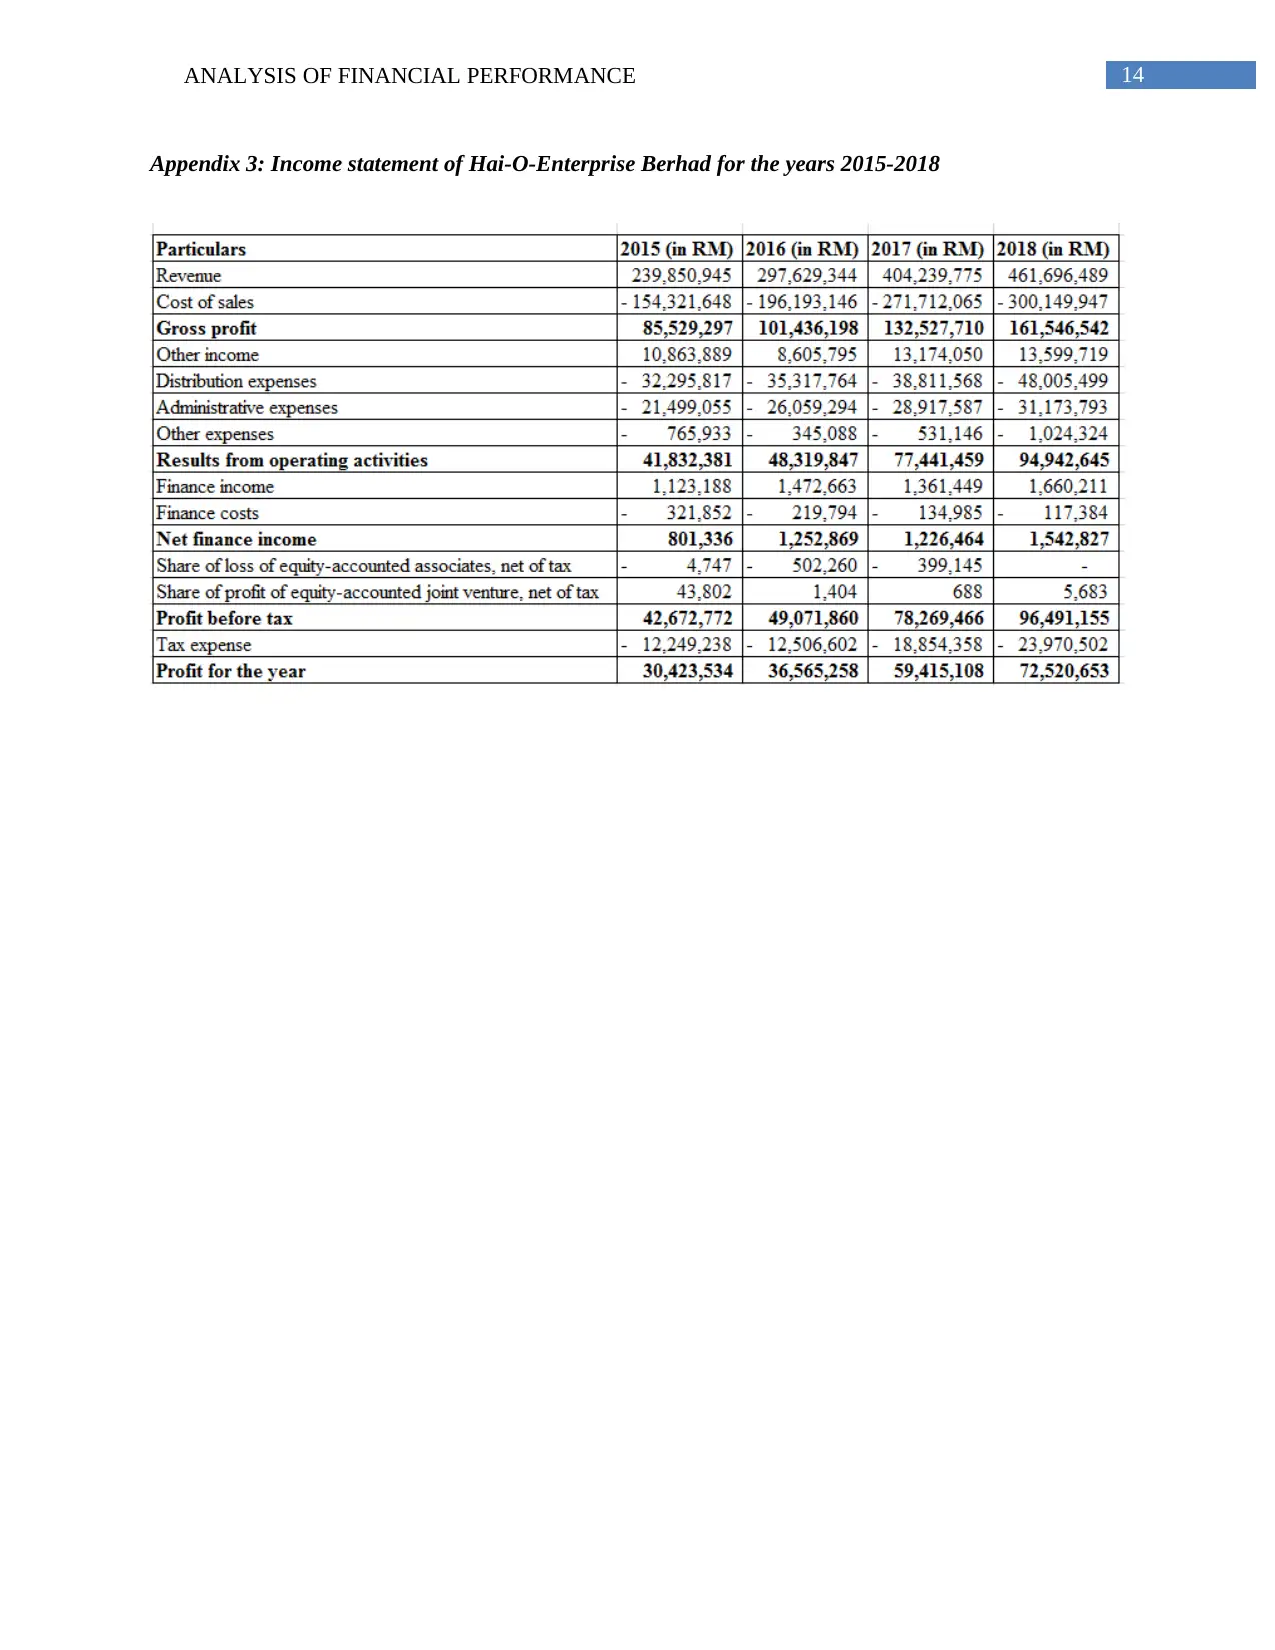
Appendix 3: Income statement of Hai-O-Enterprise Berhad for the years 2015-2018
Appendix 3: Income statement of Hai-O-Enterprise Berhad for the years 2015-2018
15ANALYSIS OF FINANCIAL PERFORMANCE
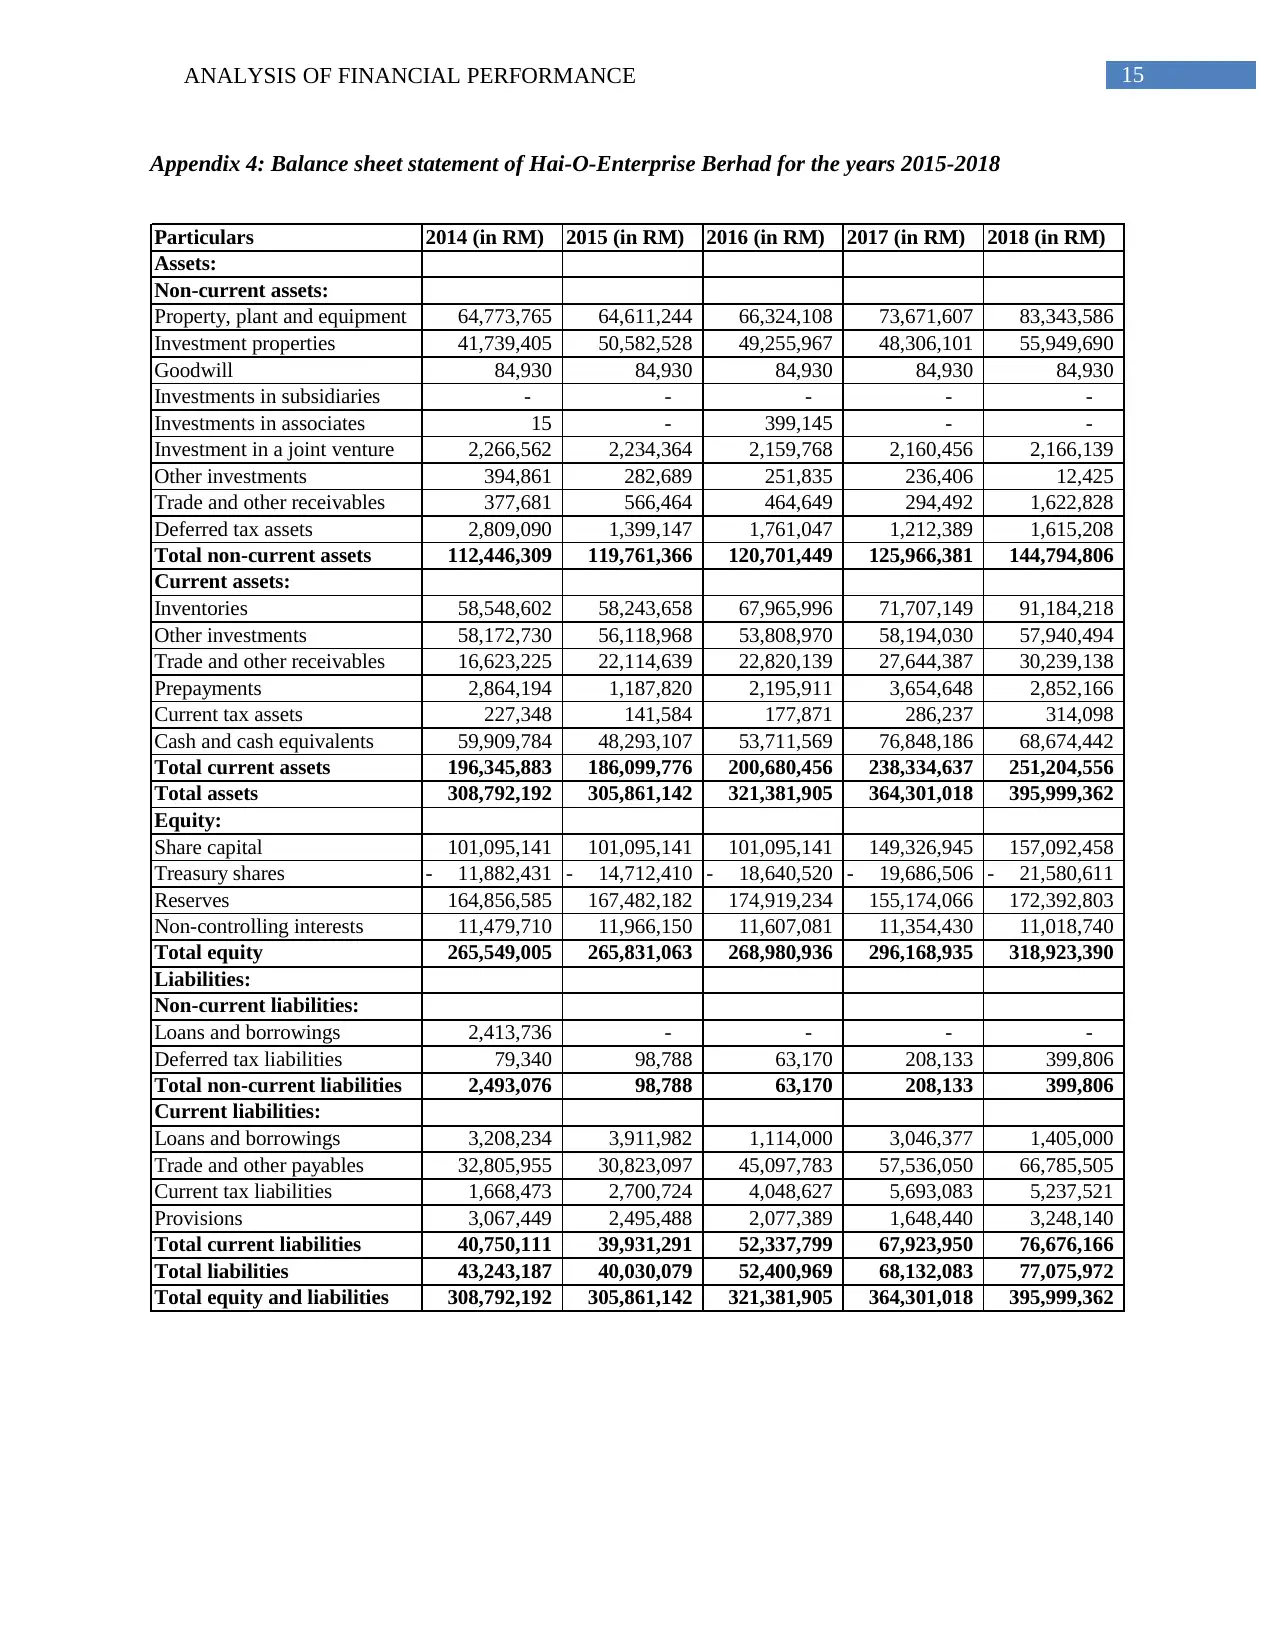
Appendix 4: Balance sheet statement of Hai-O-Enterprise Berhad for the years 2015-2018
Particulars 2014 (in RM) 2015 (in RM) 2016 (in RM) 2017 (in RM) 2018 (in RM)
Assets:
Non-current assets:
Property, plant and equipment 64,773,765 64,611,244 66,324,108 73,671,607 83,343,586
Investment properties 41,739,405 50,582,528 49,255,967 48,306,101 55,949,690
Goodwill 84,930 84,930 84,930 84,930 84,930
Investments in subsidiaries - - - - -
Investments in associates 15 - 399,145 - -
Investment in a joint venture 2,266,562 2,234,364 2,159,768 2,160,456 2,166,139
Other investments 394,861 282,689 251,835 236,406 12,425
Trade and other receivables 377,681 566,464 464,649 294,492 1,622,828
Deferred tax assets 2,809,090 1,399,147 1,761,047 1,212,389 1,615,208
Total non-current assets 112,446,309 119,761,366 120,701,449 125,966,381 144,794,806
Current assets:
Inventories 58,548,602 58,243,658 67,965,996 71,707,149 91,184,218
Other investments 58,172,730 56,118,968 53,808,970 58,194,030 57,940,494
Trade and other receivables 16,623,225 22,114,639 22,820,139 27,644,387 30,239,138
Prepayments 2,864,194 1,187,820 2,195,911 3,654,648 2,852,166
Current tax assets 227,348 141,584 177,871 286,237 314,098
Cash and cash equivalents 59,909,784 48,293,107 53,711,569 76,848,186 68,674,442
Total current assets 196,345,883 186,099,776 200,680,456 238,334,637 251,204,556
Total assets 308,792,192 305,861,142 321,381,905 364,301,018 395,999,362
Equity:
Share capital 101,095,141 101,095,141 101,095,141 149,326,945 157,092,458
Treasury shares 11,882,431- 14,712,410- 18,640,520- 19,686,506- 21,580,611-
Reserves 164,856,585 167,482,182 174,919,234 155,174,066 172,392,803
Non-controlling interests 11,479,710 11,966,150 11,607,081 11,354,430 11,018,740
Total equity 265,549,005 265,831,063 268,980,936 296,168,935 318,923,390
Liabilities:
Non-current liabilities:
Loans and borrowings 2,413,736 - - - -
Deferred tax liabilities 79,340 98,788 63,170 208,133 399,806
Total non-current liabilities 2,493,076 98,788 63,170 208,133 399,806
Current liabilities:
Loans and borrowings 3,208,234 3,911,982 1,114,000 3,046,377 1,405,000
Trade and other payables 32,805,955 30,823,097 45,097,783 57,536,050 66,785,505
Current tax liabilities 1,668,473 2,700,724 4,048,627 5,693,083 5,237,521
Provisions 3,067,449 2,495,488 2,077,389 1,648,440 3,248,140
Total current liabilities 40,750,111 39,931,291 52,337,799 67,923,950 76,676,166
Total liabilities 43,243,187 40,030,079 52,400,969 68,132,083 77,075,972
Total equity and liabilities 308,792,192 305,861,142 321,381,905 364,301,018 395,999,362
Secure Best Marks with AI Grader
Need help grading? Try our AI Grader for instant feedback on your assignments.
16ANALYSIS OF FINANCIAL PERFORMANCE
Appendix 5: Liquidity ratios of Atlan Holdings Berhad and Hai-O-Enterprise Berhad for the years
2015-2018
Appendix 5: Liquidity ratios of Atlan Holdings Berhad and Hai-O-Enterprise Berhad for the years
2015-2018
17ANALYSIS OF FINANCIAL PERFORMANCE
Appendix 6: Leverage ratios of Atlan Holdings Berhad and Hai-O-Enterprise Berhad for the years
2015-2018
Appendix 6: Leverage ratios of Atlan Holdings Berhad and Hai-O-Enterprise Berhad for the years
2015-2018
18ANALYSIS OF FINANCIAL PERFORMANCE
Appendix 7: Efficiency/activity ratios of Atlan Holdings Berhad and Hai-O-Enterprise Berhad for the
years 2015-2018
Appendix 7: Efficiency/activity ratios of Atlan Holdings Berhad and Hai-O-Enterprise Berhad for the
years 2015-2018
Paraphrase This Document
Need a fresh take? Get an instant paraphrase of this document with our AI Paraphraser
19ANALYSIS OF FINANCIAL PERFORMANCE
Appendix 8: Profitability ratios of Atlan Holdings Berhad and Hai-O-Enterprise Berhad for the years
2015-2018
Appendix 8: Profitability ratios of Atlan Holdings Berhad and Hai-O-Enterprise Berhad for the years
2015-2018
1 out of 20
Related Documents


Your All-in-One AI-Powered Toolkit for Academic Success.
+13062052269
info@desklib.com
Available 24*7 on WhatsApp / Email
![[object Object]](/_next/static/media/star-bottom.7253800d.svg)
Unlock your academic potential
© 2024 | Zucol Services PVT LTD | All rights reserved.