Financial Performance Analysis: Sainsbury Plc vs. Marks & Spencer
VerifiedAdded on 2022/12/15
|17
|4085
|1
Report
AI Summary
This report presents a comprehensive financial performance analysis of Sainsbury Plc, a leading UK supermarket chain. The analysis begins with an examination of key financial ratios, comparing Sainsbury's performance with its competitor, Marks & Spencer, for the years 2018 and 2019. The report delves into liquidity, profitability, efficiency, and investment ratios, providing a detailed comparative evaluation of both companies' financial health. Furthermore, the report evaluates the Kaplan and Norton Balanced Scorecard as a strategic management system for Sainsbury Plc, analyzing its application across financial, customer, internal business process, and learning & growth perspectives. Finally, the report provides a critical analysis of the benefits and challenges associated with adopting Integrated Reporting (IR) for Sainsbury Plc, offering insights into the strategic advantages and potential hurdles of this reporting framework. The report concludes with a summary of findings and recommendations based on the financial performance analysis and strategic considerations.
Financial Performance Management
1
1
Paraphrase This Document
Need a fresh take? Get an instant paraphrase of this document with our AI Paraphraser
Contents
Contents...........................................................................................................................................2
INTRODUCTION...........................................................................................................................3
MAIN BODY...................................................................................................................................3
Question 1........................................................................................................................................3
Ratio Analysis:.................................................................................................................................8
Question 2........................................................................................................................................9
Evaluation of Kaplan and Norton’s Balanced Scorecard as a Strategic Management System9
Question 3......................................................................................................................................12
Brief description regarding benefits & challenges adopting integrated reporting...............12
CONCLUSION..............................................................................................................................15
REFERENCES..............................................................................................................................16
2
INTRODUCTION
Financial performance management is mechanism of a business managing and
monitoring financial results around the board. Financial performance management's core goal is
to equate real outcomes to budgets as well as projections and make changes as required. The
primary aim of the Financial Performance Management, also recognized as the Corporate
Performance Management, is to assist organizations in maximizing sales and operating profits
while also increasing shareholder wealth by connecting strategy to strategies and implementation
through main processes such as goal-setting, modelling, preparing, estimating, close
management including financial reporting (Albuhisi and Abdallah, 2018).
In a nutshell, the adhesive that connects all of an organization's diverse financial as well as
strategic details to strengthen strategy as well as decision-making and illuminate the path
forward. Financial output is subjective indicator of a company's ability to produce sales from its
main mode of operation. The concept is often used as a broad indicator of a company’s overall
fiscal health over time. Financial output is used by analysts and stakeholders to compare related
companies in same industry or even to compare markets or sectors as a whole.
In this report, Sainsbury Plc has been chosen. Sainsbury Plc is UK based corporation
which is leading operator of supermarket of UK. Whereas in the study, second company chosen
is Mark and Spenser, which is one of top competitor of Sainsbury plc and leading supermarket
chain in UK. The study consists of three tasks, the first one covers application of ratio analysis
approach to analyse overall financial performance of these two corporations as well as a
comprehensive comparative evaluation. The second task covers evaluation of Kaplan and
Norton’s Balanced Scorecard as a Strategic Management System of Sainsbury plc. While the
third task of study covers critical analysis of key benefits and challenges of adopting Integrated
Reporting (IR) of Sainsbury plc.
MAIN BODY
Question 1
Sainsbury Plc Ratio 2018-2019
2018 2019
Liquidity ratios
3
⊘ This is a preview!⊘
Do you want full access?
Subscribe today to unlock all pages.
Trusted by 1+ million students worldwide
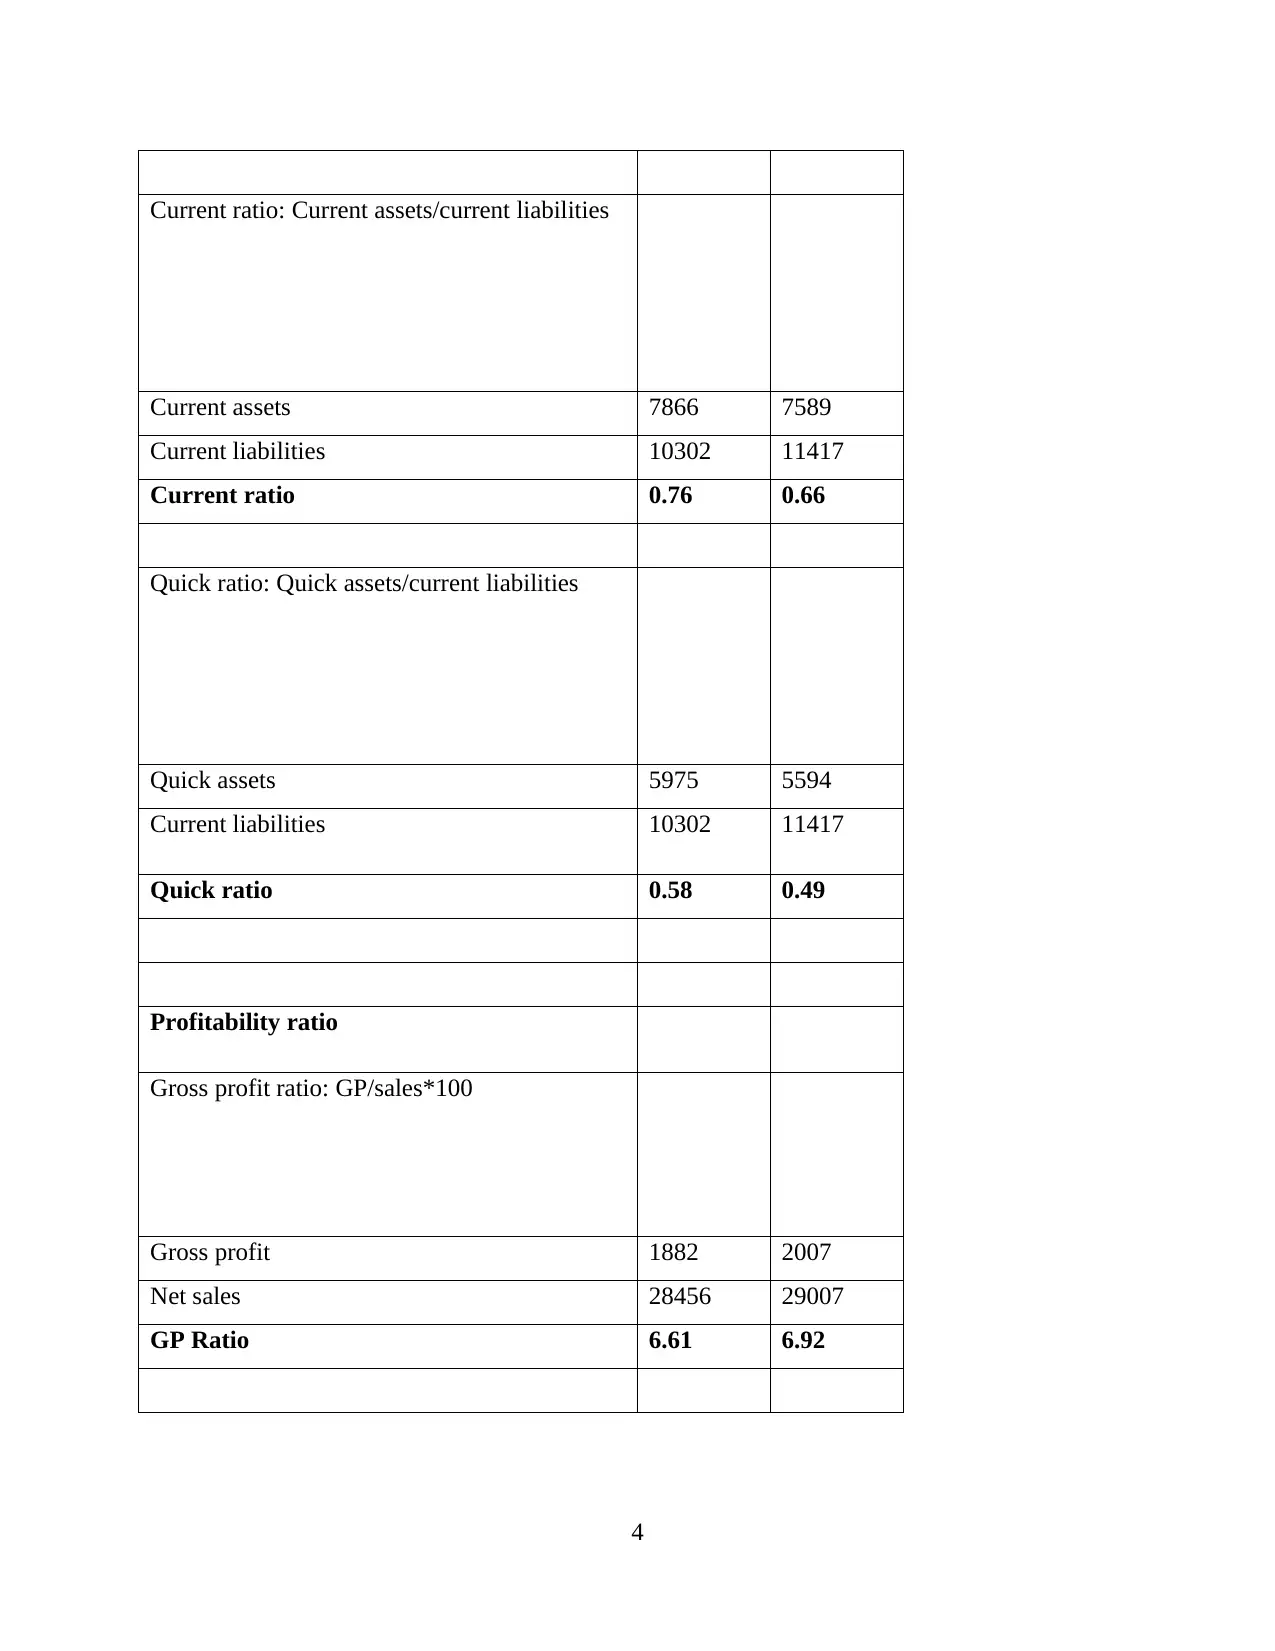
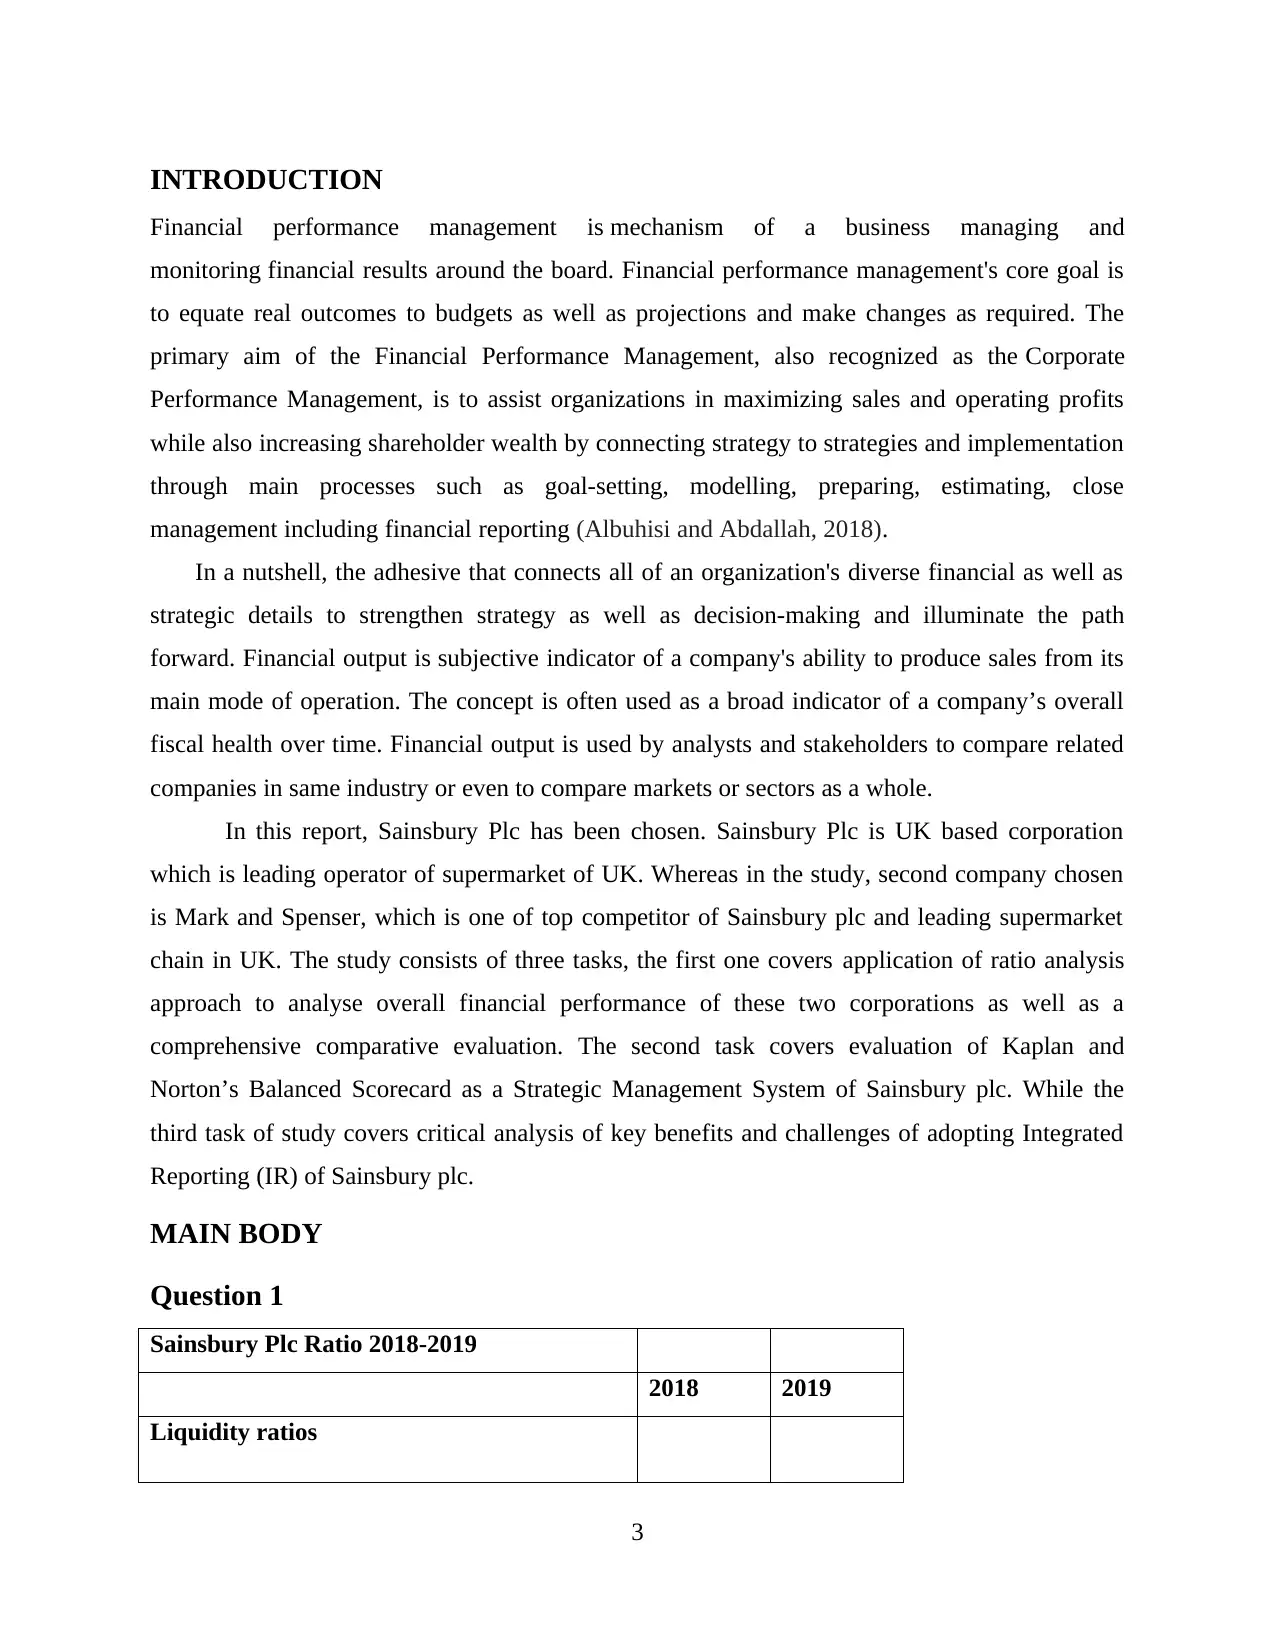
Current ratio: Current assets/current liabilities
Current assets 7866 7589
Current liabilities 10302 11417
Current ratio 0.76 0.66
Quick ratio: Quick assets/current liabilities
Quick assets 5975 5594
Current liabilities 10302 11417
Quick ratio 0.58 0.49
Profitability ratio
Gross profit ratio: GP/sales*100
Gross profit 1882 2007
Net sales 28456 29007
GP Ratio 6.61 6.92
4
Paraphrase This Document
Need a fresh take? Get an instant paraphrase of this document with our AI Paraphraser
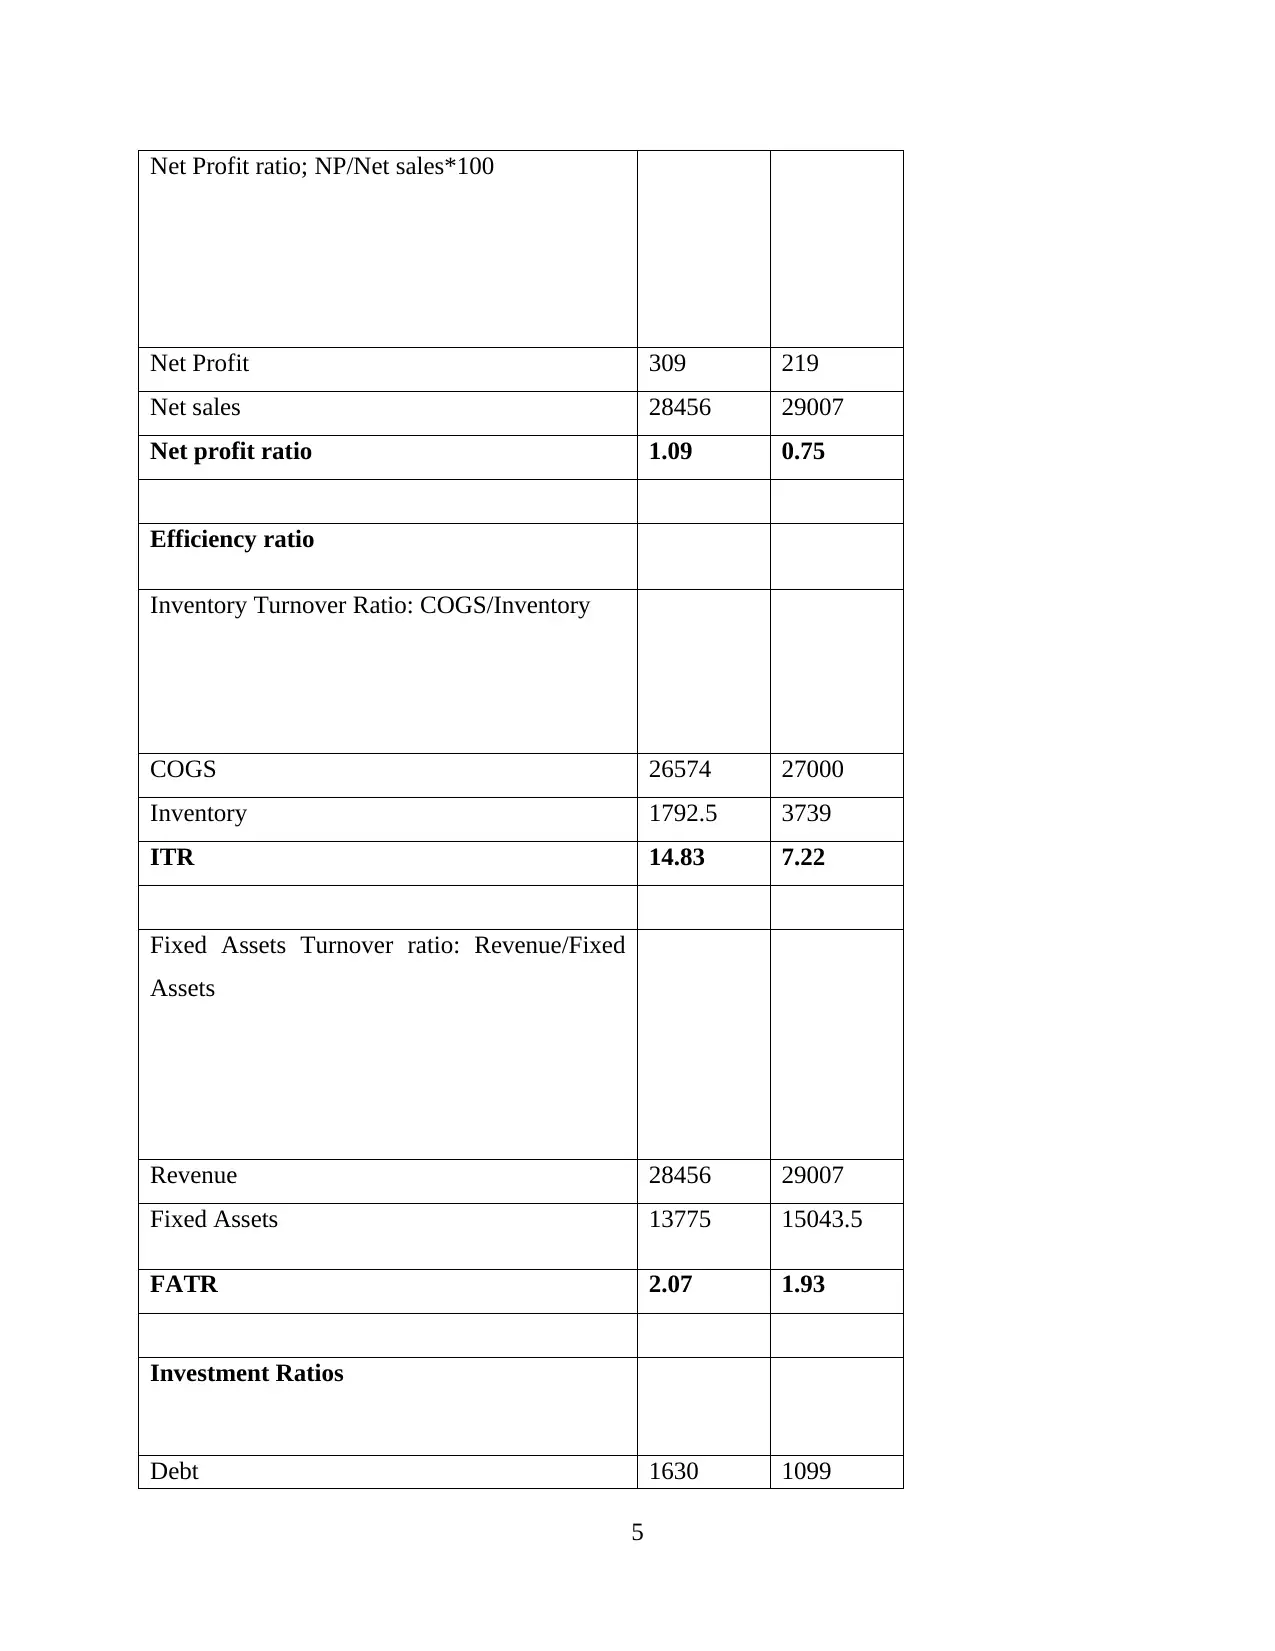
Net Profit ratio; NP/Net sales*100
Net Profit 309 219
Net sales 28456 29007
Net profit ratio 1.09 0.75
Efficiency ratio
Inventory Turnover Ratio: COGS/Inventory
COGS 26574 27000
Inventory 1792.5 3739
ITR 14.83 7.22
Fixed Assets Turnover ratio: Revenue/Fixed
Assets
Revenue 28456 29007
Fixed Assets 13775 15043.5
FATR 2.07 1.93
Investment Ratios
Debt 1630 1099
5
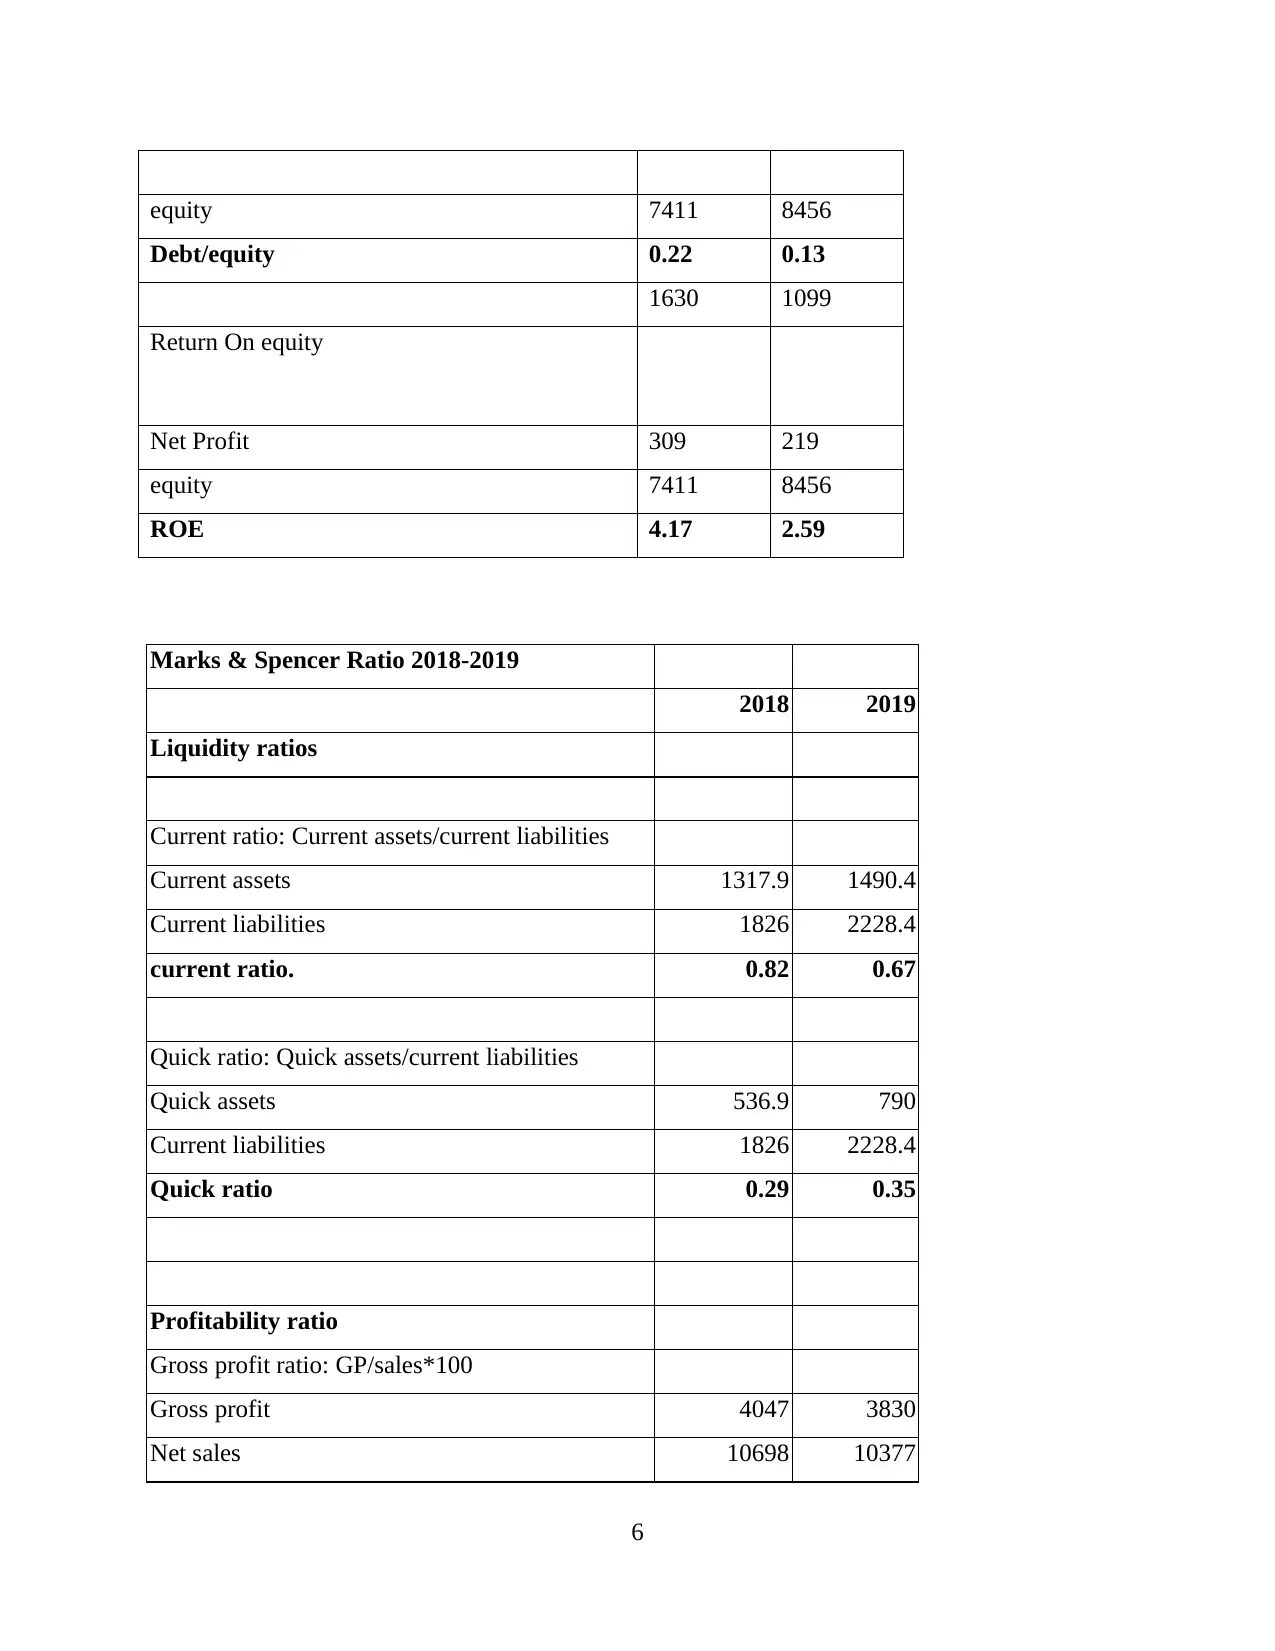
equity 7411 8456
Debt/equity 0.22 0.13
1630 1099
Return On equity
Net Profit 309 219
equity 7411 8456
ROE 4.17 2.59
Marks & Spencer Ratio 2018-2019
2018 2019
Liquidity ratios
Current ratio: Current assets/current liabilities
Current assets 1317.9 1490.4
Current liabilities 1826 2228.4
current ratio. 0.82 0.67
Quick ratio: Quick assets/current liabilities
Quick assets 536.9 790
Current liabilities 1826 2228.4
Quick ratio 0.29 0.35
Profitability ratio
Gross profit ratio: GP/sales*100
Gross profit 4047 3830
Net sales 10698 10377
6
⊘ This is a preview!⊘
Do you want full access?
Subscribe today to unlock all pages.
Trusted by 1+ million students worldwide
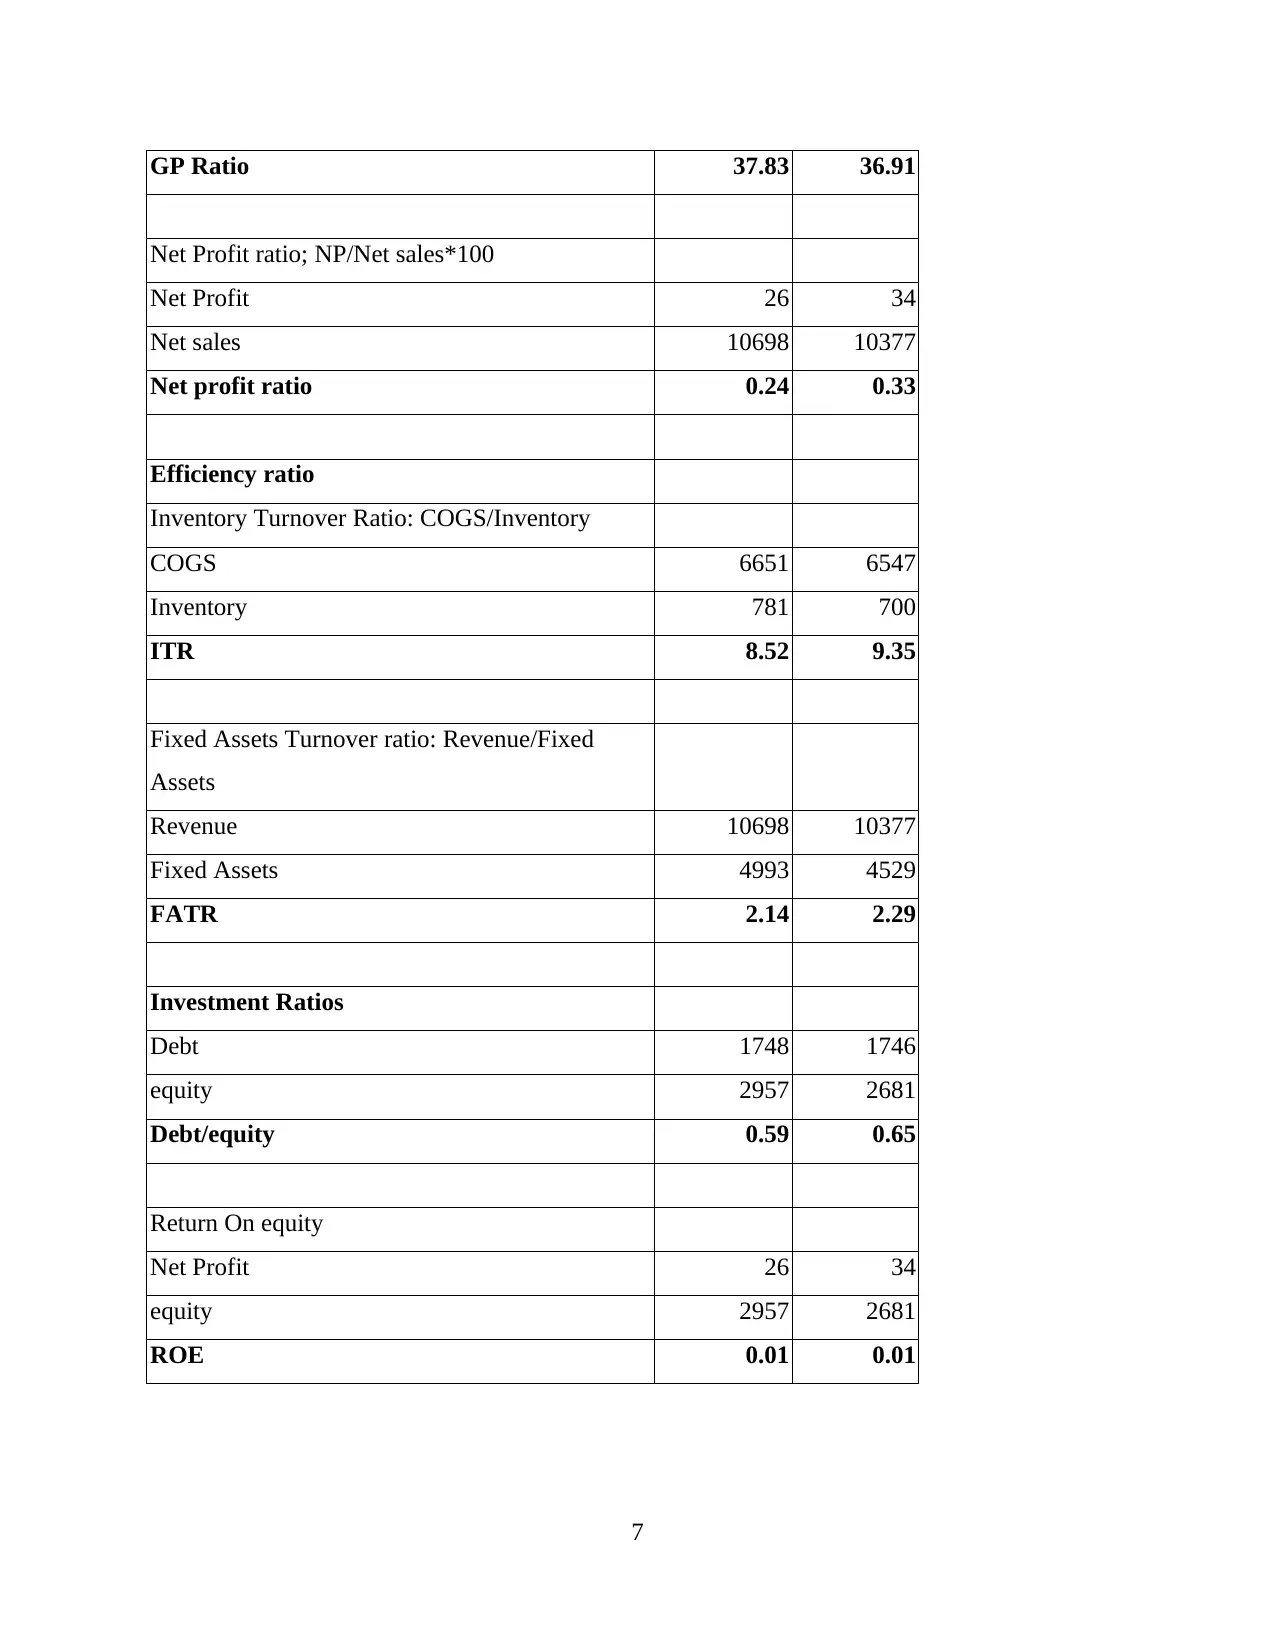
GP Ratio 37.83 36.91
Net Profit ratio; NP/Net sales*100
Net Profit 26 34
Net sales 10698 10377
Net profit ratio 0.24 0.33
Efficiency ratio
Inventory Turnover Ratio: COGS/Inventory
COGS 6651 6547
Inventory 781 700
ITR 8.52 9.35
Fixed Assets Turnover ratio: Revenue/Fixed
Assets
Revenue 10698 10377
Fixed Assets 4993 4529
FATR 2.14 2.29
Investment Ratios
Debt 1748 1746
equity 2957 2681
Debt/equity 0.59 0.65
Return On equity
Net Profit 26 34
equity 2957 2681
ROE 0.01 0.01
7
Paraphrase This Document
Need a fresh take? Get an instant paraphrase of this document with our AI Paraphraser
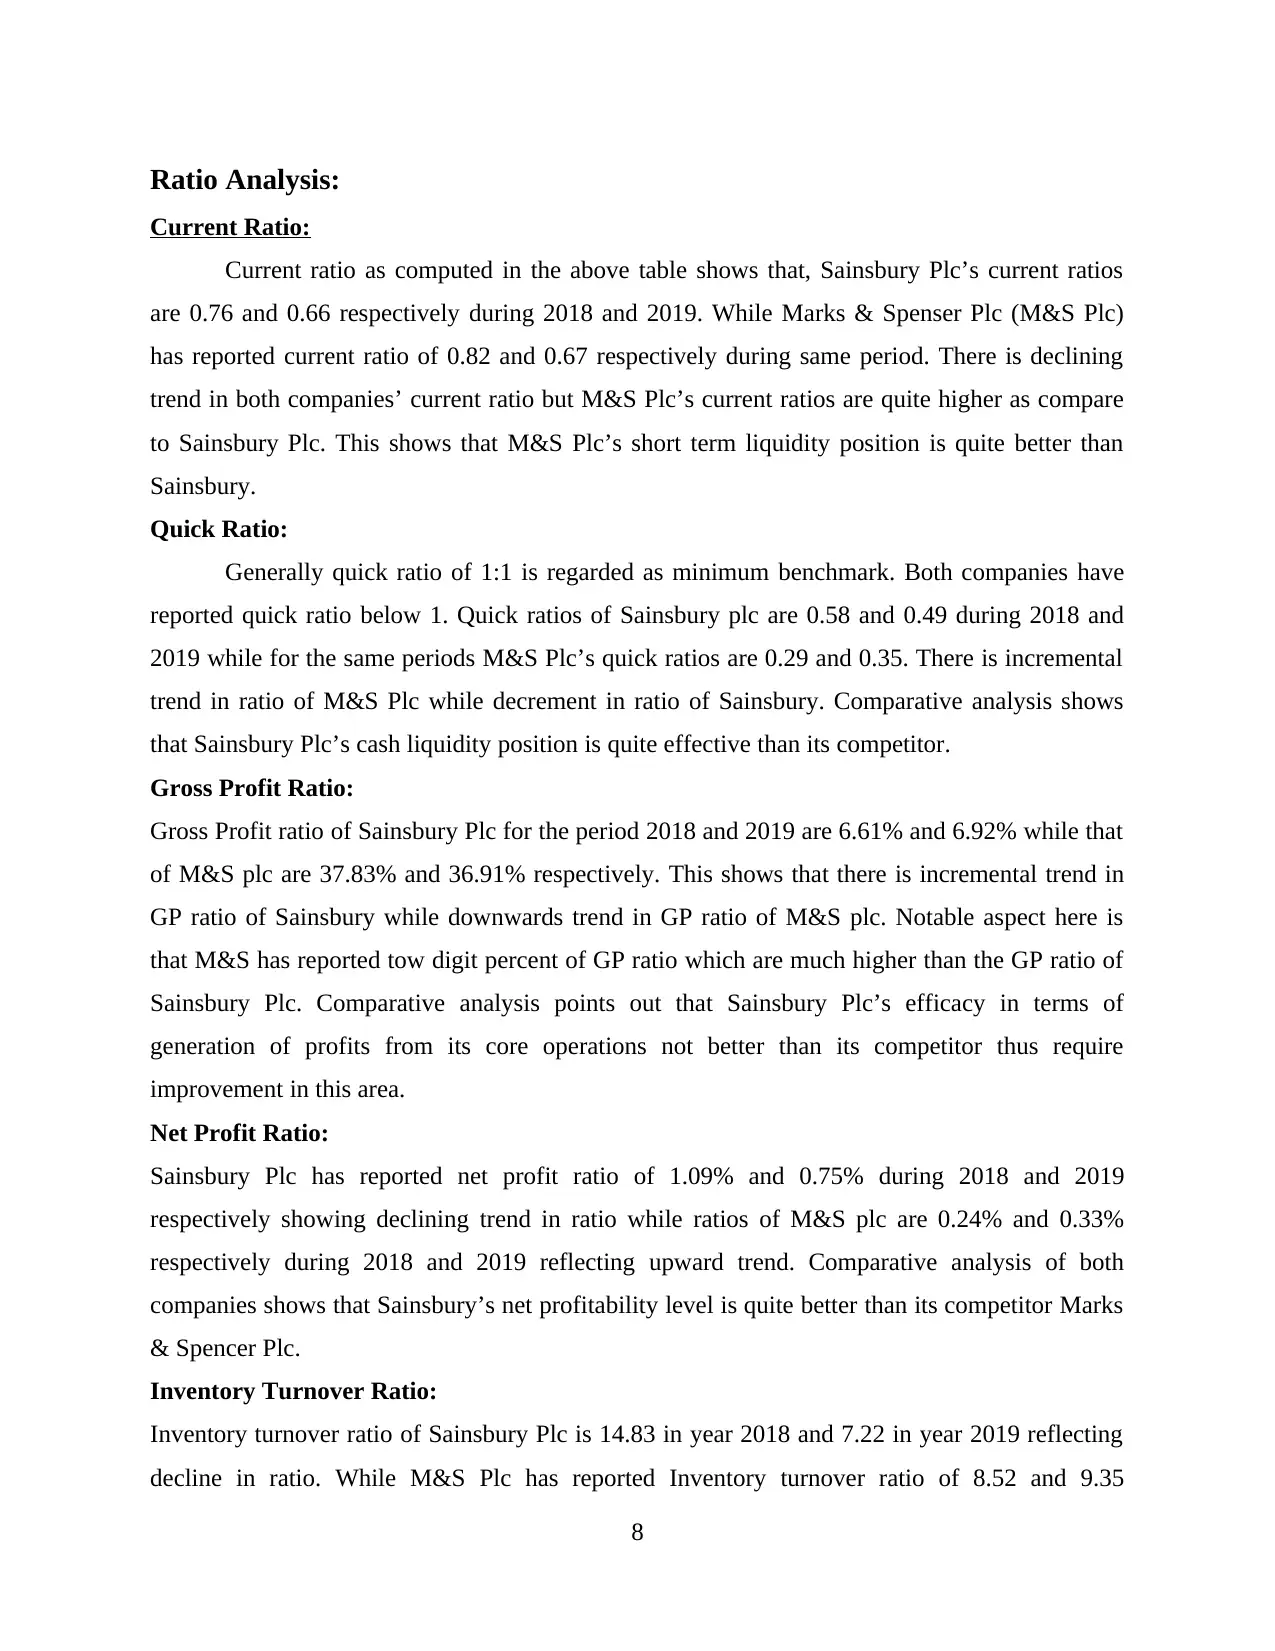
Ratio Analysis:
Current Ratio:
Current ratio as computed in the above table shows that, Sainsbury Plc’s current ratios
are 0.76 and 0.66 respectively during 2018 and 2019. While Marks & Spenser Plc (M&S Plc)
has reported current ratio of 0.82 and 0.67 respectively during same period. There is declining
trend in both companies’ current ratio but M&S Plc’s current ratios are quite higher as compare
to Sainsbury Plc. This shows that M&S Plc’s short term liquidity position is quite better than
Sainsbury.
Quick Ratio:
Generally quick ratio of 1:1 is regarded as minimum benchmark. Both companies have
reported quick ratio below 1. Quick ratios of Sainsbury plc are 0.58 and 0.49 during 2018 and
2019 while for the same periods M&S Plc’s quick ratios are 0.29 and 0.35. There is incremental
trend in ratio of M&S Plc while decrement in ratio of Sainsbury. Comparative analysis shows
that Sainsbury Plc’s cash liquidity position is quite effective than its competitor.
Gross Profit Ratio:
Gross Profit ratio of Sainsbury Plc for the period 2018 and 2019 are 6.61% and 6.92% while that
of M&S plc are 37.83% and 36.91% respectively. This shows that there is incremental trend in
GP ratio of Sainsbury while downwards trend in GP ratio of M&S plc. Notable aspect here is
that M&S has reported tow digit percent of GP ratio which are much higher than the GP ratio of
Sainsbury Plc. Comparative analysis points out that Sainsbury Plc’s efficacy in terms of
generation of profits from its core operations not better than its competitor thus require
improvement in this area.
Net Profit Ratio:
Sainsbury Plc has reported net profit ratio of 1.09% and 0.75% during 2018 and 2019
respectively showing declining trend in ratio while ratios of M&S plc are 0.24% and 0.33%
respectively during 2018 and 2019 reflecting upward trend. Comparative analysis of both
companies shows that Sainsbury’s net profitability level is quite better than its competitor Marks
& Spencer Plc.
Inventory Turnover Ratio:
Inventory turnover ratio of Sainsbury Plc is 14.83 in year 2018 and 7.22 in year 2019 reflecting
decline in ratio. While M&S Plc has reported Inventory turnover ratio of 8.52 and 9.35
8
respectively during 2018 and 2019 indicating increase in ratio. But overall comparative analysis
depicts that Sainsbury plc with greater ratio is more efficient to convert their inventories into
sales as compare to its competitor.
Fixed Asset Turnover Ratio:
Sainsbury’s Fixed-asset turnover ratio for the year 2018 and year 2019 are 2.07 and 1.93
respectively showing decline in ratio. While M&S plc’s has reported Fixed-asset turnover ratio
of 2.14 and 2.29 during 2018 and 2019 reflecting an increase in the ratio. Total comparative
analysis exhibits that M&S plc with greater ratio in comparison of Sainsbury is quite efficient in
utilising its fixed assets to generate sales.
Debt Equity Ratio:
Sainsbury’s debt to equity ratio for the year 2018 is 0.22 and for year 2019 is 0.13 implying a
decline in ratio. M&S plc’s debt to equity ratios during the said period are 0.59 and 0.65
respectively exhibiting increasing trend in this ratio. The comparative analysis of both companies
indicates that Sainsbury with lesser debts has quite better solvency position as compare to its
competitor.
Return on Equity:
ROE of Sainsbury plc are 4.17 and 2.59 respectively during 2018 and 2019 which reflect
decrement in ratio. While ratios of M&S plc are 0.1 during both with minor change. Comparison
shows that ROE of Sainsbury is quite better than M&S plc, although there is major decline in
ratio of Sainsbury Plc which shows that company’s efficiency to provide return to their
shareholders has been declined over the period.
Question 2
Evaluation of Kaplan and Norton’s Balanced Scorecard as a Strategic Management System
Balanced scorecard: This is a performance metric used by company to improve and
determine and control numerous strategies, operations and outcomes of processes of
organisation. This method was developed by David Norton and Robert Kaplan in 1992 for
performance measurement and analysis of financial and non-financial information. These
balanced scored cards are used to provide feedback to organisation. Data interpretation is also
done with help of balanced scorecard so that valuable information can be collected and used for
9
⊘ This is a preview!⊘
Do you want full access?
Subscribe today to unlock all pages.
Trusted by 1+ million students worldwide
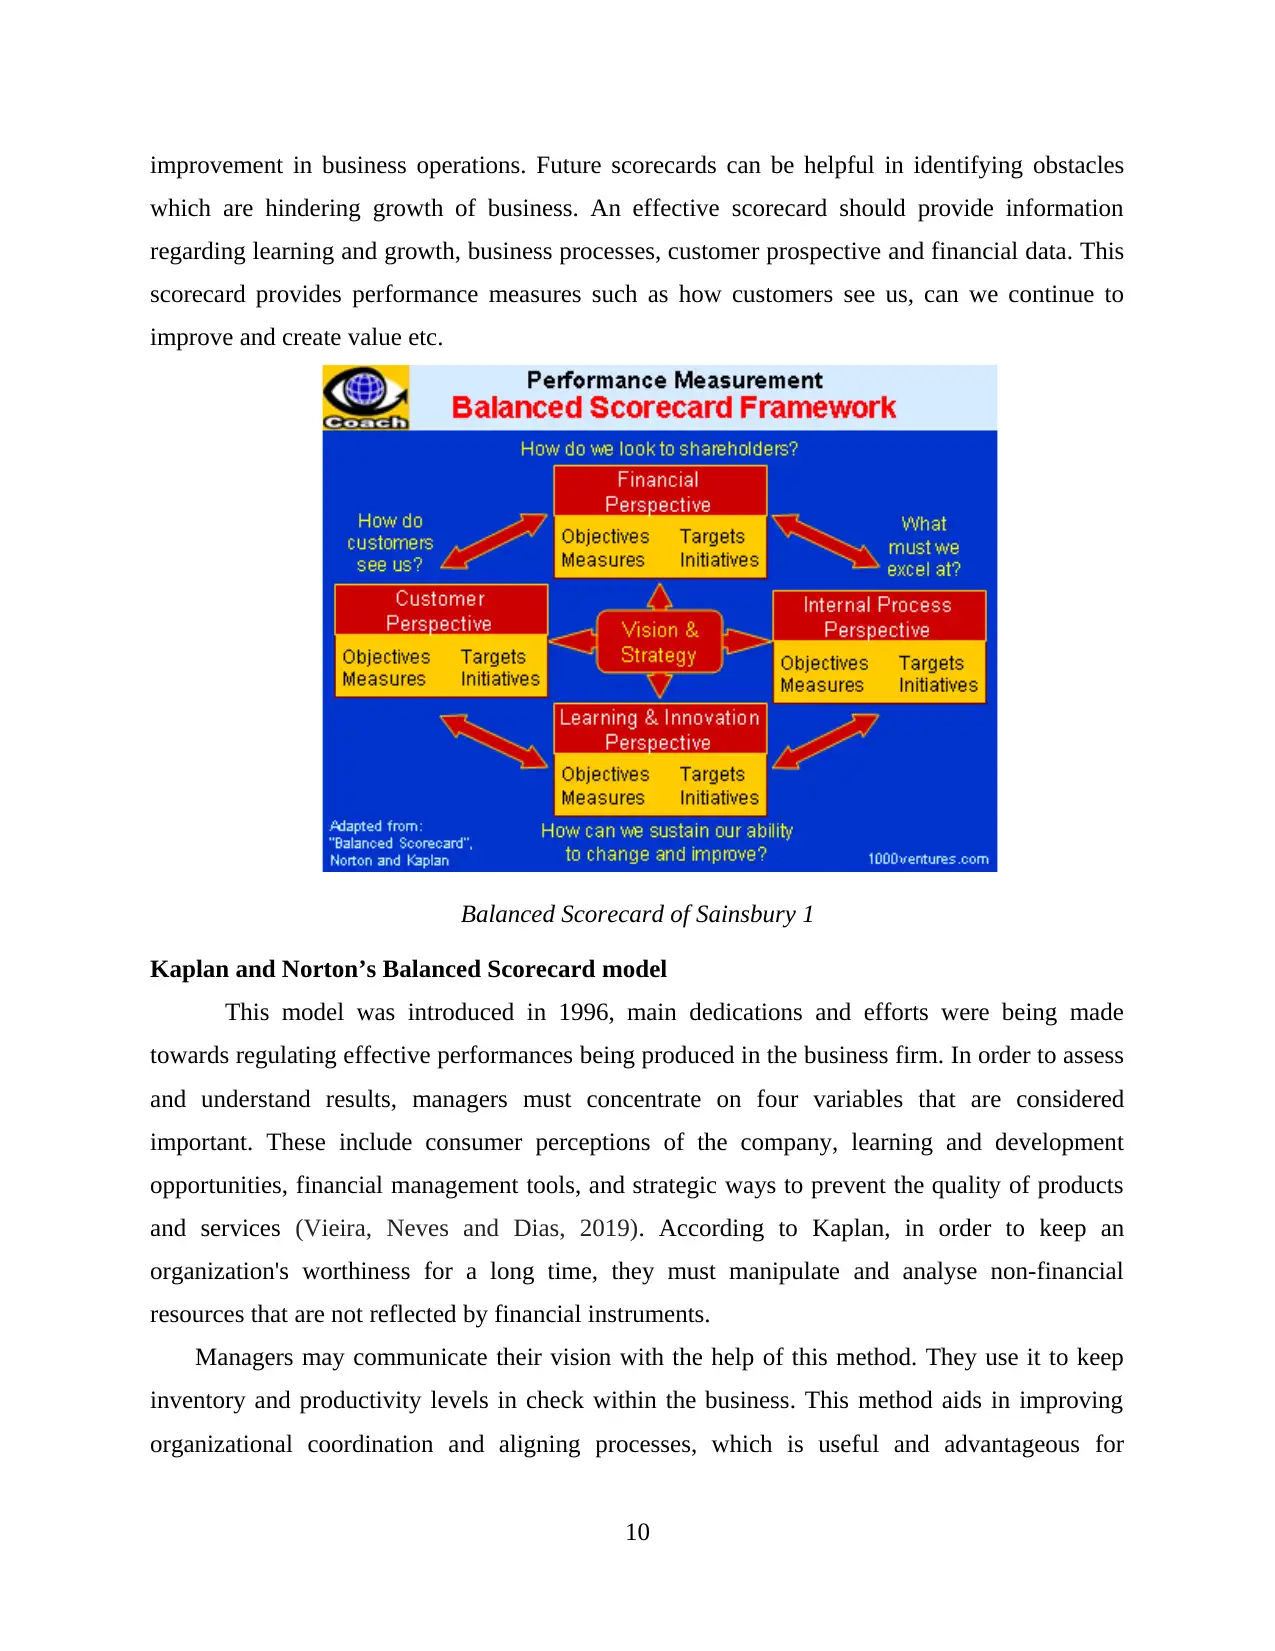
improvement in business operations. Future scorecards can be helpful in identifying obstacles
which are hindering growth of business. An effective scorecard should provide information
regarding learning and growth, business processes, customer prospective and financial data. This
scorecard provides performance measures such as how customers see us, can we continue to
improve and create value etc.
Balanced Scorecard of Sainsbury 1
Kaplan and Norton’s Balanced Scorecard model
This model was introduced in 1996, main dedications and efforts were being made
towards regulating effective performances being produced in the business firm. In order to assess
and understand results, managers must concentrate on four variables that are considered
important. These include consumer perceptions of the company, learning and development
opportunities, financial management tools, and strategic ways to prevent the quality of products
and services (Vieira, Neves and Dias, 2019). According to Kaplan, in order to keep an
organization's worthiness for a long time, they must manipulate and analyse non-financial
resources that are not reflected by financial instruments.
Managers may communicate their vision with the help of this method. They use it to keep
inventory and productivity levels in check within the business. This method aids in improving
organizational coordination and aligning processes, which is useful and advantageous for
10
Paraphrase This Document
Need a fresh take? Get an instant paraphrase of this document with our AI Paraphraser
achieving strategic management objectives. Sainsbury uses four elements of this framework to
assess the efficiency of their divisions, which are listed below:
Strategy and vision: It is regarded as the tool that expresses the organization's ultimate
purpose. The main reason for the formation of an organization. The statement of vision serves as
a roadmap for the top management as it develops strategies. This model is founded on the
premise that vision is related to all perspectives.
Financial perspective: Organizations have specific goals based on their needs and the
achievement of their long-term business objectives. Financial perspective refers to how a
company appears to its shareholders. They do this by tracking their organization's growth,
operations, and harvest life cycles (Esteban-Sanchez, de la Cuesta-Gonzalez and Paredes-
Gazquez, 2017). To assess the financial viewpoint, managers must calculate the profit margin
and gross margin ratio, which they will use to assess the company's effectiveness.
Customers perspective: In this process, businesses evaluate their performance from the
perspective of their clients. They use service rating metrics as well as calculating the amount of
risk management requires to identify the market's viewpoint on the business in order to identify
customer needs.
Respective model assesses share of the market, customer retention rate, productivity satisfaction,
and customer retention level to determine the relevance of customers. According to Kaplan and
Norton, organizations must concentrate on developing a successful customer loyalty policy in
order to gain a sustainable market advantage (De Villiers, Hsiao and Maroun eds., 2020).
Sainsbury's general manager develops strategy with the aim of concentrating on each target
market segment, building solid relationships with consumers, and spreading positive interest in
each target audience by potential consumers.
Innovation and learning: According to Kaplan and Norton, it is important to determine the
response to the question of what are the items and goods that a company has that assist in
providing customer loyalty as well as ways to meet customer requirements. They must create
policies and develop ideas for innovation, as well as introduce or apply innovations throughout
their organisation, in order to achieve this goal.
Sainsbury's top management develops strategies based on the measurement of
interconnected processes across various divisions, as well as cross-organizational culture, from
that they can assess and satisfy customer demand. And to increase shareholder capital.
11
Internal business strategy: It relates with identifying opportunities and threats in the future so
that a company can retain its market place for a long time while still providing services to
consumers and creating future value. In order to improve an organisation’s ability, it focuses on
cost reduction and the development of new ideas. Sainsbury's general manager uses this tool to
develop their business plans, and it uses the balance scorecard principle to inspire their
employees by providing incentives and recognition that help them advance in their careers.
Sainsbury's management department is focused on the goal that if their employees are inspired,
the company's goals can be easily accomplished, as human capital is considered an important
element in the organization (Shabbir and Wisdom, 2020). The Balanced model developed by
Kaplan and Norton helps employees increase their output by focusing on potential investment
and development. Prospective organisations typically concentrate on skills encouragement and
efficiency enhancement to reach their learning and development goals. Sainsbury will monitor
their level of retaining employees by monitoring employee satisfaction, and it can also benefit
the integration of staffing priorities with company vision, as motivated employees work hard to
achieve business goals.
Sainsbury's management department evaluates their marginal ratio, operating and cost of return
in order to effectively assess consumers' attitudes and identify tactics that help in the
development of an effective method that can easily recognize or quantify the value of the
company (Akisik and Gal, 2017).
With the preparation and development of these systems, Sainsbury's managers and leaders
can easily assess output and determine the reason for the deviation from the regular target. On
this foundation, strategies are developed with an aim attain achievement of the company's
objectives and the development of a good market place.
Question 3
Brief description regarding benefits & challenges adopting integrated reporting
Integrated reporting: It is a tool that is formulated to describe how a business entity should
generate value over a particular period of time, based on their goals, governance, and success, in
order to achieve their long, short, or intermediate target (Choi and et. al., 2018). It can be
described as a tool that is used to demonstrate a correlation with an organisation's internal goals
and external factors.
12
⊘ This is a preview!⊘
Do you want full access?
Subscribe today to unlock all pages.
Trusted by 1+ million students worldwide
1 out of 17
Related Documents


Your All-in-One AI-Powered Toolkit for Academic Success.
+13062052269
info@desklib.com
Available 24*7 on WhatsApp / Email
![[object Object]](/_next/static/media/star-bottom.7253800d.svg)
Unlock your academic potential
Copyright © 2020–2026 A2Z Services. All Rights Reserved. Developed and managed by ZUCOL.