Comprehensive Analysis: Financial Resource Management and Performance
VerifiedAdded on 2020/04/07
|32
|5887
|102
Report
AI Summary
This comprehensive report examines the management of financial resources and performance, encompassing various aspects such as evaluating performance, planning and control, and contemporary management accounting methodologies. The report delves into key performance ratios, accounting treatments, and comparative performance analysis, specifically focusing on Microsoft. It explores cost management techniques, including job, process, and contract costing, along with fixed and variable cost distinctions. Cost-volume-profit analysis, relevant cost applications, and traditional budgeting are also discussed. The report further analyzes activity-based management, lean enterprise concepts, and value chain analysis, alongside methods of resource allocation and capital investment techniques. International financial markets and the tensions between financial and strategic objectives are also considered. The report provides a detailed understanding of financial resource management practices.

MANAGEMENT OF FINANCIAL
RESOURCES AND PERFORMANCE
RESOURCES AND PERFORMANCE
Paraphrase This Document
Need a fresh take? Get an instant paraphrase of this document with our AI Paraphraser
Table of Contents
Part- 1 Evaluating performance and appraising limitations............................................................3
Part 2- Planning and control of an organization’s Resources..........................................................5
Part3- Contemporary Management Accounting Methodology.......................................................8
Part- 4 Methods of Resource Allocation for Achieving Corporate Strategy.................................11
Part 5-Tensions between Financial and Strategic Objectives........................................................14
Part 6 Capital Investment Techniques...........................................................................................17
Part 7- International Financial Market...........................................................................................19
Part 8-.............................................................................................................................................22
Appendix 1.....................................................................................................................................27
Appendix 2.....................................................................................................................................28
Appendix 3.....................................................................................................................................28
References......................................................................................................................................29
TABLE OF FIGURES
Figure 1: Process of ABC................................................................................................................9
Figure 2: Model of Activity Based Costing...................................................................................10
Figure 3: Microsoft value chain analysis.......................................................................................11
Figure 4: qualitative and quantitative issues of strategic performance..........................................20
Figure 5: Approaches to managing risk.........................................................................................21
Figure 6: Indirect benefits of International Finance......................................................................22
Figure 7: various sources of finance..............................................................................................23
Figure 8: Risk map for resolving issues........................................................................................25
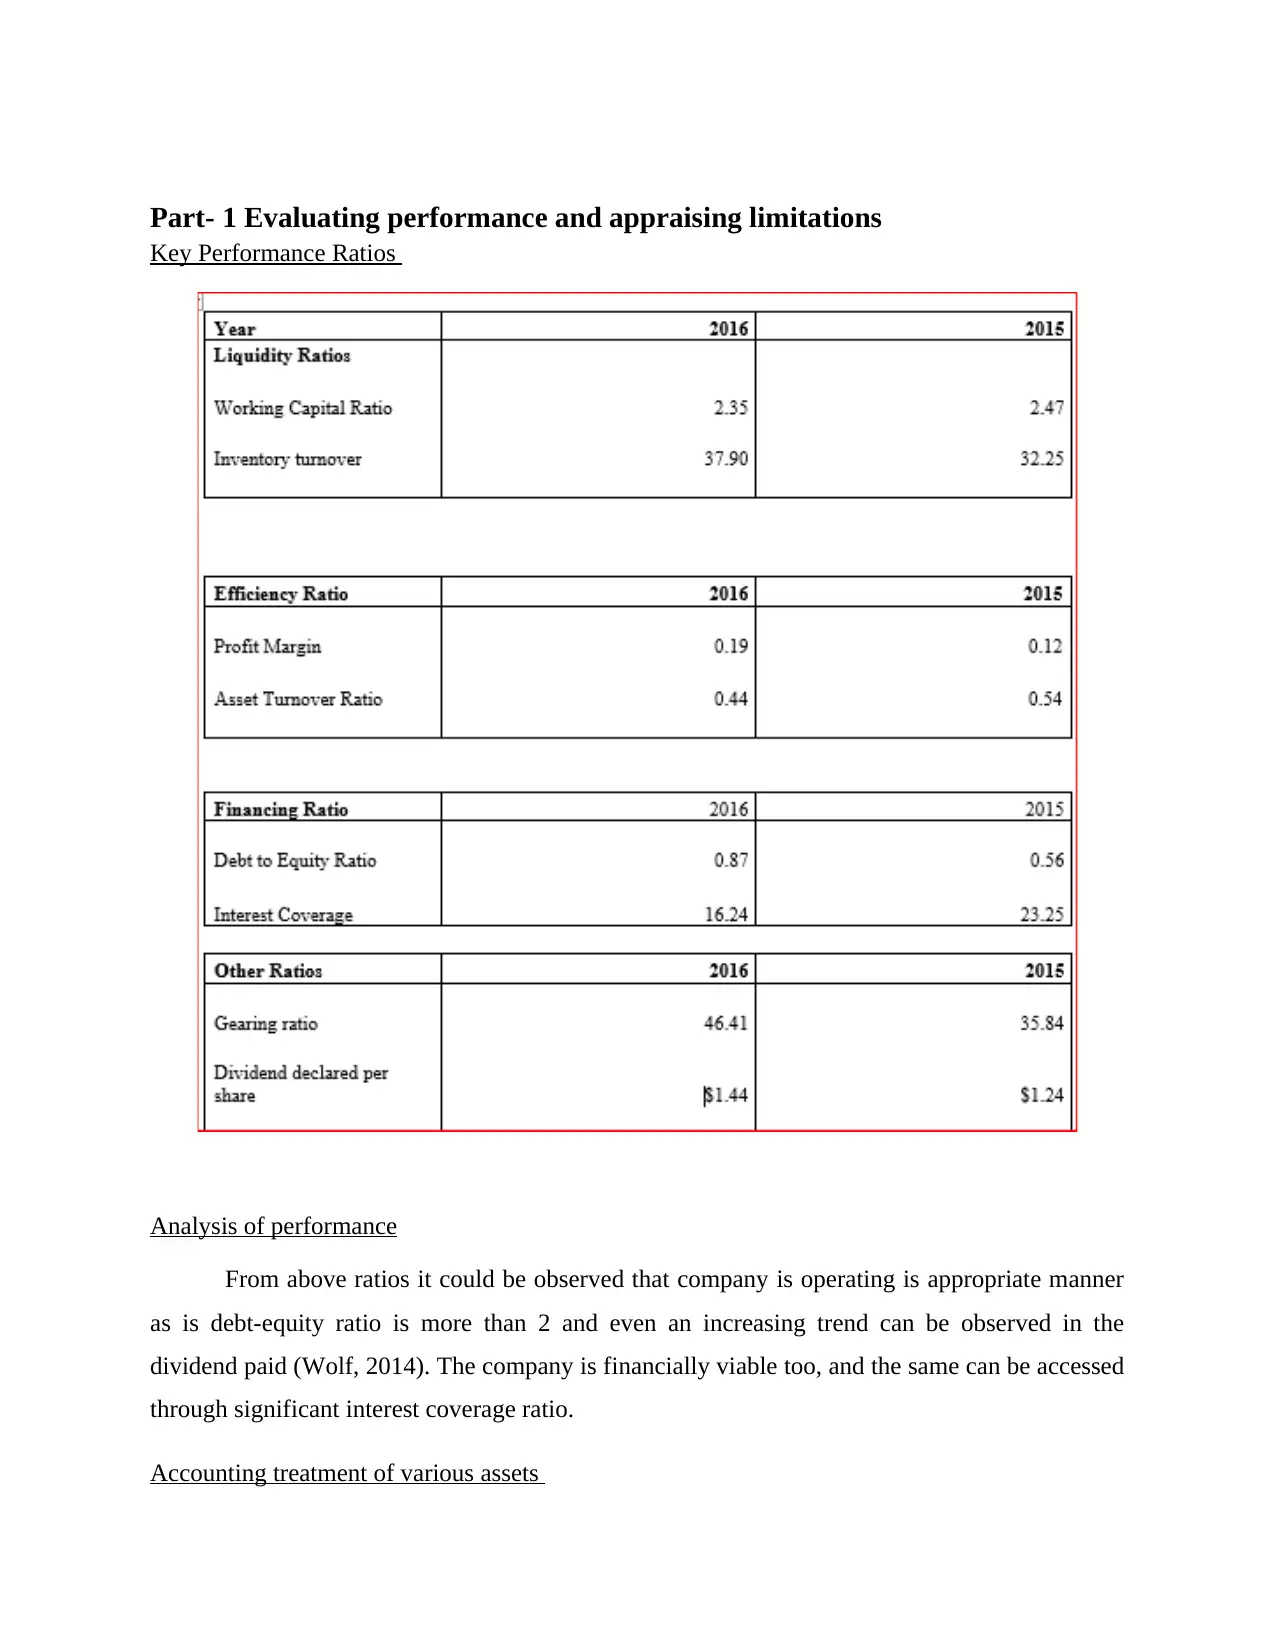
Part- 1 Evaluating performance and appraising limitations
Key Performance Ratios
Analysis of performance
From above ratios it could be observed that company is operating is appropriate manner
as is debt-equity ratio is more than 2 and even an increasing trend can be observed in the
dividend paid (Wolf, 2014). The company is financially viable too, and the same can be accessed
through significant interest coverage ratio.
Accounting treatment of various assets
⊘ This is a preview!⊘
Do you want full access?
Subscribe today to unlock all pages.
Trusted by 1+ million students worldwide
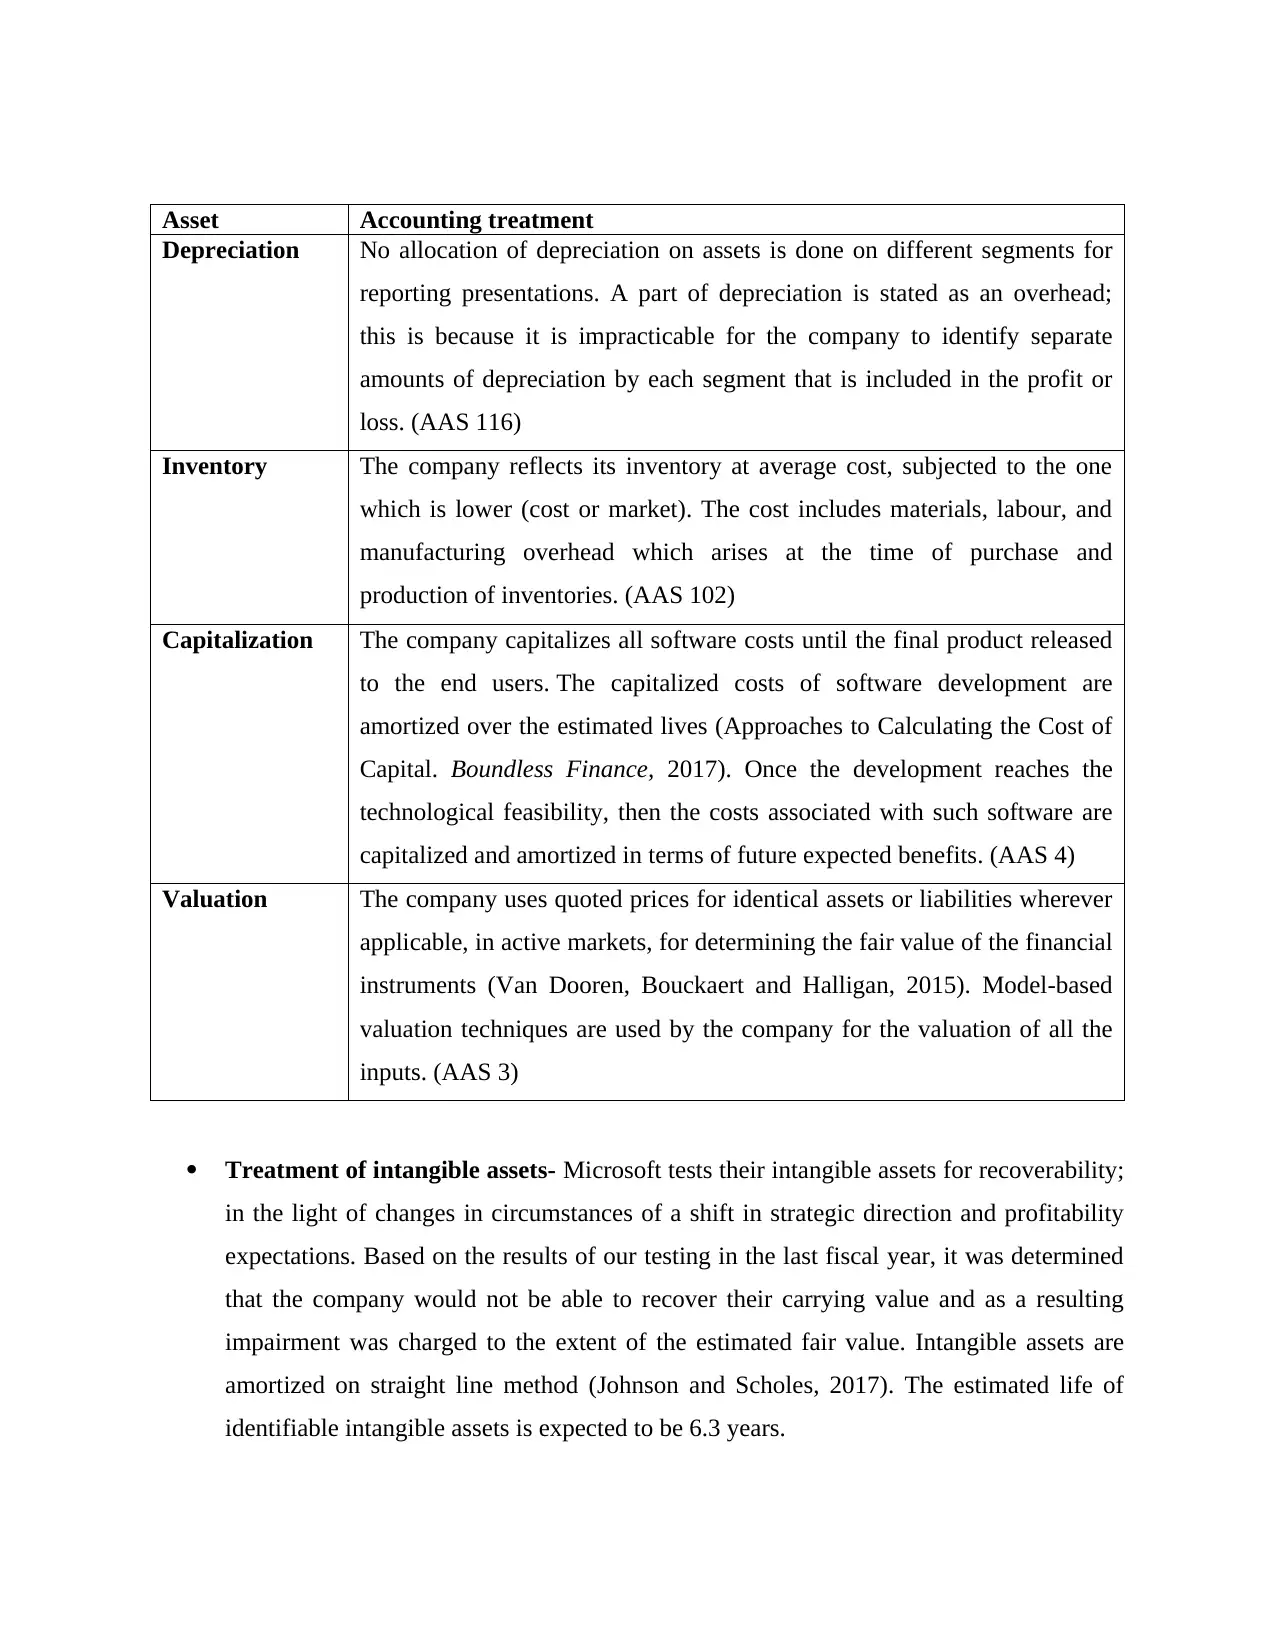
Asset Accounting treatment
Depreciation No allocation of depreciation on assets is done on different segments for
reporting presentations. A part of depreciation is stated as an overhead;
this is because it is impracticable for the company to identify separate
amounts of depreciation by each segment that is included in the profit or
loss. (AAS 116)
Inventory The company reflects its inventory at average cost, subjected to the one
which is lower (cost or market). The cost includes materials, labour, and
manufacturing overhead which arises at the time of purchase and
production of inventories. (AAS 102)
Capitalization The company capitalizes all software costs until the final product released
to the end users. The capitalized costs of software development are
amortized over the estimated lives (Approaches to Calculating the Cost of
Capital. Boundless Finance, 2017). Once the development reaches the
technological feasibility, then the costs associated with such software are
capitalized and amortized in terms of future expected benefits. (AAS 4)
Valuation The company uses quoted prices for identical assets or liabilities wherever
applicable, in active markets, for determining the fair value of the financial
instruments (Van Dooren, Bouckaert and Halligan, 2015). Model-based
valuation techniques are used by the company for the valuation of all the
inputs. (AAS 3)
Treatment of intangible assets- Microsoft tests their intangible assets for recoverability;
in the light of changes in circumstances of a shift in strategic direction and profitability
expectations. Based on the results of our testing in the last fiscal year, it was determined
that the company would not be able to recover their carrying value and as a resulting
impairment was charged to the extent of the estimated fair value. Intangible assets are
amortized on straight line method (Johnson and Scholes, 2017). The estimated life of
identifiable intangible assets is expected to be 6.3 years.
Paraphrase This Document
Need a fresh take? Get an instant paraphrase of this document with our AI Paraphraser
Differences in financial reporting- As per the analysis, there have been no differences
in the financial reporting of the company as compared to International Accounting
Standard.
1.3 Comparative Performance
After comparison of the financial performance of Microsoft to its competitors, it can be
said that the Total Revenue of the company decreased in 2015’s the 3 quarter -12.16 %. As
opposed to this, the revenue for other companies in the industry and the industry as a whole
increased by 29.94 %, in the same quarter (Shahzad, Rutherford and Sharfman, 2016). Although
Microsoft is a better performer from companies like Dow Jones Industrial, the company has been
continuously suffering from strong competition from Apple. Inc.
Microsoft mainly focuses on the analysis of processes undertaken within the organization
by fundamentally rethinking the way they improve customer service, reduce operational costs
thereby becoming world-class competitors (Saeidi and et al. 2015). Each process that either
result in finished good or as a base for the next process is evaluated separately. In the IT
industry’s which is multi-process, generic benchmarking is used to comparing information.
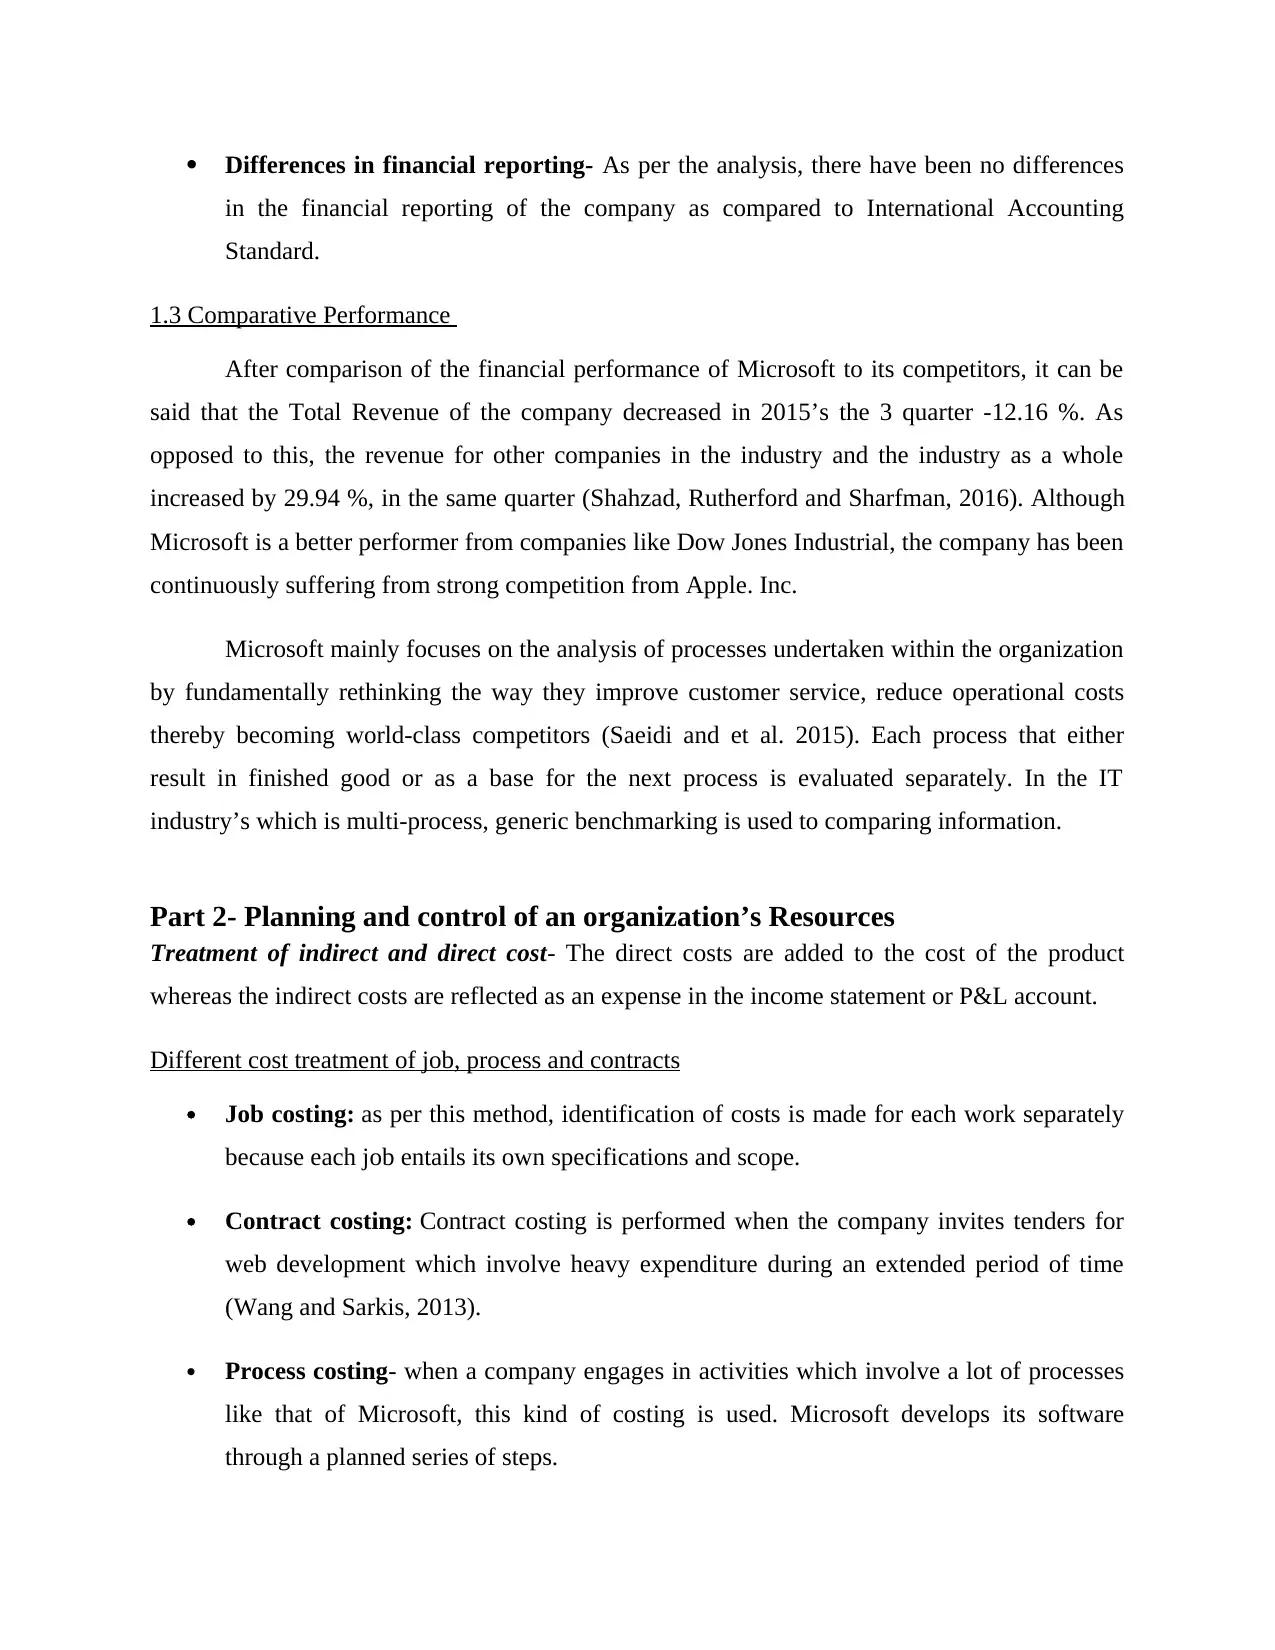
Part 2- Planning and control of an organization’s Resources
Treatment of indirect and direct cost- The direct costs are added to the cost of the product
whereas the indirect costs are reflected as an expense in the income statement or P&L account.
Different cost treatment of job, process and contracts
Job costing: as per this method, identification of costs is made for each work separately
because each job entails its own specifications and scope.
Contract costing: Contract costing is performed when the company invites tenders for
web development which involve heavy expenditure during an extended period of time
(Wang and Sarkis, 2013).
Process costing- when a company engages in activities which involve a lot of processes
like that of Microsoft, this kind of costing is used. Microsoft develops its software
through a planned series of steps.
in the financial reporting of the company as compared to International Accounting
Standard.
1.3 Comparative Performance
After comparison of the financial performance of Microsoft to its competitors, it can be
said that the Total Revenue of the company decreased in 2015’s the 3 quarter -12.16 %. As
opposed to this, the revenue for other companies in the industry and the industry as a whole
increased by 29.94 %, in the same quarter (Shahzad, Rutherford and Sharfman, 2016). Although
Microsoft is a better performer from companies like Dow Jones Industrial, the company has been
continuously suffering from strong competition from Apple. Inc.
Microsoft mainly focuses on the analysis of processes undertaken within the organization
by fundamentally rethinking the way they improve customer service, reduce operational costs
thereby becoming world-class competitors (Saeidi and et al. 2015). Each process that either
result in finished good or as a base for the next process is evaluated separately. In the IT
industry’s which is multi-process, generic benchmarking is used to comparing information.
Part 2- Planning and control of an organization’s Resources
Treatment of indirect and direct cost- The direct costs are added to the cost of the product
whereas the indirect costs are reflected as an expense in the income statement or P&L account.
Different cost treatment of job, process and contracts
Job costing: as per this method, identification of costs is made for each work separately
because each job entails its own specifications and scope.
Contract costing: Contract costing is performed when the company invites tenders for
web development which involve heavy expenditure during an extended period of time
(Wang and Sarkis, 2013).
Process costing- when a company engages in activities which involve a lot of processes
like that of Microsoft, this kind of costing is used. Microsoft develops its software
through a planned series of steps.
Absorption costing- This costing type has its origin from managerial accounting which
expenses all costs associated with developing a particular product; this type of costing is
the time required by external reporting GAAP (generally accepted accounting principles).
Absorption costing is done for costs which are directly relatable to the development of
the product (Tantalo and Priem, 2016).
Distinction between fixed and variable cost
A company's cost which is linked to the amount of goods or services it produces is called
variable cost. The variable cost of the company increases and decreases with the volume of
production undertaken. On the other hand, the costs which do not vary with the level of output
are known as a fixed cost. This part of cost remains constant at each level of production.
Cost volume profit analysis Short-term decision analysis
The analysis is applied to ascertain the
manner in which change in cost and volume
affects operating as well as net income of
company (Harrison and Wicks, 2013). For
accomplishing the analysis, various
components such as sale price per unit are
assumed constant.
This technique is used by the company as a
new way for evaluating costs which assist in
managerial decision making. Instead of
evaluating components of cost this analysis,
re-arranges the costs into variable costs, fixed
costs, and mixed costs (Rivera, Muñoz and
Moneva, 2017). In this technique, the company
allocates salary to fixed costs and bonus to
variable costs.
Relevant cost and its application to decision-making
The objective cost of a business decision is determined by relevant costs. An objective
measure cost of a decision is a number of cash outflows that result from its implementation.
Thus, it assists in decision making through revealing the amount of cash outflow resulting from a
cost. Some of the relevant costs are future cash flows, avoidable cost, opportunity cost and
incremental cost.
Role and Limitations of Traditional Budgets
⊘ This is a preview!⊘
Do you want full access?
Subscribe today to unlock all pages.
Trusted by 1+ million students worldwide
A detailed statement of financial results that are predictable for a given period of time in
the future is known as the process of Budgeting. Traditional functional budgets can be effective
only when the organization is divided into many units which together contribute to
organizational goal (Mir and Pinnington, 2014). If the entity runs on the basis of annual goals, it
may need a functional budget for a short period just to keep the company on the right track.
Problems and motivational impact of functional annual budgets - The problem
associated with functional budgets is that it created unnecessary pressure in the mind of
the staff and promoted unhealthy competition (Guerreiro, 2015). However, if
communicated in a positive way can provide a guide to managers and their employees in
achieving the organizational objectives.
Alternatives to functional budgets
Budget Description
Activity-based budgets This type of budgeting is the one in which the
activities of the organization which incur
costs are recorded, and their relationships
with each other are defined and analyzed.
Continuous Budgets It is the process of continually adding months
to a multi-period budget with each passing
month by revising the assumptions of the
budget for every incremental period of the
budget (Endrikat, Guenther and Hoppe,
2014).
Beyond Budgeting Roundtable This technique emphasizes a holistic focus on
the objectives to be achieved and their
relation with the processes undertaken to
accomplish them. Microsoft encourages full-
scale recreation of processes instead of sub-
processes being optimized.
Paraphrase This Document
Need a fresh take? Get an instant paraphrase of this document with our AI Paraphraser
Part3- Contemporary Management Accounting Methodology
Role of Activity-Based Management
‘Relevance lost’ -The traditional system of accounting overhead is done through
allocating it to the product in the proportion of direct labour or machine hours which may
not reflect the actual consumption of resources. There is a relevant loss of useful
resources as the traditional management accounting fail to provide accurate product cost
(Grant, 2016). The traditional system of accounting has failed to keep pace with new
technologies by focusing on short-term profits instead of short-term financial measure of
non-performance. Traditional accounting focuses on volume-related drivers, like labour
hours, while the modern costing method uses transaction-based drivers, like a number of
orders received.
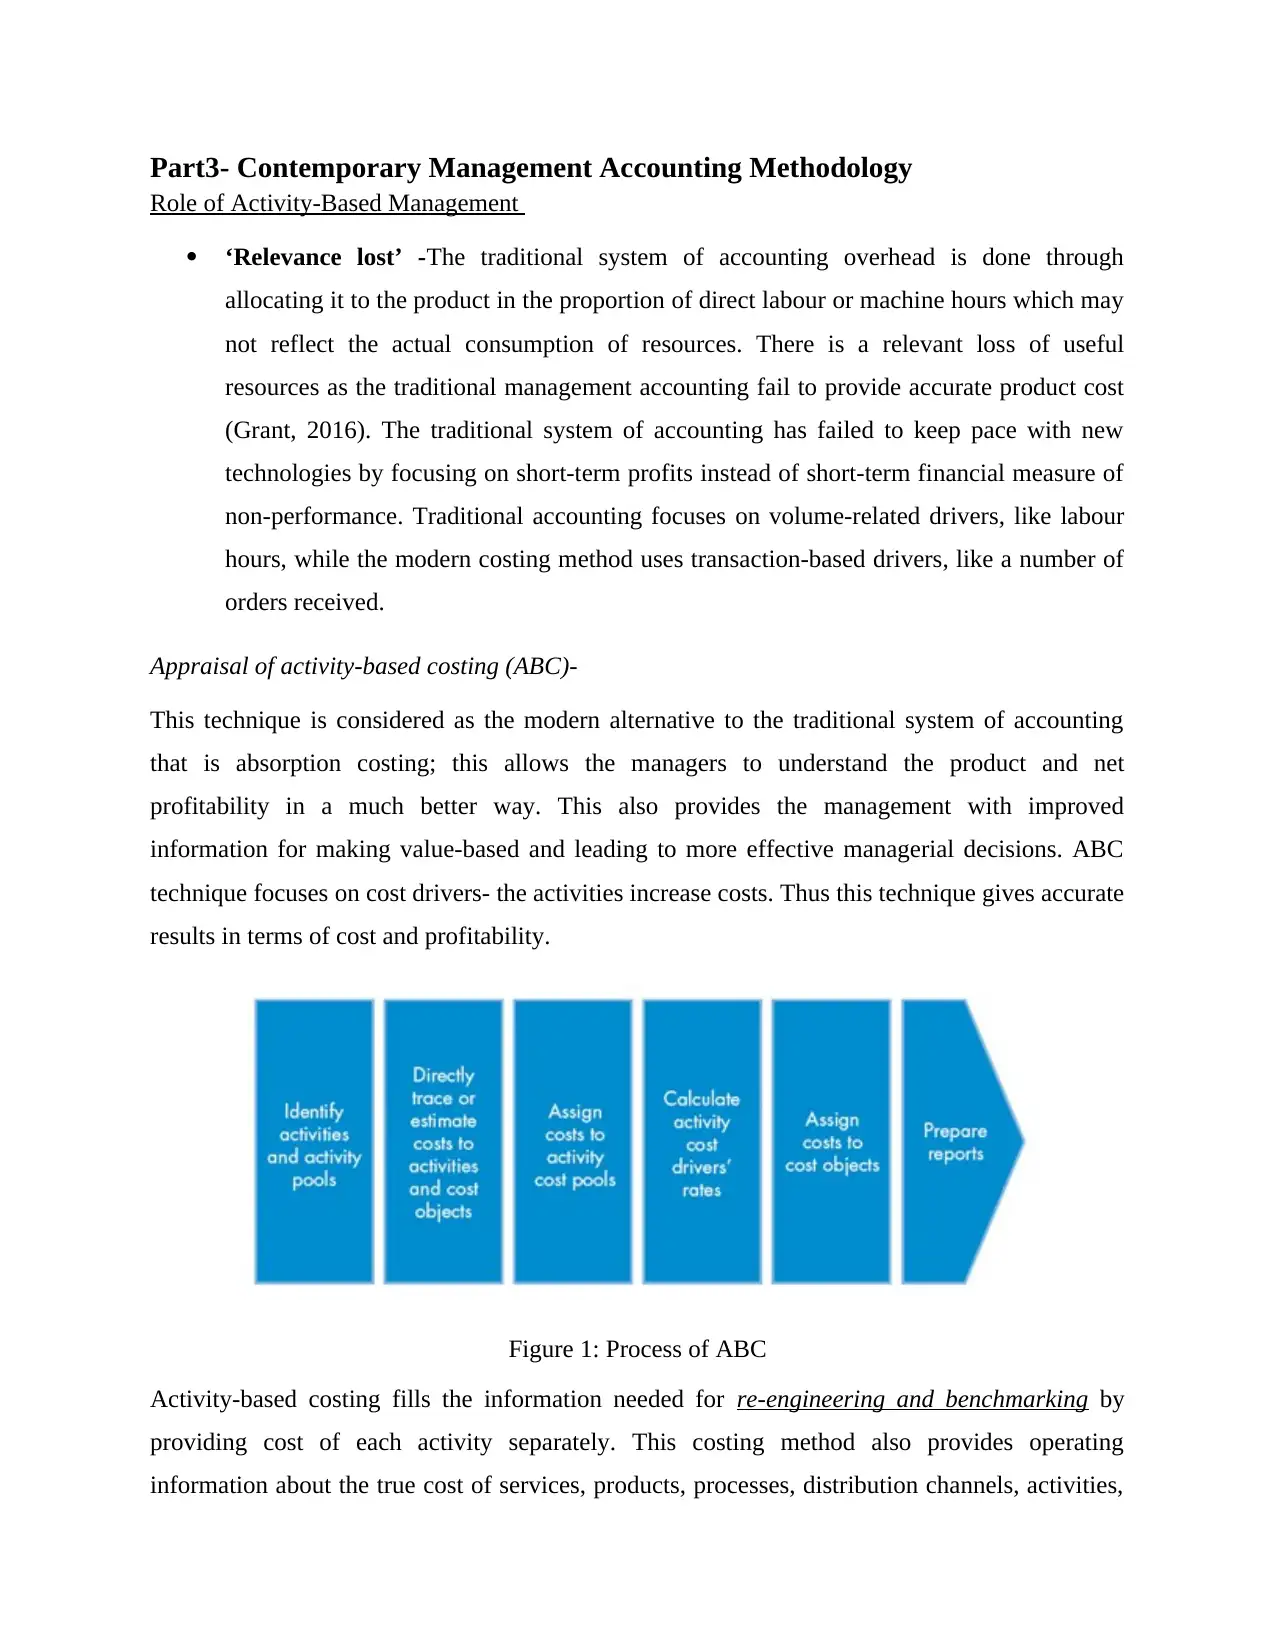
Appraisal of activity-based costing (ABC)-
This technique is considered as the modern alternative to the traditional system of accounting
that is absorption costing; this allows the managers to understand the product and net
profitability in a much better way. This also provides the management with improved
information for making value-based and leading to more effective managerial decisions. ABC
technique focuses on cost drivers- the activities increase costs. Thus this technique gives accurate
results in terms of cost and profitability.
Figure 1: Process of ABC
Activity-based costing fills the information needed for re-engineering and benchmarking by
providing cost of each activity separately. This costing method also provides operating
information about the true cost of services, products, processes, distribution channels, activities,
Role of Activity-Based Management
‘Relevance lost’ -The traditional system of accounting overhead is done through
allocating it to the product in the proportion of direct labour or machine hours which may
not reflect the actual consumption of resources. There is a relevant loss of useful
resources as the traditional management accounting fail to provide accurate product cost
(Grant, 2016). The traditional system of accounting has failed to keep pace with new
technologies by focusing on short-term profits instead of short-term financial measure of
non-performance. Traditional accounting focuses on volume-related drivers, like labour
hours, while the modern costing method uses transaction-based drivers, like a number of
orders received.
Appraisal of activity-based costing (ABC)-
This technique is considered as the modern alternative to the traditional system of accounting
that is absorption costing; this allows the managers to understand the product and net
profitability in a much better way. This also provides the management with improved
information for making value-based and leading to more effective managerial decisions. ABC
technique focuses on cost drivers- the activities increase costs. Thus this technique gives accurate
results in terms of cost and profitability.
Figure 1: Process of ABC
Activity-based costing fills the information needed for re-engineering and benchmarking by
providing cost of each activity separately. This costing method also provides operating
information about the true cost of services, products, processes, distribution channels, activities,
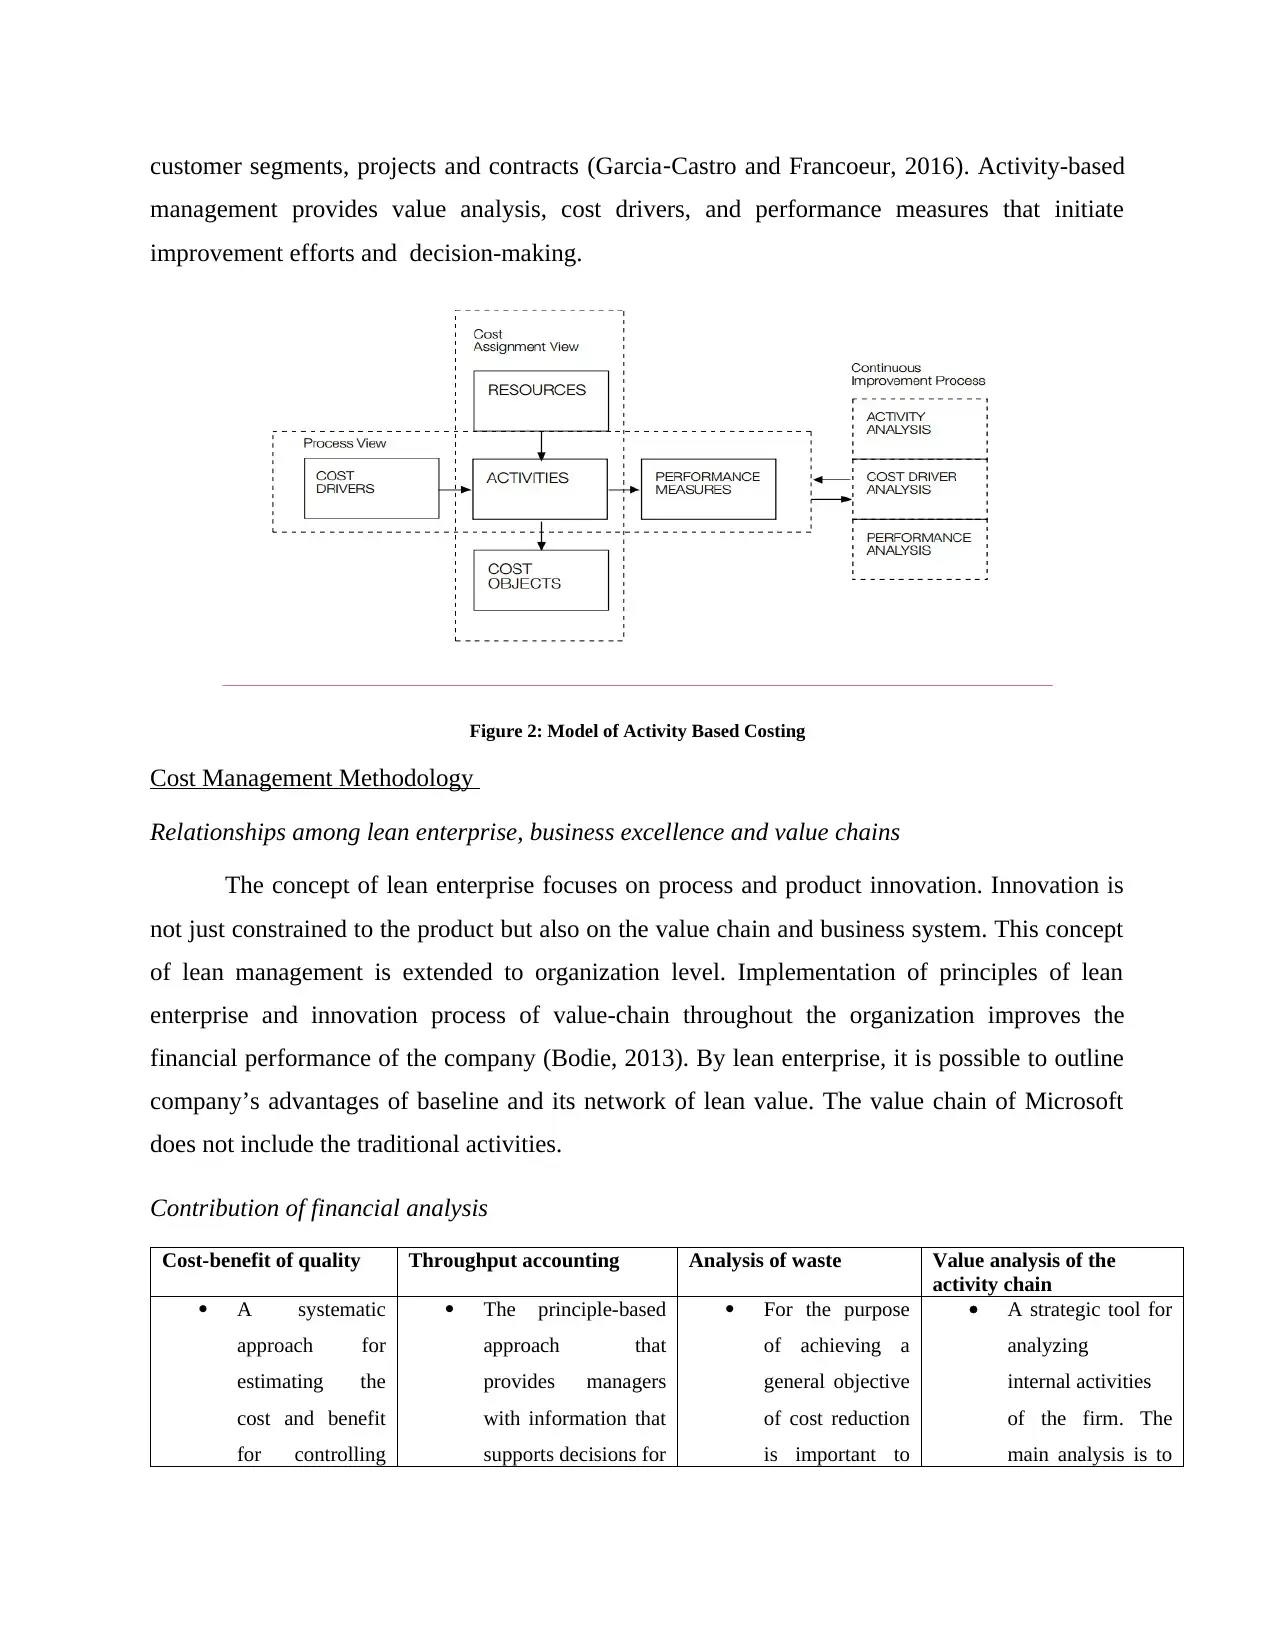
customer segments, projects and contracts (Garcia‐Castro and Francoeur, 2016). Activity-based
management provides value analysis, cost drivers, and performance measures that initiate
improvement efforts and decision-making.
Figure 2: Model of Activity Based Costing
Cost Management Methodology
Relationships among lean enterprise, business excellence and value chains
The concept of lean enterprise focuses on process and product innovation. Innovation is
not just constrained to the product but also on the value chain and business system. This concept
of lean management is extended to organization level. Implementation of principles of lean
enterprise and innovation process of value-chain throughout the organization improves the
financial performance of the company (Bodie, 2013). By lean enterprise, it is possible to outline
company’s advantages of baseline and its network of lean value. The value chain of Microsoft
does not include the traditional activities.
Contribution of financial analysis
Cost-benefit of quality Throughput accounting Analysis of waste Value analysis of the
activity chain
A systematic
approach for
estimating the
cost and benefit
for controlling
The principle-based
approach that
provides managers
with information that
supports decisions for
For the purpose
of achieving a
general objective
of cost reduction
is important to
A strategic tool for
analyzing
internal activities
of the firm. The
main analysis is to
⊘ This is a preview!⊘
Do you want full access?
Subscribe today to unlock all pages.
Trusted by 1+ million students worldwide
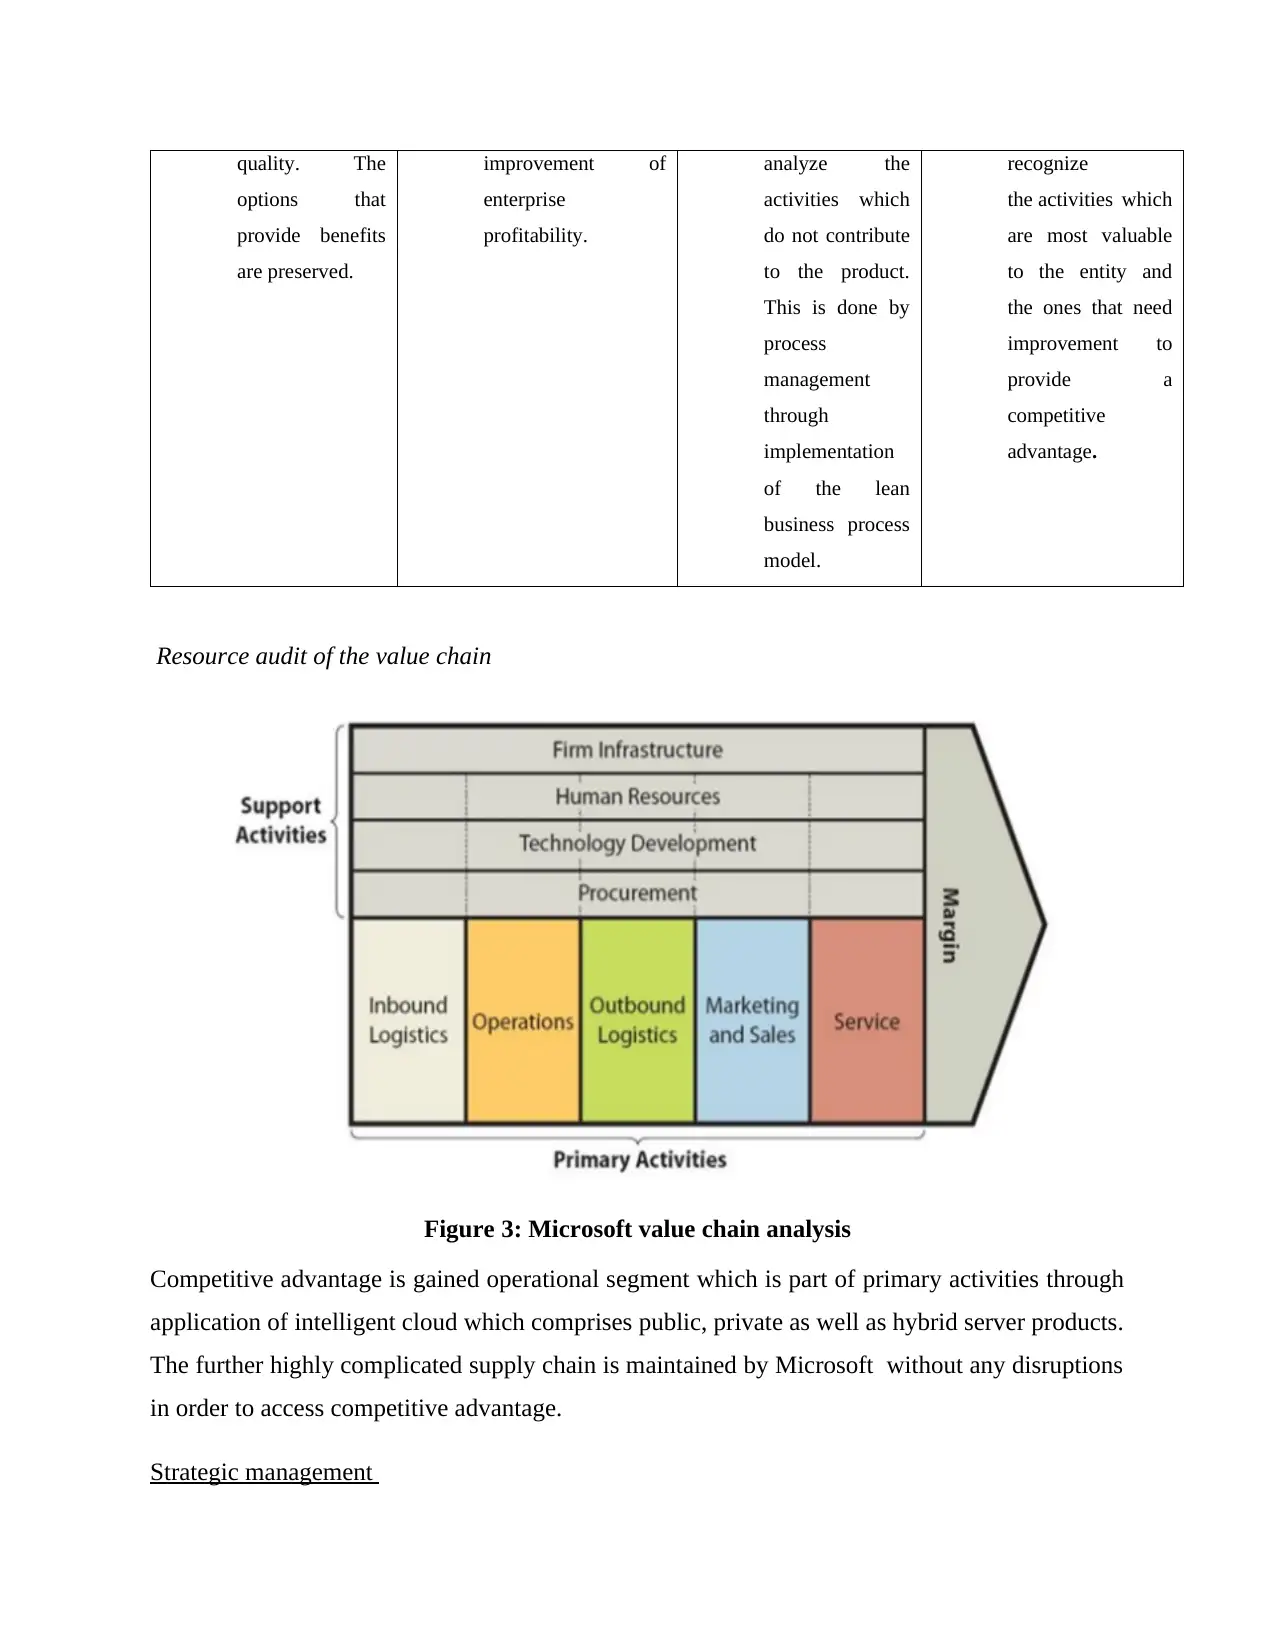
quality. The
options that
provide benefits
are preserved.
improvement of
enterprise
profitability.
analyze the
activities which
do not contribute
to the product.
This is done by
process
management
through
implementation
of the lean
business process
model.
recognize
the activities which
are most valuable
to the entity and
the ones that need
improvement to
provide a
competitive
advantage.
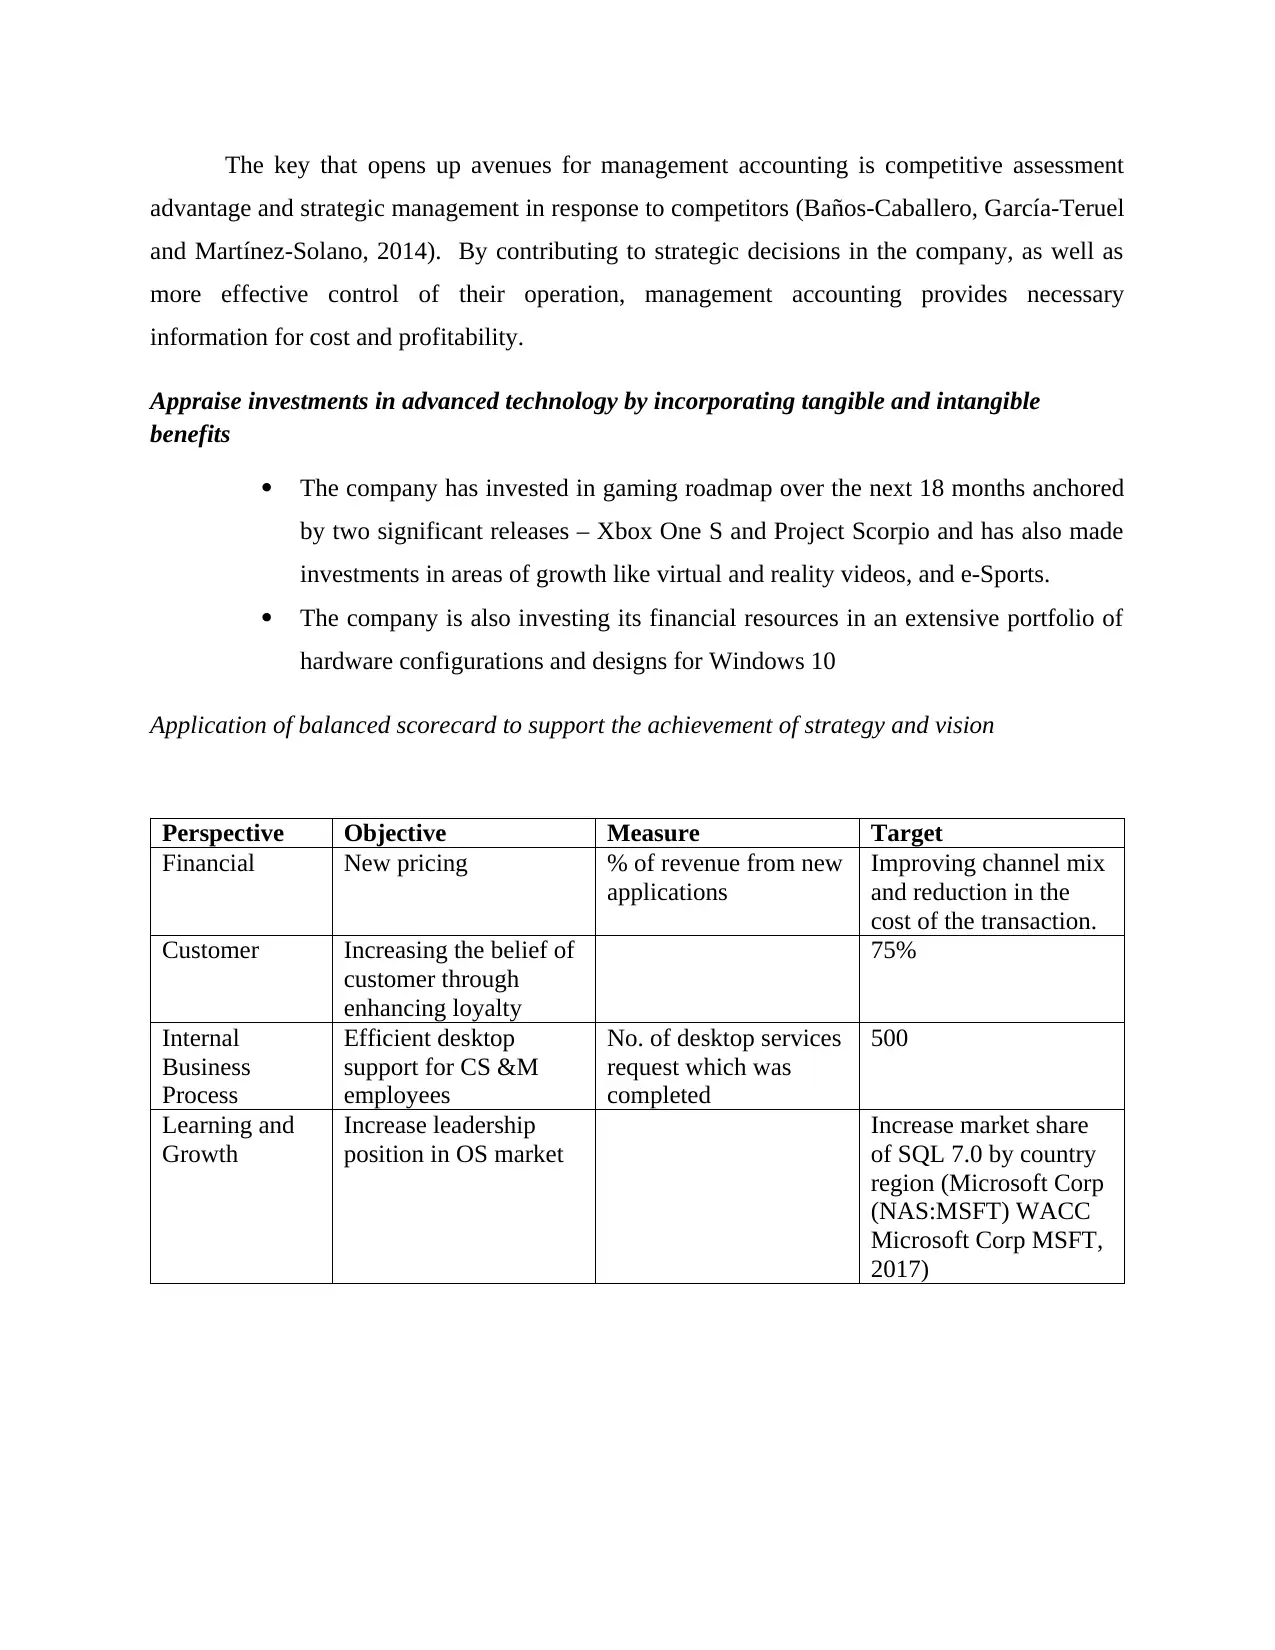
Resource audit of the value chain
Figure 3: Microsoft value chain analysis
Competitive advantage is gained operational segment which is part of primary activities through
application of intelligent cloud which comprises public, private as well as hybrid server products.
The further highly complicated supply chain is maintained by Microsoft without any disruptions
in order to access competitive advantage.
Strategic management
options that
provide benefits
are preserved.
improvement of
enterprise
profitability.
analyze the
activities which
do not contribute
to the product.
This is done by
process
management
through
implementation
of the lean
business process
model.
recognize
the activities which
are most valuable
to the entity and
the ones that need
improvement to
provide a
competitive
advantage.
Resource audit of the value chain
Figure 3: Microsoft value chain analysis
Competitive advantage is gained operational segment which is part of primary activities through
application of intelligent cloud which comprises public, private as well as hybrid server products.
The further highly complicated supply chain is maintained by Microsoft without any disruptions
in order to access competitive advantage.
Strategic management
Paraphrase This Document
Need a fresh take? Get an instant paraphrase of this document with our AI Paraphraser
The key that opens up avenues for management accounting is competitive assessment
advantage and strategic management in response to competitors (Baños-Caballero, García-Teruel
and Martínez-Solano, 2014). By contributing to strategic decisions in the company, as well as
more effective control of their operation, management accounting provides necessary
information for cost and profitability.
Appraise investments in advanced technology by incorporating tangible and intangible
benefits
The company has invested in gaming roadmap over the next 18 months anchored
by two significant releases – Xbox One S and Project Scorpio and has also made
investments in areas of growth like virtual and reality videos, and e-Sports.
The company is also investing its financial resources in an extensive portfolio of
hardware configurations and designs for Windows 10
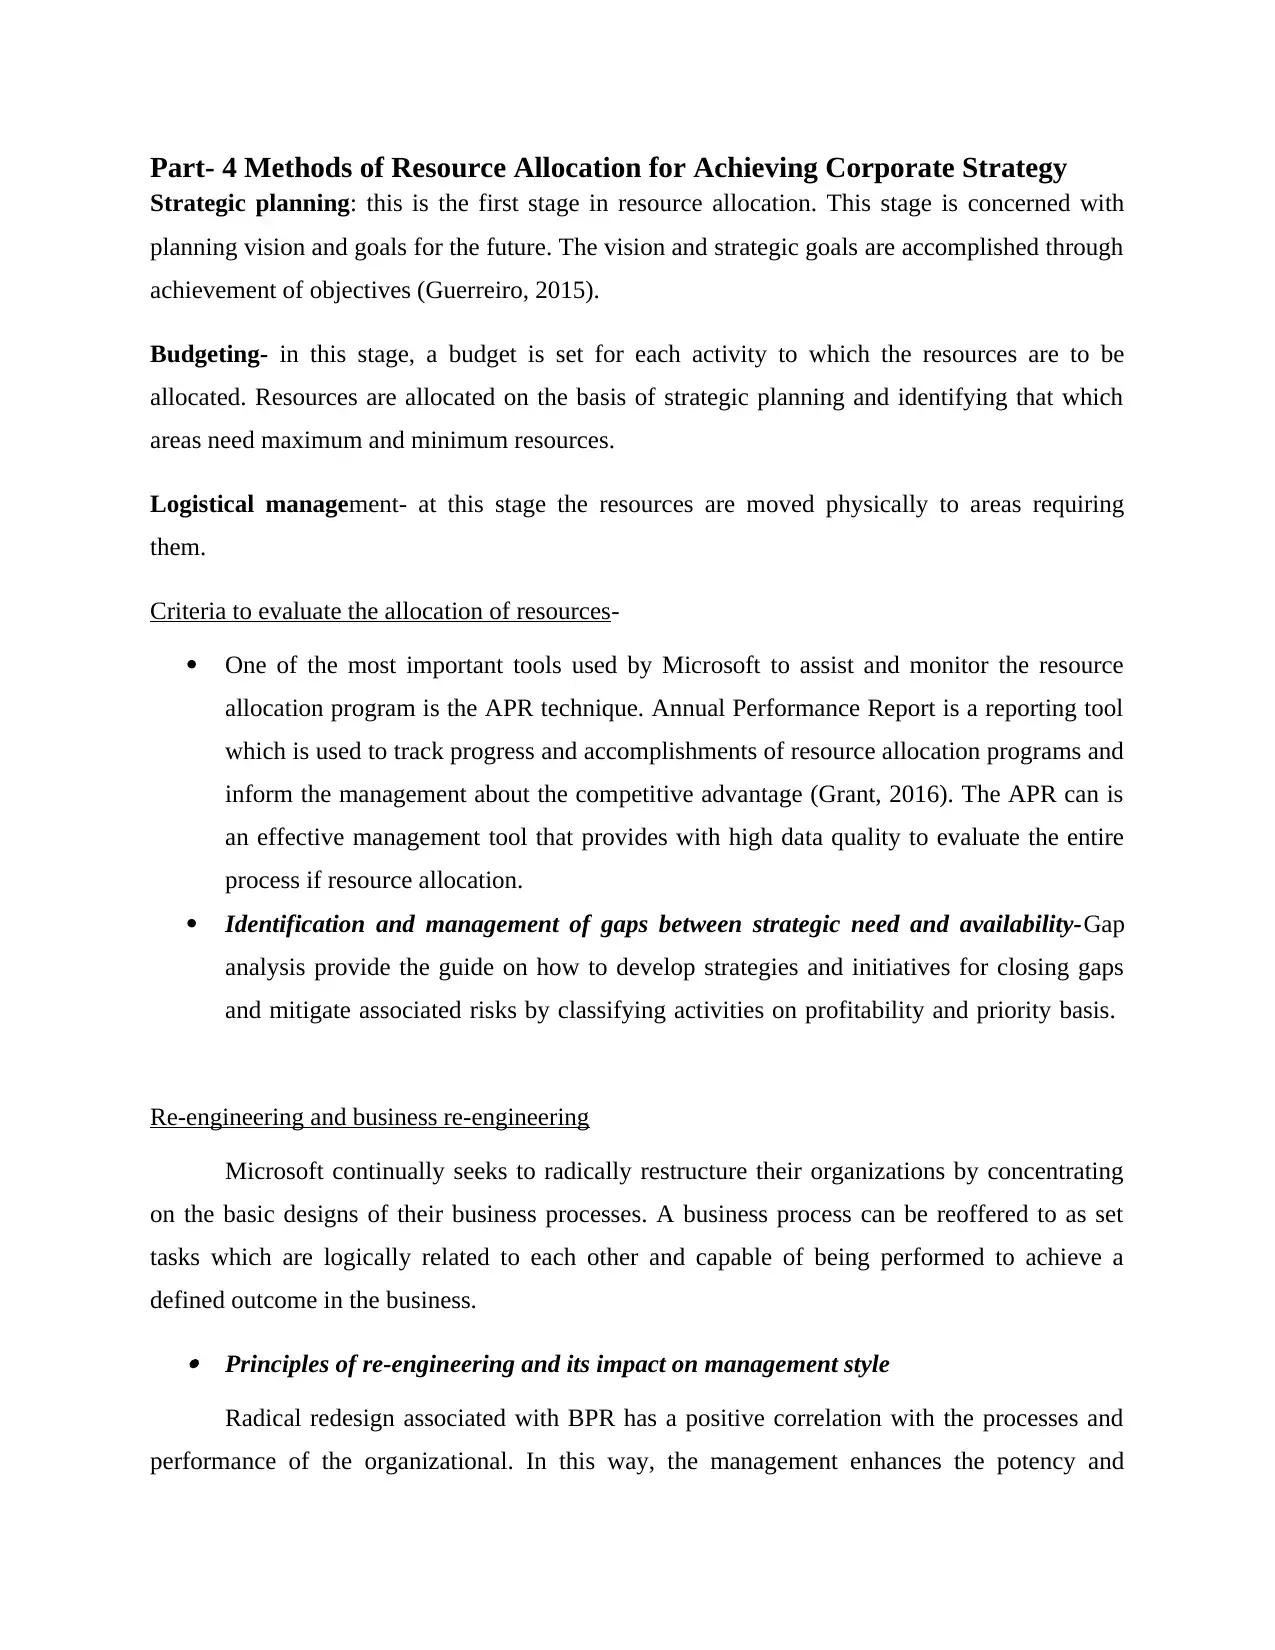
Application of balanced scorecard to support the achievement of strategy and vision
Perspective Objective Measure Target
Financial New pricing % of revenue from new
applications
Improving channel mix
and reduction in the
cost of the transaction.
Customer Increasing the belief of
customer through
enhancing loyalty
75%
Internal
Business
Process
Efficient desktop
support for CS &M
employees
No. of desktop services
request which was
completed
500
Learning and
Growth
Increase leadership
position in OS market
Increase market share
of SQL 7.0 by country
region (Microsoft Corp
(NAS:MSFT) WACC
Microsoft Corp MSFT,
2017)
advantage and strategic management in response to competitors (Baños-Caballero, García-Teruel
and Martínez-Solano, 2014). By contributing to strategic decisions in the company, as well as
more effective control of their operation, management accounting provides necessary
information for cost and profitability.
Appraise investments in advanced technology by incorporating tangible and intangible
benefits
The company has invested in gaming roadmap over the next 18 months anchored
by two significant releases – Xbox One S and Project Scorpio and has also made
investments in areas of growth like virtual and reality videos, and e-Sports.
The company is also investing its financial resources in an extensive portfolio of
hardware configurations and designs for Windows 10
Application of balanced scorecard to support the achievement of strategy and vision
Perspective Objective Measure Target
Financial New pricing % of revenue from new
applications
Improving channel mix
and reduction in the
cost of the transaction.
Customer Increasing the belief of
customer through
enhancing loyalty
75%
Internal
Business
Process
Efficient desktop
support for CS &M
employees
No. of desktop services
request which was
completed
500
Learning and
Growth
Increase leadership
position in OS market
Increase market share
of SQL 7.0 by country
region (Microsoft Corp
(NAS:MSFT) WACC
Microsoft Corp MSFT,
2017)
Part- 4 Methods of Resource Allocation for Achieving Corporate Strategy
Strategic planning: this is the first stage in resource allocation. This stage is concerned with
planning vision and goals for the future. The vision and strategic goals are accomplished through
achievement of objectives (Guerreiro, 2015).
Budgeting- in this stage, a budget is set for each activity to which the resources are to be
allocated. Resources are allocated on the basis of strategic planning and identifying that which
areas need maximum and minimum resources.
Logistical management- at this stage the resources are moved physically to areas requiring
them.
Criteria to evaluate the allocation of resources-
One of the most important tools used by Microsoft to assist and monitor the resource
allocation program is the APR technique. Annual Performance Report is a reporting tool
which is used to track progress and accomplishments of resource allocation programs and
inform the management about the competitive advantage (Grant, 2016). The APR can is
an effective management tool that provides with high data quality to evaluate the entire
process if resource allocation.
Identification and management of gaps between strategic need and availability-Gap
analysis provide the guide on how to develop strategies and initiatives for closing gaps
and mitigate associated risks by classifying activities on profitability and priority basis.
Re-engineering and business re-engineering
Microsoft continually seeks to radically restructure their organizations by concentrating
on the basic designs of their business processes. A business process can be reoffered to as set
tasks which are logically related to each other and capable of being performed to achieve a
defined outcome in the business.
Principles of re-engineering and its impact on management style
Radical redesign associated with BPR has a positive correlation with the processes and
performance of the organizational. In this way, the management enhances the potency and
⊘ This is a preview!⊘
Do you want full access?
Subscribe today to unlock all pages.
Trusted by 1+ million students worldwide
1 out of 32
Related Documents


Your All-in-One AI-Powered Toolkit for Academic Success.
+13062052269
info@desklib.com
Available 24*7 on WhatsApp / Email
![[object Object]](/_next/static/media/star-bottom.7253800d.svg)
Unlock your academic potential
Copyright © 2020–2026 A2Z Services. All Rights Reserved. Developed and managed by ZUCOL.