Comparative Financial Analysis and Valuation of Tesco PLC
VerifiedAdded on 2021/02/20
|13
|3554
|245
Report
AI Summary
This report provides a detailed financial analysis of Tesco PLC, a major player in the grocery retail sector, comparing its performance to its competitor, Morrisons. The analysis encompasses a review of the statement of financial position, income statements, and a comprehensive ratio analysis, including liquidity, profitability, and solvency criteria. The report calculates Tesco's value using asset-based valuation, the Price-Earnings (P/E) ratio method, and a dividend valuation model, employing the Capital Asset Pricing Model (CAPM) to estimate the required return. The report also discusses the limitations of the comparison and valuation methodologies, offering a critical evaluation of the approaches used. The conclusion summarizes the key findings regarding Tesco's financial health and performance relative to its competitor.
Finance.
Table of Contents
Table of Contents
Paraphrase This Document
Need a fresh take? Get an instant paraphrase of this document with our AI Paraphraser
INTRODUCTION...........................................................................................................................3
TASK...............................................................................................................................................3
2.1 Analysis of financial performance of Tesco compared to its competitor Morrisons:..........3
2.2 Company Valuation:.............................................................................................................6
2.3 Capital Structure..................................................................................................................10
CONCLUSION..............................................................................................................................12
REFERENCES..............................................................................................................................14
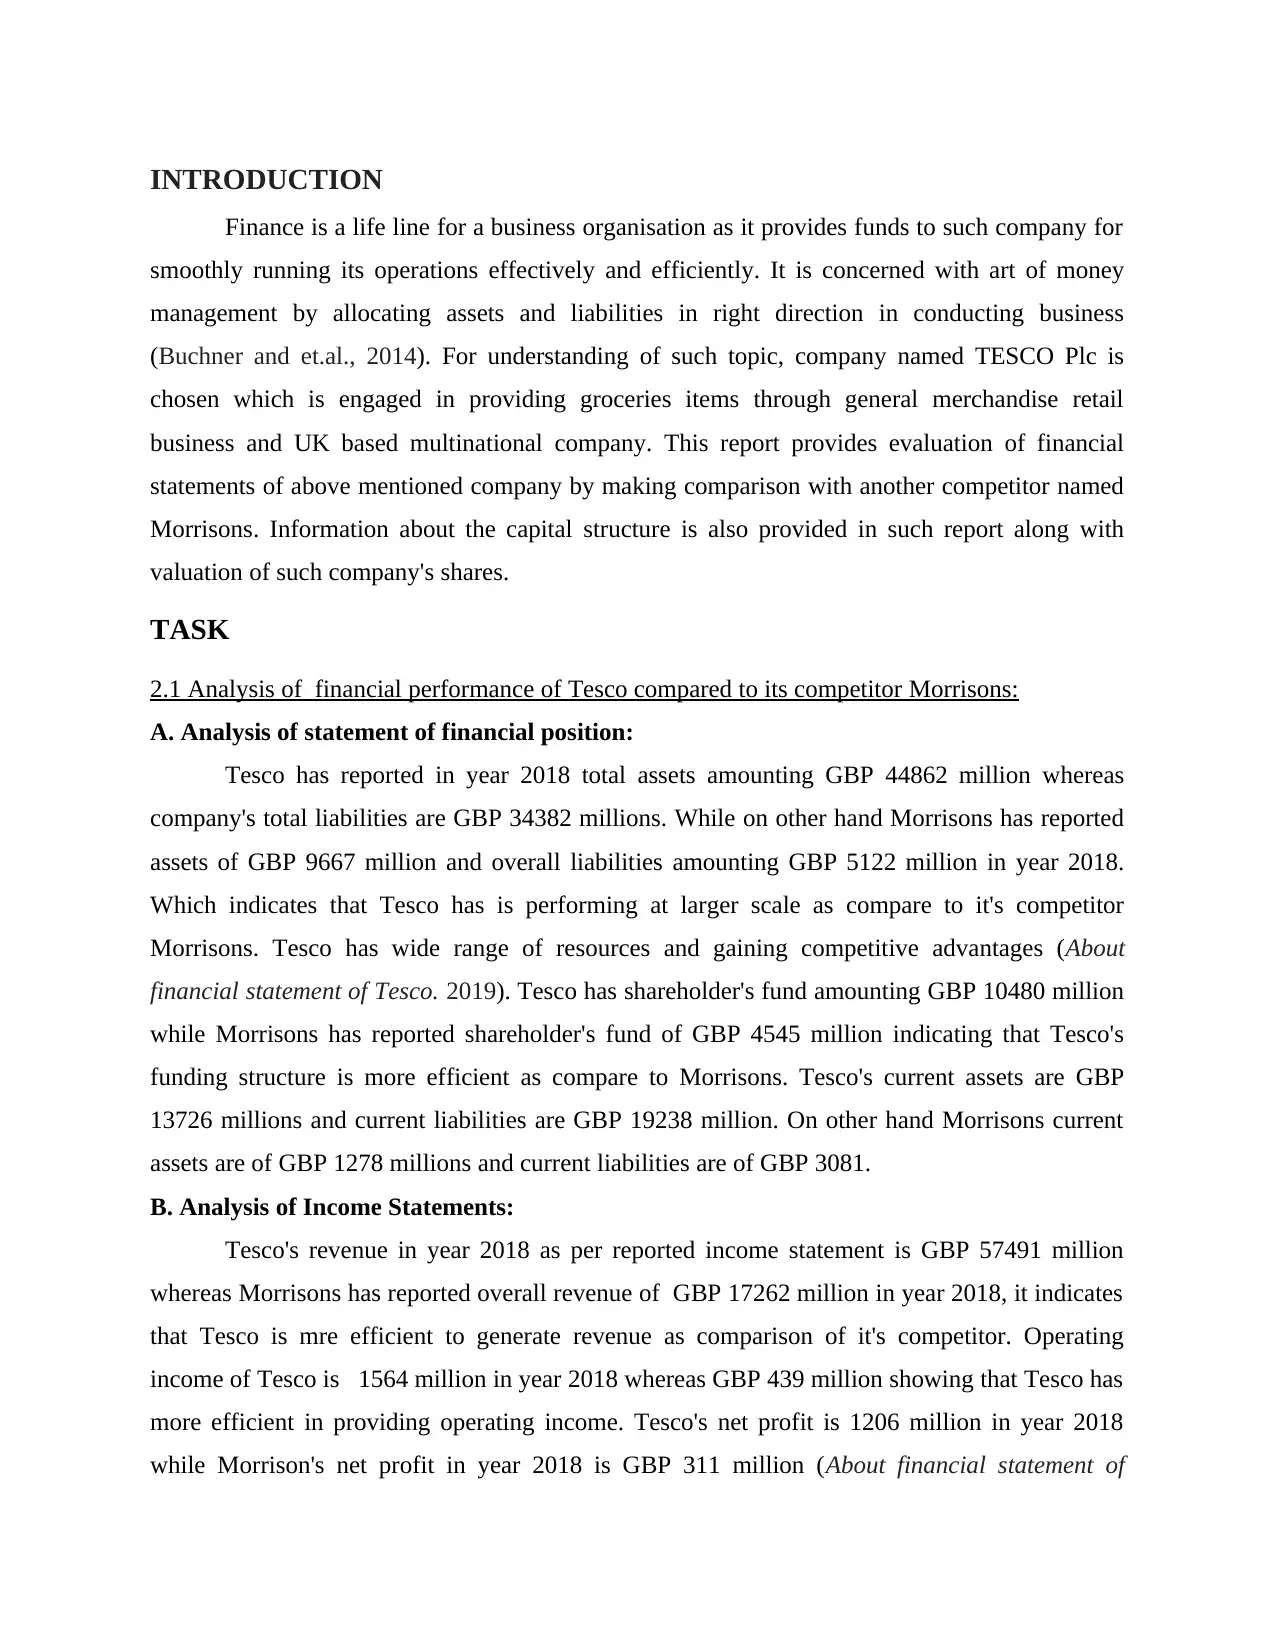
INTRODUCTION
Finance is a life line for a business organisation as it provides funds to such company for
smoothly running its operations effectively and efficiently. It is concerned with art of money
management by allocating assets and liabilities in right direction in conducting business
(Buchner and et.al., 2014). For understanding of such topic, company named TESCO Plc is
chosen which is engaged in providing groceries items through general merchandise retail
business and UK based multinational company. This report provides evaluation of financial
statements of above mentioned company by making comparison with another competitor named
Morrisons. Information about the capital structure is also provided in such report along with
valuation of such company's shares.
TASK
2.1 Analysis of financial performance of Tesco compared to its competitor Morrisons:
A. Analysis of statement of financial position:
Tesco has reported in year 2018 total assets amounting GBP 44862 million whereas
company's total liabilities are GBP 34382 millions. While on other hand Morrisons has reported
assets of GBP 9667 million and overall liabilities amounting GBP 5122 million in year 2018.
Which indicates that Tesco has is performing at larger scale as compare to it's competitor
Morrisons. Tesco has wide range of resources and gaining competitive advantages (About
financial statement of Tesco. 2019). Tesco has shareholder's fund amounting GBP 10480 million
while Morrisons has reported shareholder's fund of GBP 4545 million indicating that Tesco's
funding structure is more efficient as compare to Morrisons. Tesco's current assets are GBP
13726 millions and current liabilities are GBP 19238 million. On other hand Morrisons current
assets are of GBP 1278 millions and current liabilities are of GBP 3081.
B. Analysis of Income Statements:
Tesco's revenue in year 2018 as per reported income statement is GBP 57491 million
whereas Morrisons has reported overall revenue of GBP 17262 million in year 2018, it indicates
that Tesco is mre efficient to generate revenue as comparison of it's competitor. Operating
income of Tesco is 1564 million in year 2018 whereas GBP 439 million showing that Tesco has
more efficient in providing operating income. Tesco's net profit is 1206 million in year 2018
while Morrison's net profit in year 2018 is GBP 311 million (About financial statement of
⊘ This is a preview!⊘
Do you want full access?
Subscribe today to unlock all pages.
Trusted by 1+ million students worldwide
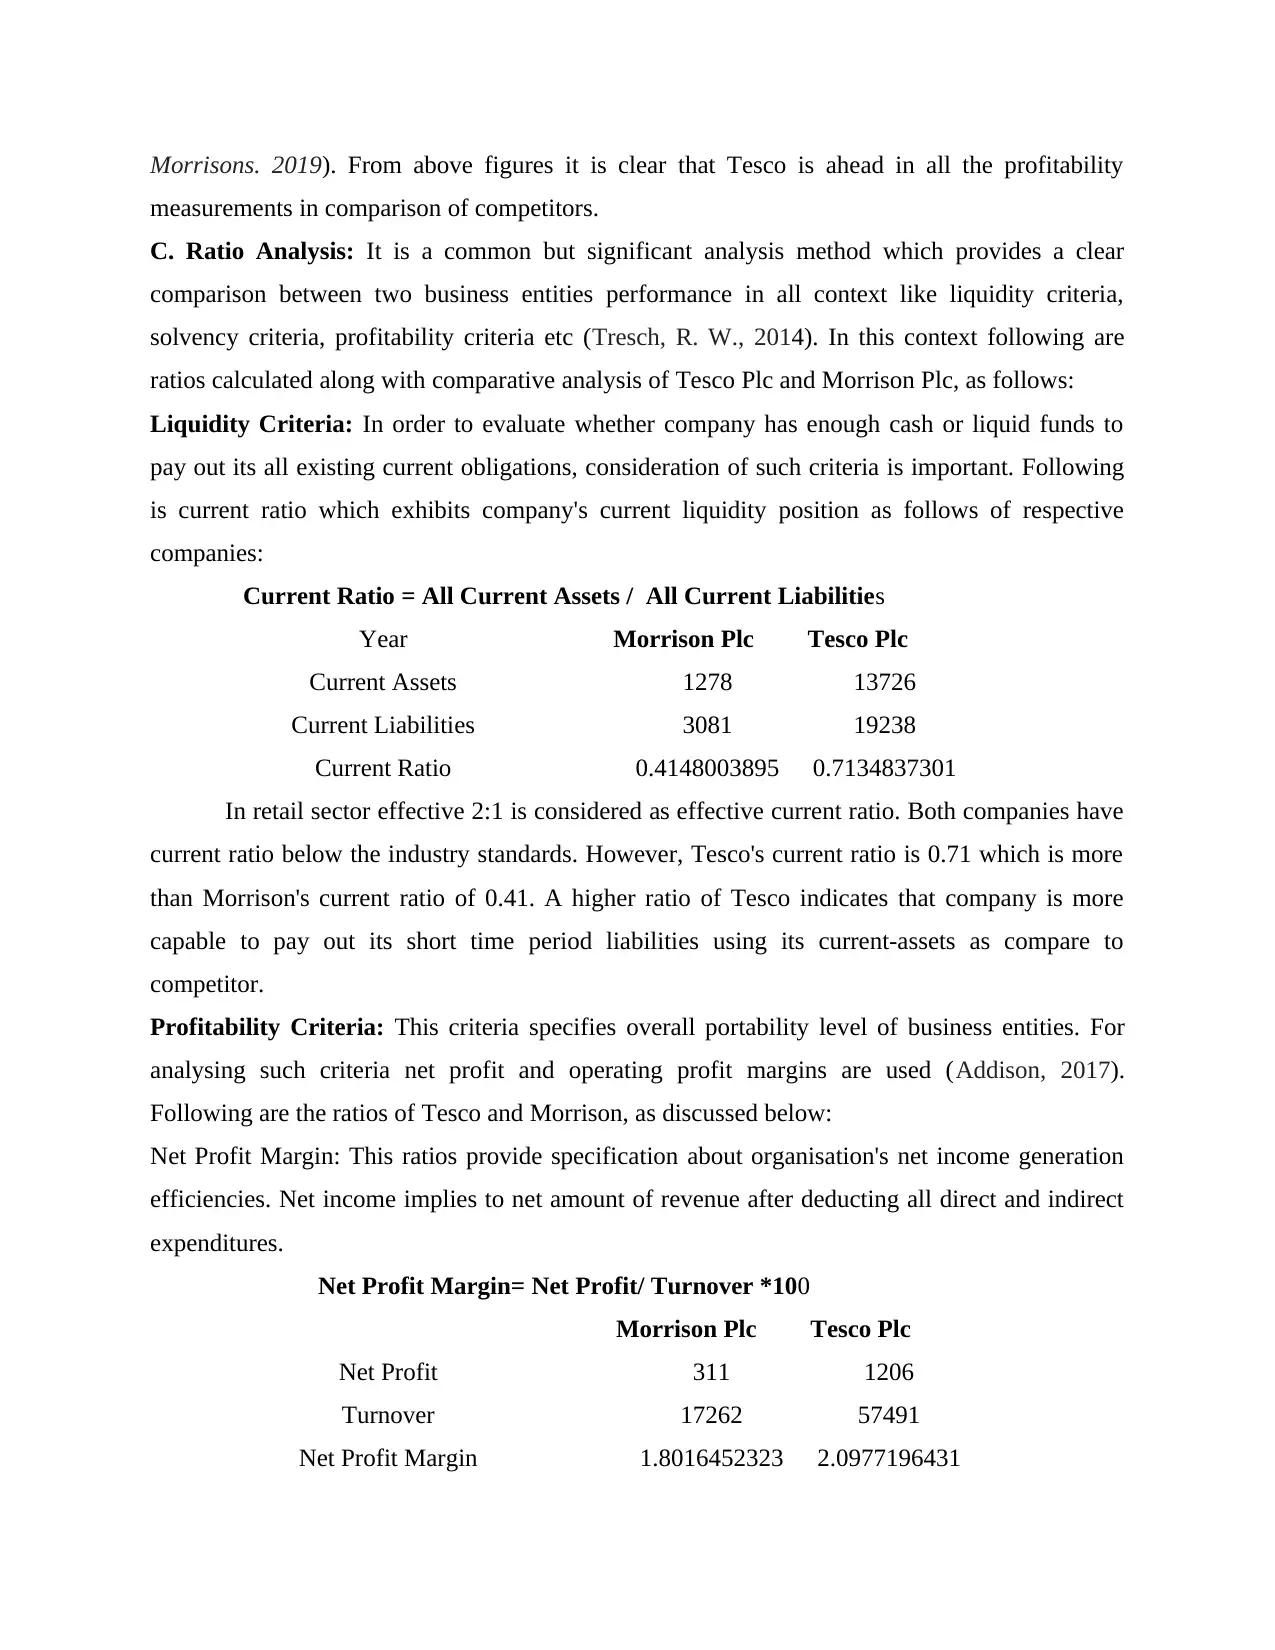
Morrisons. 2019). From above figures it is clear that Tesco is ahead in all the profitability
measurements in comparison of competitors.
C. Ratio Analysis: It is a common but significant analysis method which provides a clear
comparison between two business entities performance in all context like liquidity criteria,
solvency criteria, profitability criteria etc (Tresch, R. W., 2014). In this context following are
ratios calculated along with comparative analysis of Tesco Plc and Morrison Plc, as follows:
Liquidity Criteria: In order to evaluate whether company has enough cash or liquid funds to
pay out its all existing current obligations, consideration of such criteria is important. Following
is current ratio which exhibits company's current liquidity position as follows of respective
companies:
Current Ratio = All Current Assets / All Current Liabilities
Year Morrison Plc Tesco Plc
Current Assets 1278 13726
Current Liabilities 3081 19238
Current Ratio 0.4148003895 0.7134837301
In retail sector effective 2:1 is considered as effective current ratio. Both companies have
current ratio below the industry standards. However, Tesco's current ratio is 0.71 which is more
than Morrison's current ratio of 0.41. A higher ratio of Tesco indicates that company is more
capable to pay out its short time period liabilities using its current-assets as compare to
competitor.
Profitability Criteria: This criteria specifies overall portability level of business entities. For
analysing such criteria net profit and operating profit margins are used (Addison, 2017).
Following are the ratios of Tesco and Morrison, as discussed below:
Net Profit Margin: This ratios provide specification about organisation's net income generation
efficiencies. Net income implies to net amount of revenue after deducting all direct and indirect
expenditures.
Net Profit Margin= Net Profit/ Turnover *100
Morrison Plc Tesco Plc
Net Profit 311 1206
Turnover 17262 57491
Net Profit Margin 1.8016452323 2.0977196431
Paraphrase This Document
Need a fresh take? Get an instant paraphrase of this document with our AI Paraphraser
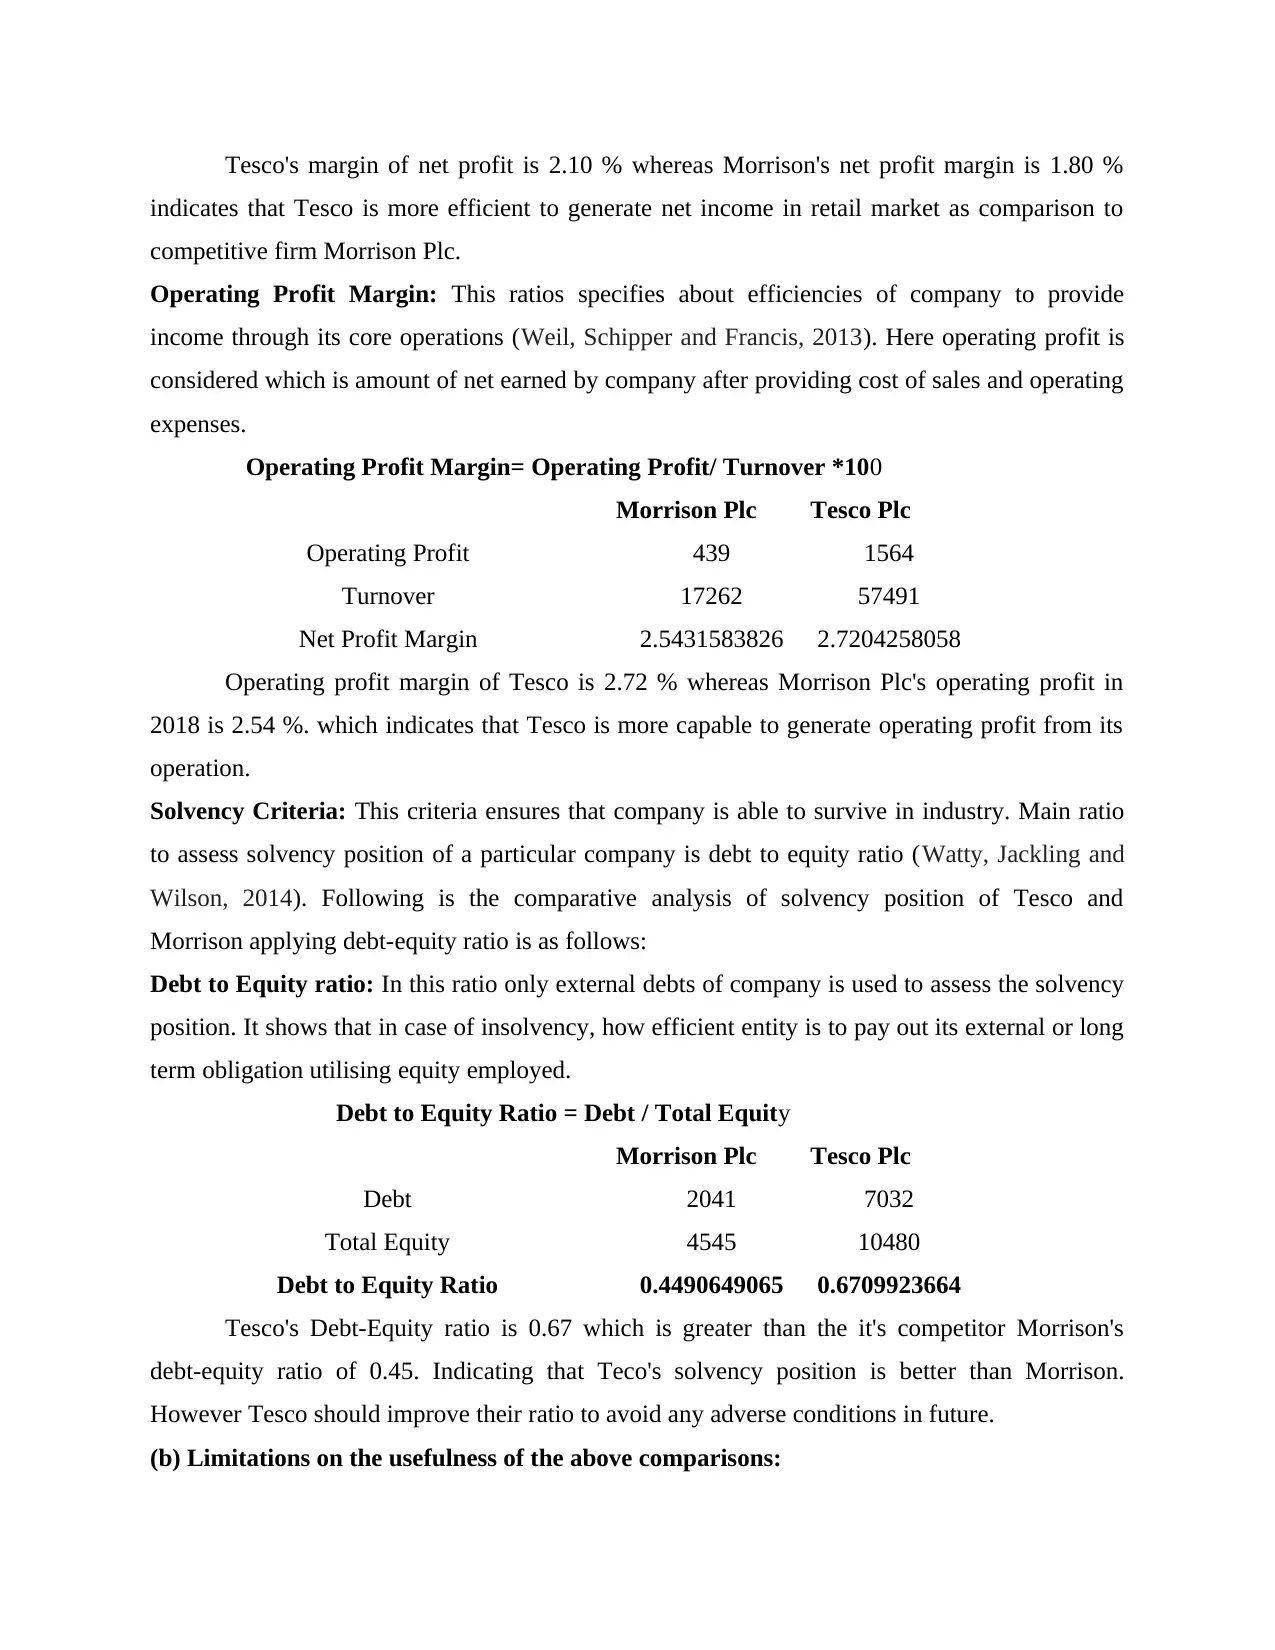
Tesco's margin of net profit is 2.10 % whereas Morrison's net profit margin is 1.80 %
indicates that Tesco is more efficient to generate net income in retail market as comparison to
competitive firm Morrison Plc.
Operating Profit Margin: This ratios specifies about efficiencies of company to provide
income through its core operations (Weil, Schipper and Francis, 2013). Here operating profit is
considered which is amount of net earned by company after providing cost of sales and operating
expenses.
Operating Profit Margin= Operating Profit/ Turnover *100
Morrison Plc Tesco Plc
Operating Profit 439 1564
Turnover 17262 57491
Net Profit Margin 2.5431583826 2.7204258058
Operating profit margin of Tesco is 2.72 % whereas Morrison Plc's operating profit in
2018 is 2.54 %. which indicates that Tesco is more capable to generate operating profit from its
operation.
Solvency Criteria: This criteria ensures that company is able to survive in industry. Main ratio
to assess solvency position of a particular company is debt to equity ratio (Watty, Jackling and
Wilson, 2014). Following is the comparative analysis of solvency position of Tesco and
Morrison applying debt-equity ratio is as follows:
Debt to Equity ratio: In this ratio only external debts of company is used to assess the solvency
position. It shows that in case of insolvency, how efficient entity is to pay out its external or long
term obligation utilising equity employed.
Debt to Equity Ratio = Debt / Total Equity
Morrison Plc Tesco Plc
Debt 2041 7032
Total Equity 4545 10480
Debt to Equity Ratio 0.4490649065 0.6709923664
Tesco's Debt-Equity ratio is 0.67 which is greater than the it's competitor Morrison's
debt-equity ratio of 0.45. Indicating that Teco's solvency position is better than Morrison.
However Tesco should improve their ratio to avoid any adverse conditions in future.
(b) Limitations on the usefulness of the above comparisons:
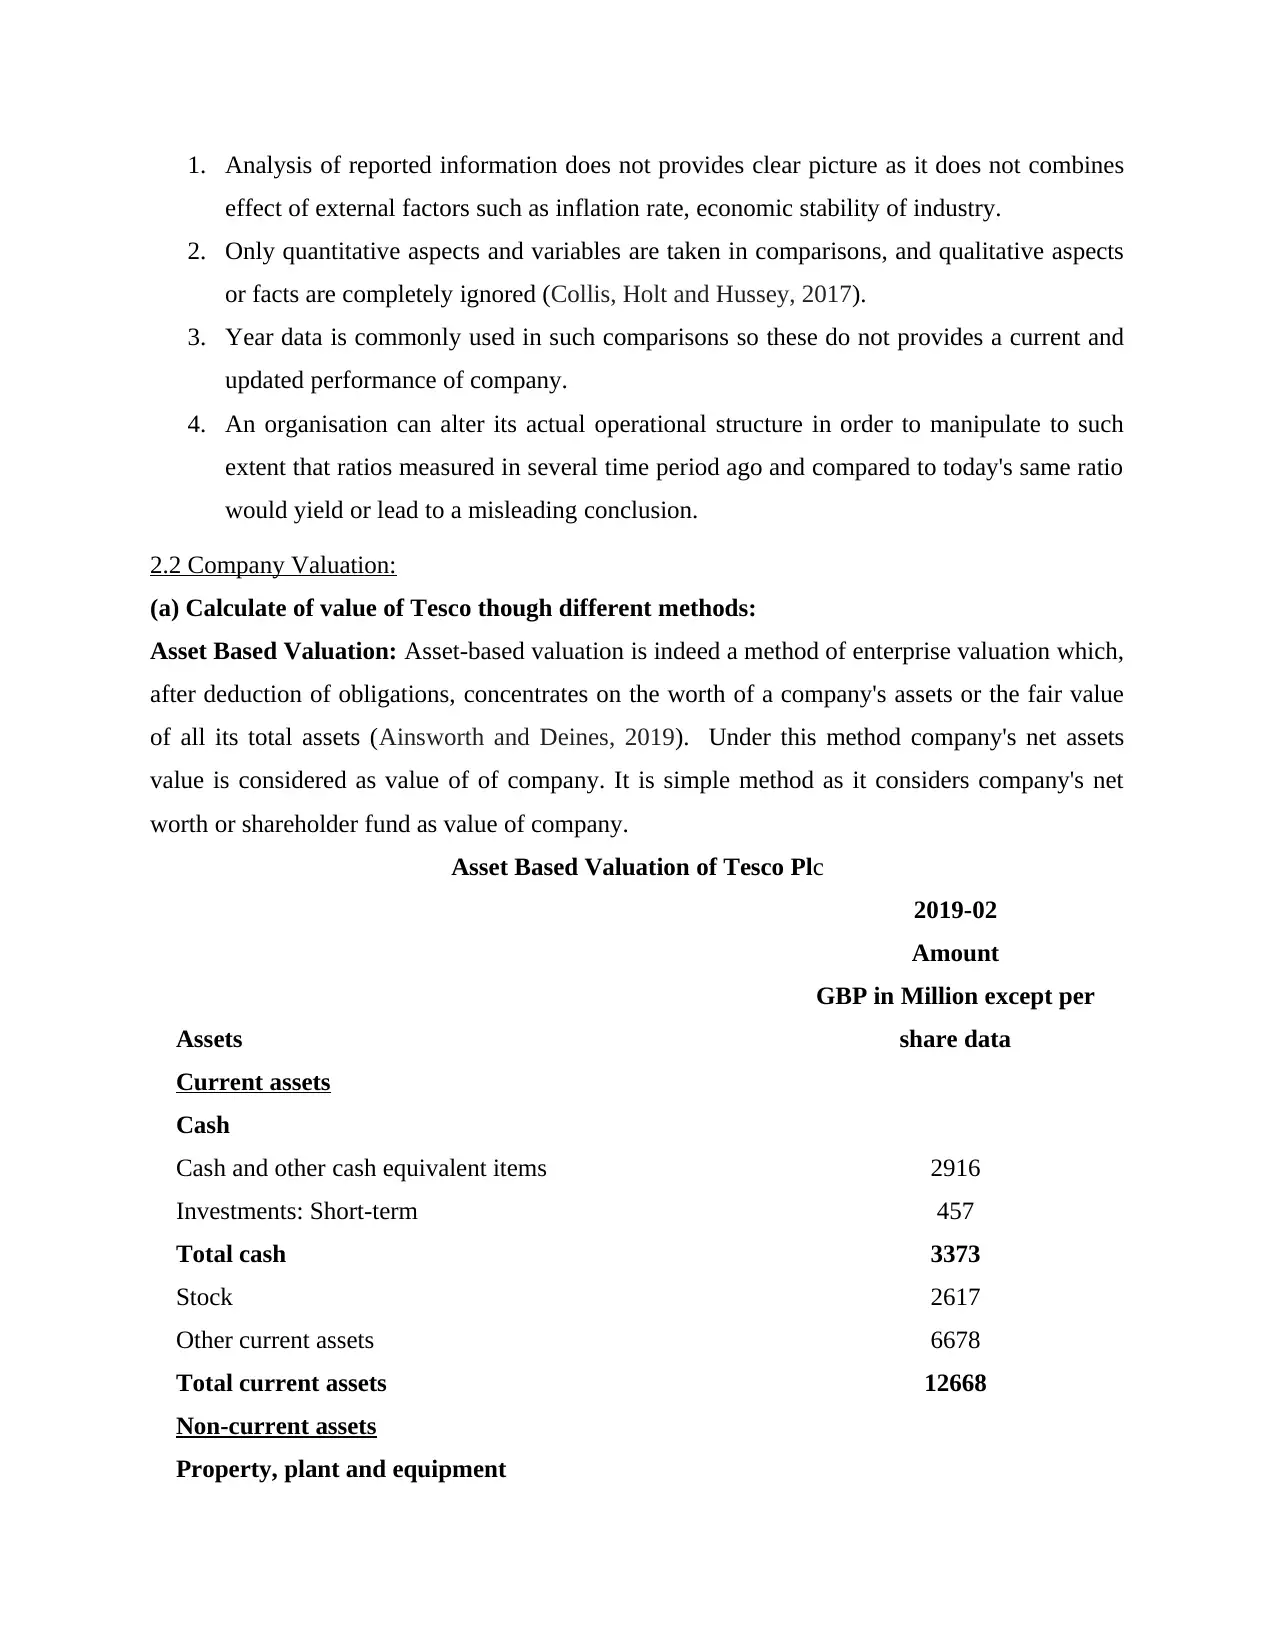
1. Analysis of reported information does not provides clear picture as it does not combines
effect of external factors such as inflation rate, economic stability of industry.
2. Only quantitative aspects and variables are taken in comparisons, and qualitative aspects
or facts are completely ignored (Collis, Holt and Hussey, 2017).
3. Year data is commonly used in such comparisons so these do not provides a current and
updated performance of company.
4. An organisation can alter its actual operational structure in order to manipulate to such
extent that ratios measured in several time period ago and compared to today's same ratio
would yield or lead to a misleading conclusion.
2.2 Company Valuation:
(a) Calculate of value of Tesco though different methods:
Asset Based Valuation: Asset-based valuation is indeed a method of enterprise valuation which,
after deduction of obligations, concentrates on the worth of a company's assets or the fair value
of all its total assets (Ainsworth and Deines, 2019). Under this method company's net assets
value is considered as value of of company. It is simple method as it considers company's net
worth or shareholder fund as value of company.
Asset Based Valuation of Tesco Plc
2019-02
Amount
Assets
GBP in Million except per
share data
Current assets
Cash
Cash and other cash equivalent items 2916
Investments: Short-term 457
Total cash 3373
Stock 2617
Other current assets 6678
Total current assets 12668
Non-current assets
Property, plant and equipment
⊘ This is a preview!⊘
Do you want full access?
Subscribe today to unlock all pages.
Trusted by 1+ million students worldwide
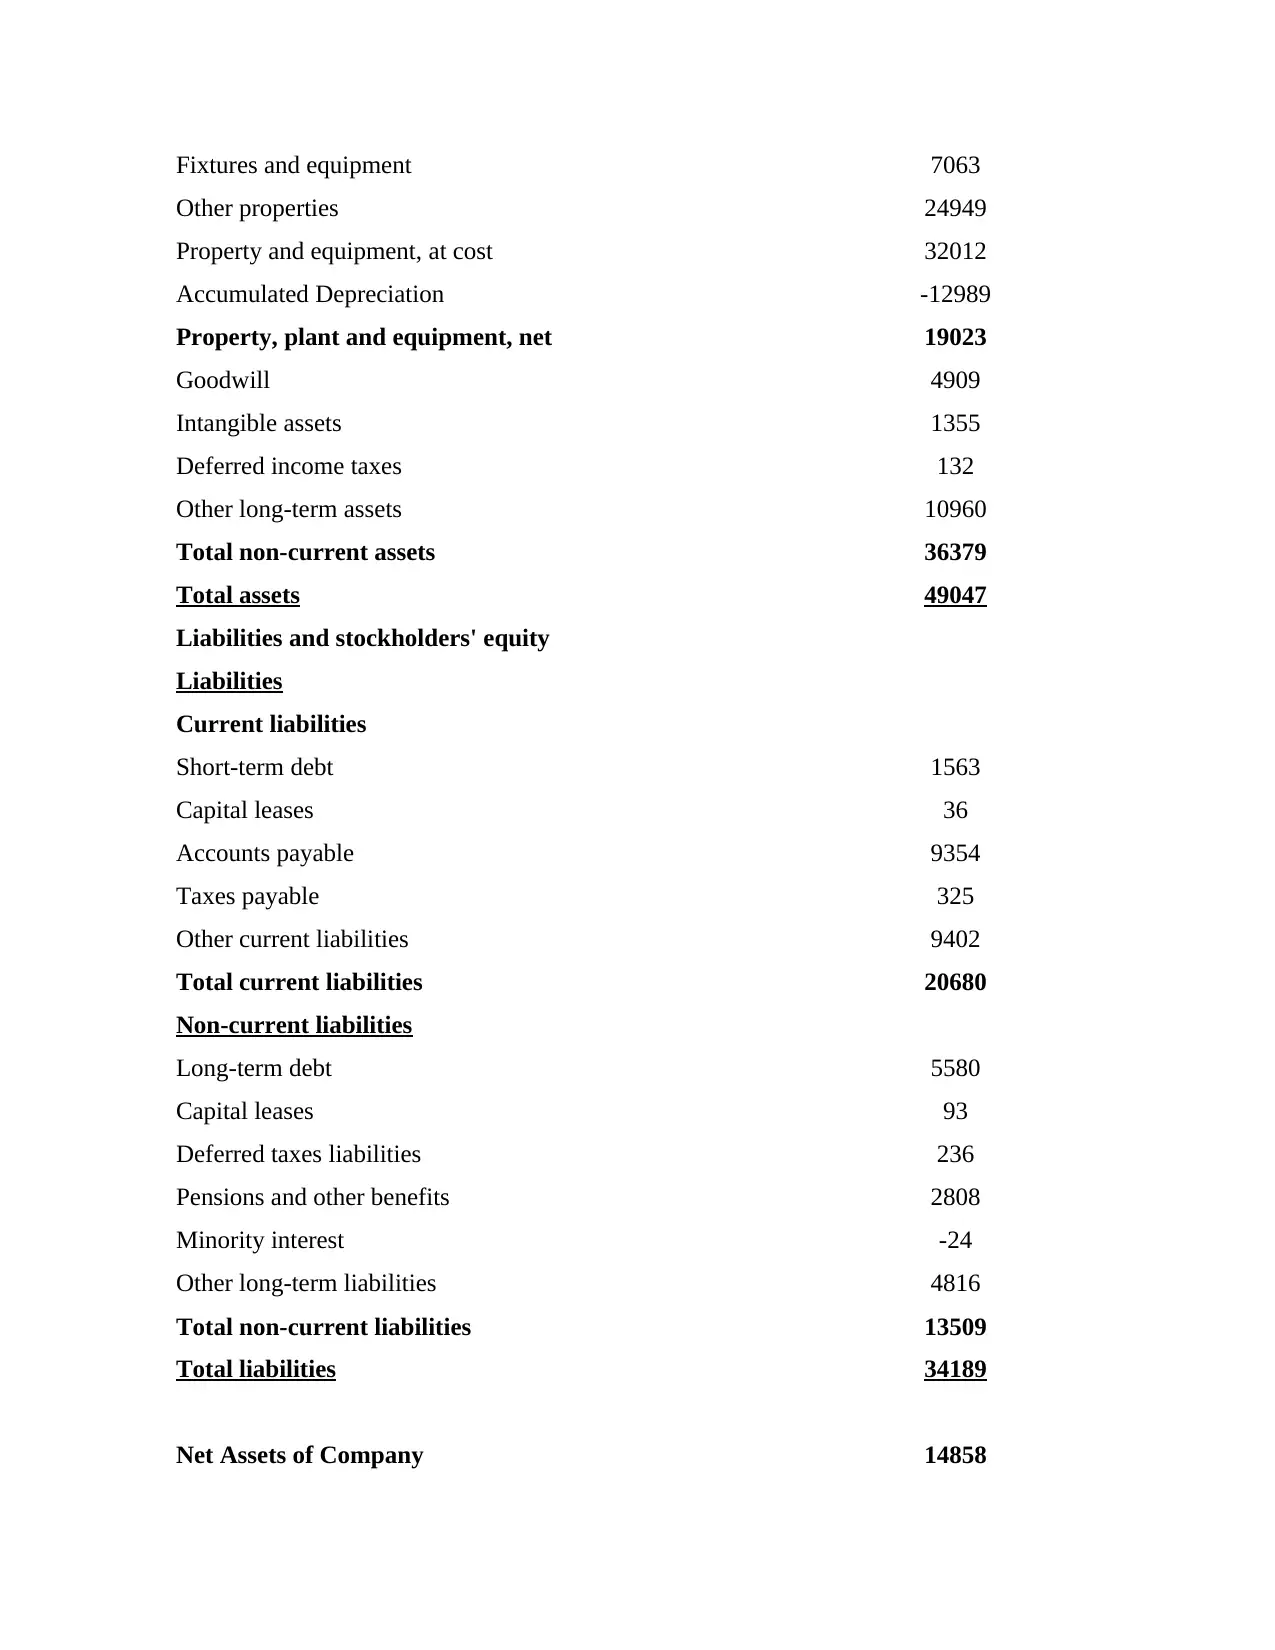
Fixtures and equipment 7063
Other properties 24949
Property and equipment, at cost 32012
Accumulated Depreciation -12989
Property, plant and equipment, net 19023
Goodwill 4909
Intangible assets 1355
Deferred income taxes 132
Other long-term assets 10960
Total non-current assets 36379
Total assets 49047
Liabilities and stockholders' equity
Liabilities
Current liabilities
Short-term debt 1563
Capital leases 36
Accounts payable 9354
Taxes payable 325
Other current liabilities 9402
Total current liabilities 20680
Non-current liabilities
Long-term debt 5580
Capital leases 93
Deferred taxes liabilities 236
Pensions and other benefits 2808
Minority interest -24
Other long-term liabilities 4816
Total non-current liabilities 13509
Total liabilities 34189
Net Assets of Company 14858
Paraphrase This Document
Need a fresh take? Get an instant paraphrase of this document with our AI Paraphraser
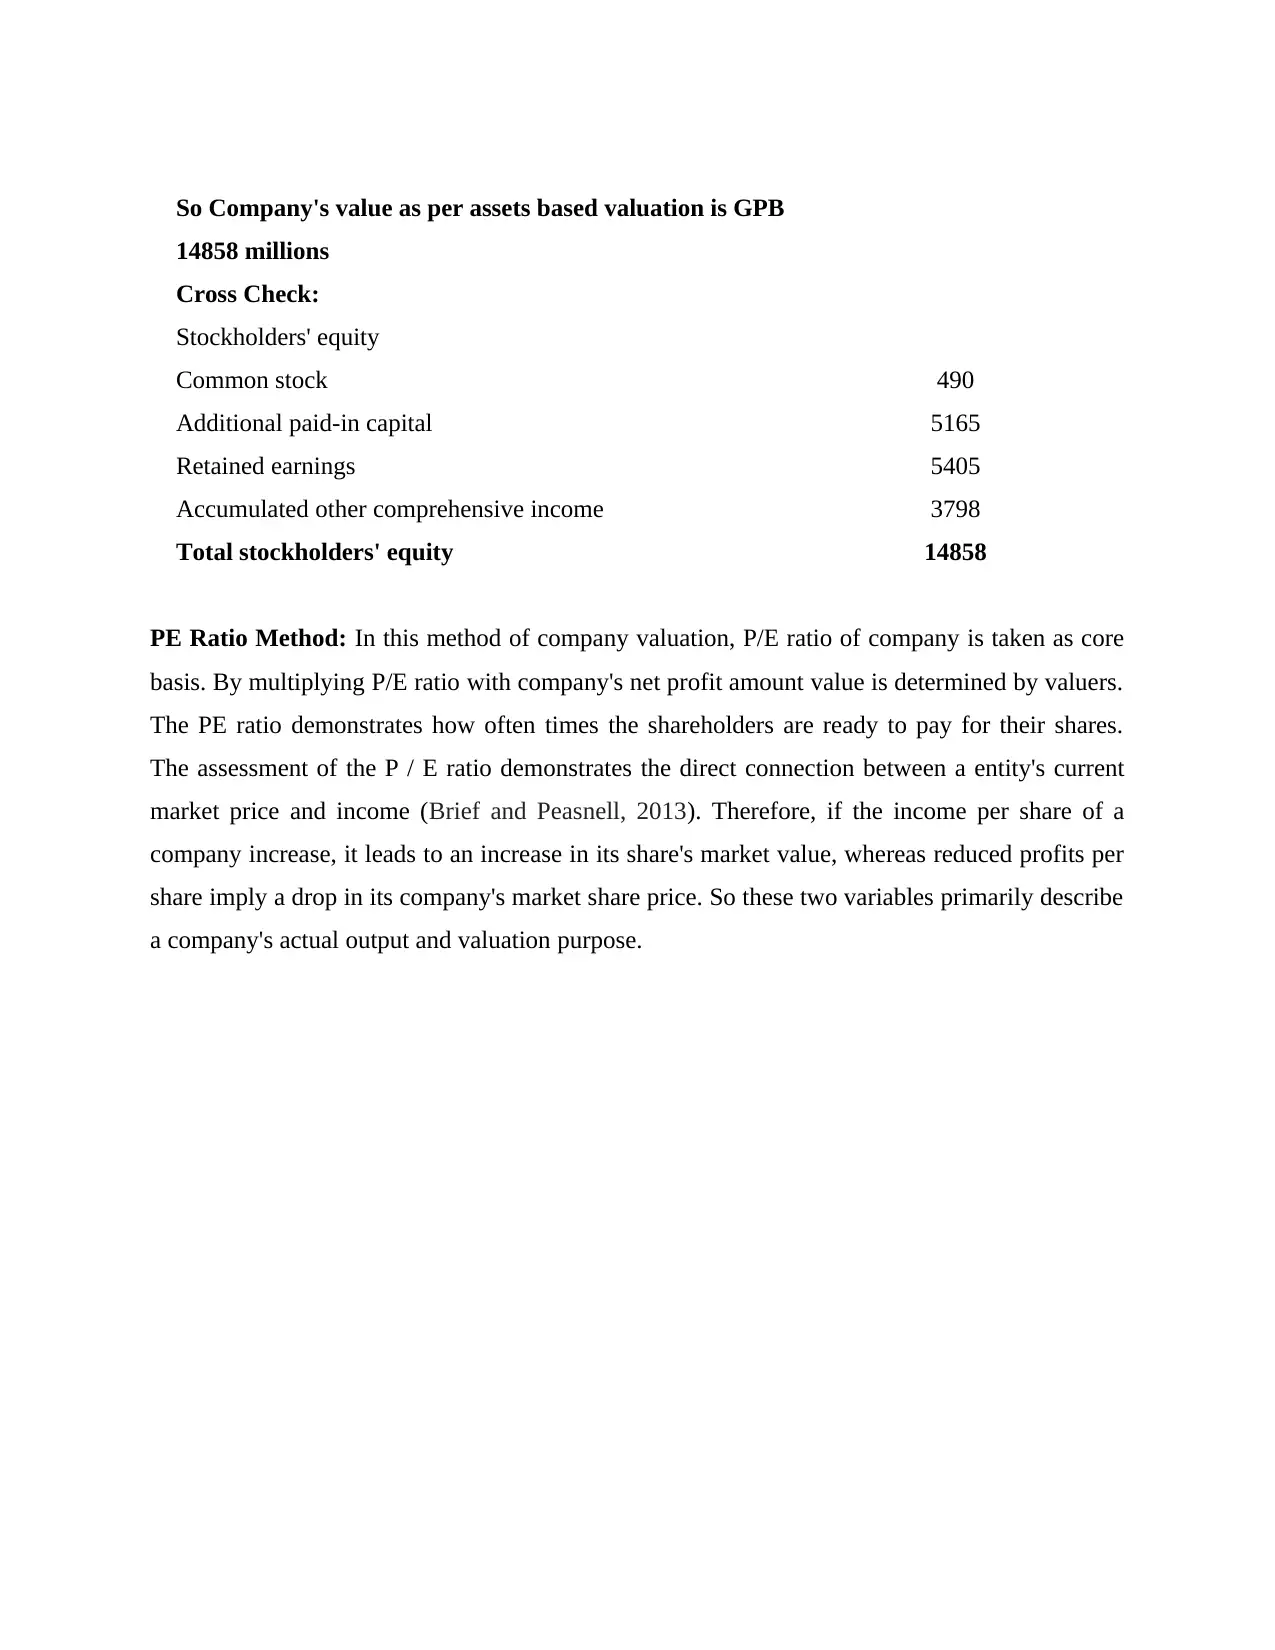
So Company's value as per assets based valuation is GPB
14858 millions
Cross Check:
Stockholders' equity
Common stock 490
Additional paid-in capital 5165
Retained earnings 5405
Accumulated other comprehensive income 3798
Total stockholders' equity 14858
PE Ratio Method: In this method of company valuation, P/E ratio of company is taken as core
basis. By multiplying P/E ratio with company's net profit amount value is determined by valuers.
The PE ratio demonstrates how often times the shareholders are ready to pay for their shares.
The assessment of the P / E ratio demonstrates the direct connection between a entity's current
market price and income (Brief and Peasnell, 2013). Therefore, if the income per share of a
company increase, it leads to an increase in its share's market value, whereas reduced profits per
share imply a drop in its company's market share price. So these two variables primarily describe
a company's actual output and valuation purpose.
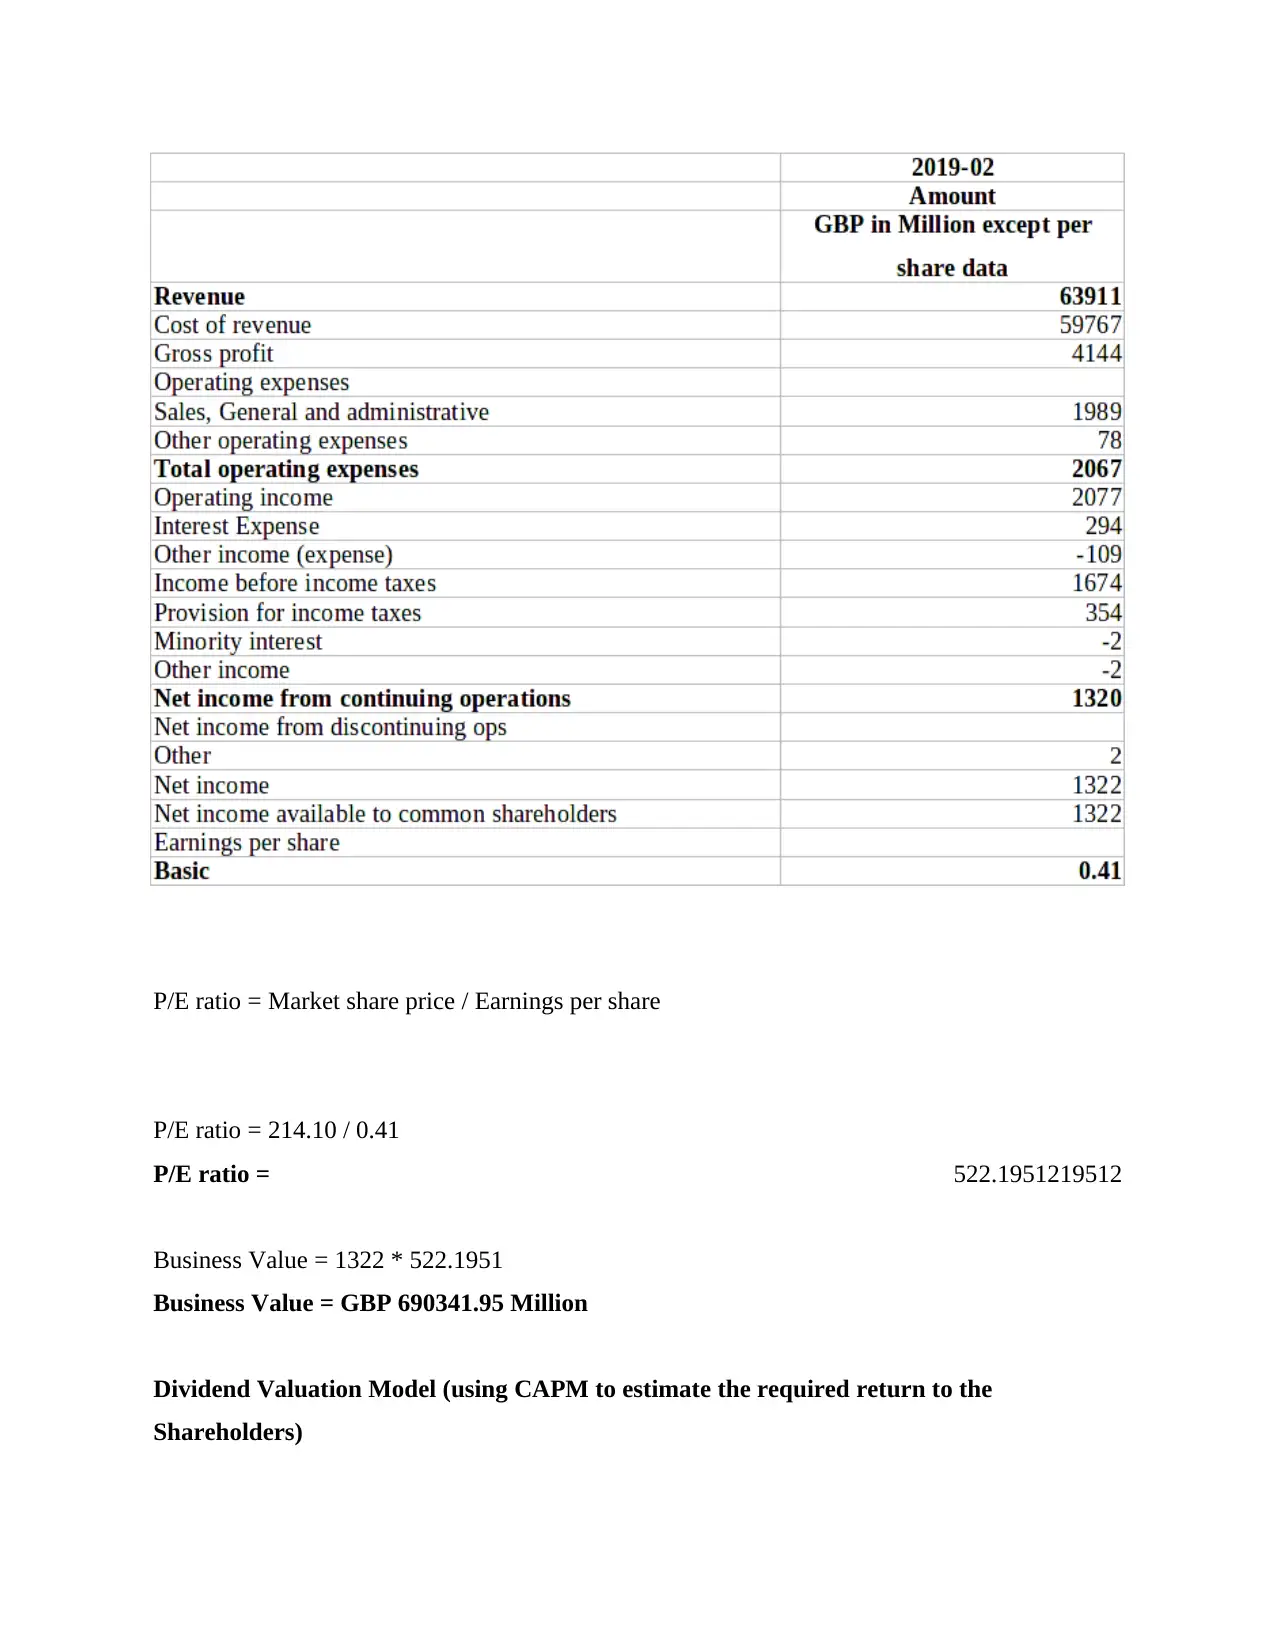
P/E ratio = Market share price / Earnings per share
P/E ratio = 214.10 / 0.41
P/E ratio = 522.1951219512
Business Value = 1322 * 522.1951
Business Value = GBP 690341.95 Million
Dividend Valuation Model (using CAPM to estimate the required return to the
Shareholders)
P/E ratio = 214.10 / 0.41
P/E ratio = 522.1951219512
Business Value = 1322 * 522.1951
Business Value = GBP 690341.95 Million
Dividend Valuation Model (using CAPM to estimate the required return to the
Shareholders)
⊘ This is a preview!⊘
Do you want full access?
Subscribe today to unlock all pages.
Trusted by 1+ million students worldwide
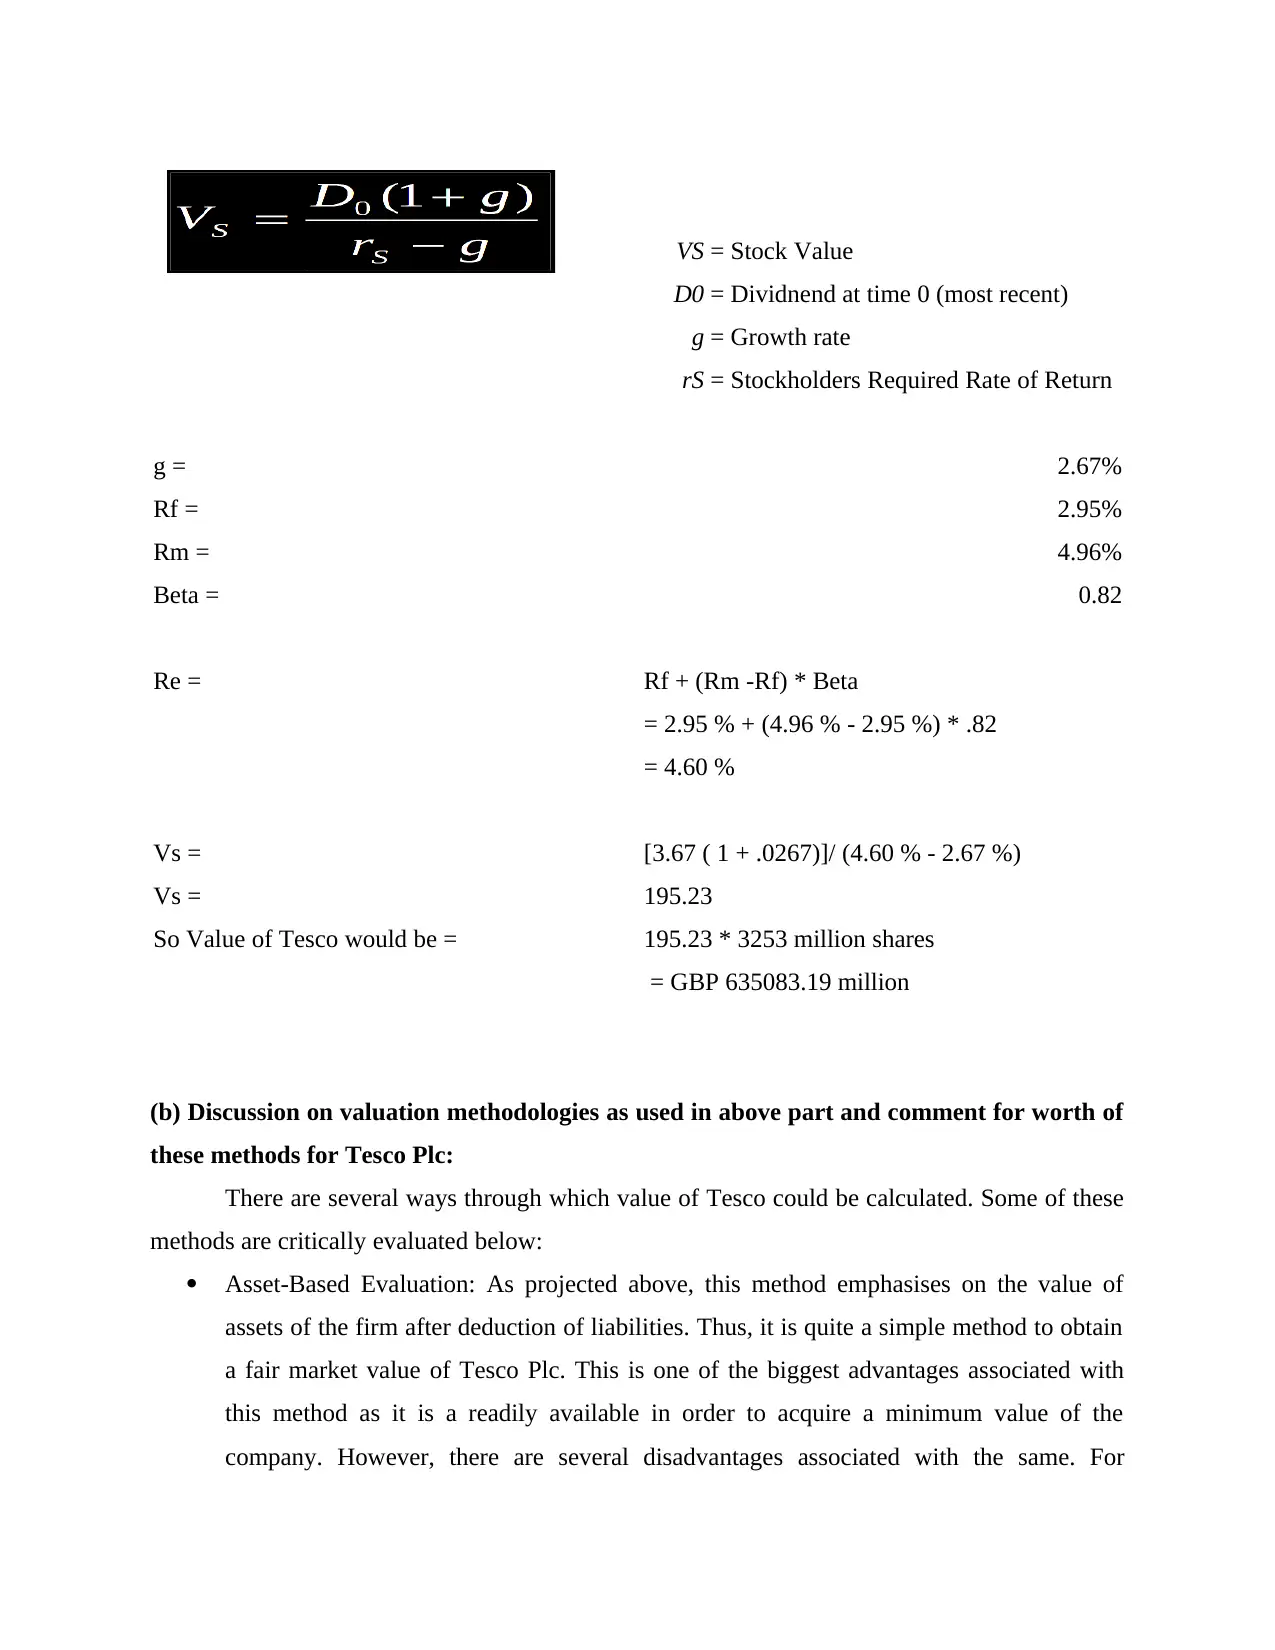
VS = Stock Value
D0 = Dividnend at time 0 (most recent)
g = Growth rate
rS = Stockholders Required Rate of Return
g = 2.67%
Rf = 2.95%
Rm = 4.96%
Beta = 0.82
Re = Rf + (Rm -Rf) * Beta
= 2.95 % + (4.96 % - 2.95 %) * .82
= 4.60 %
Vs = [3.67 ( 1 + .0267)]/ (4.60 % - 2.67 %)
Vs = 195.23
So Value of Tesco would be = 195.23 * 3253 million shares
= GBP 635083.19 million
(b) Discussion on valuation methodologies as used in above part and comment for worth of
these methods for Tesco Plc:
There are several ways through which value of Tesco could be calculated. Some of these
methods are critically evaluated below:
Asset-Based Evaluation: As projected above, this method emphasises on the value of
assets of the firm after deduction of liabilities. Thus, it is quite a simple method to obtain
a fair market value of Tesco Plc. This is one of the biggest advantages associated with
this method as it is a readily available in order to acquire a minimum value of the
company. However, there are several disadvantages associated with the same. For
Paraphrase This Document
Need a fresh take? Get an instant paraphrase of this document with our AI Paraphraser
instance, it ignores valuation of intangible assets like intellectual property. Moreover,
premature valuation might be performed due to depreciation (Gitman, Juchau and
Flanagan, 2015).
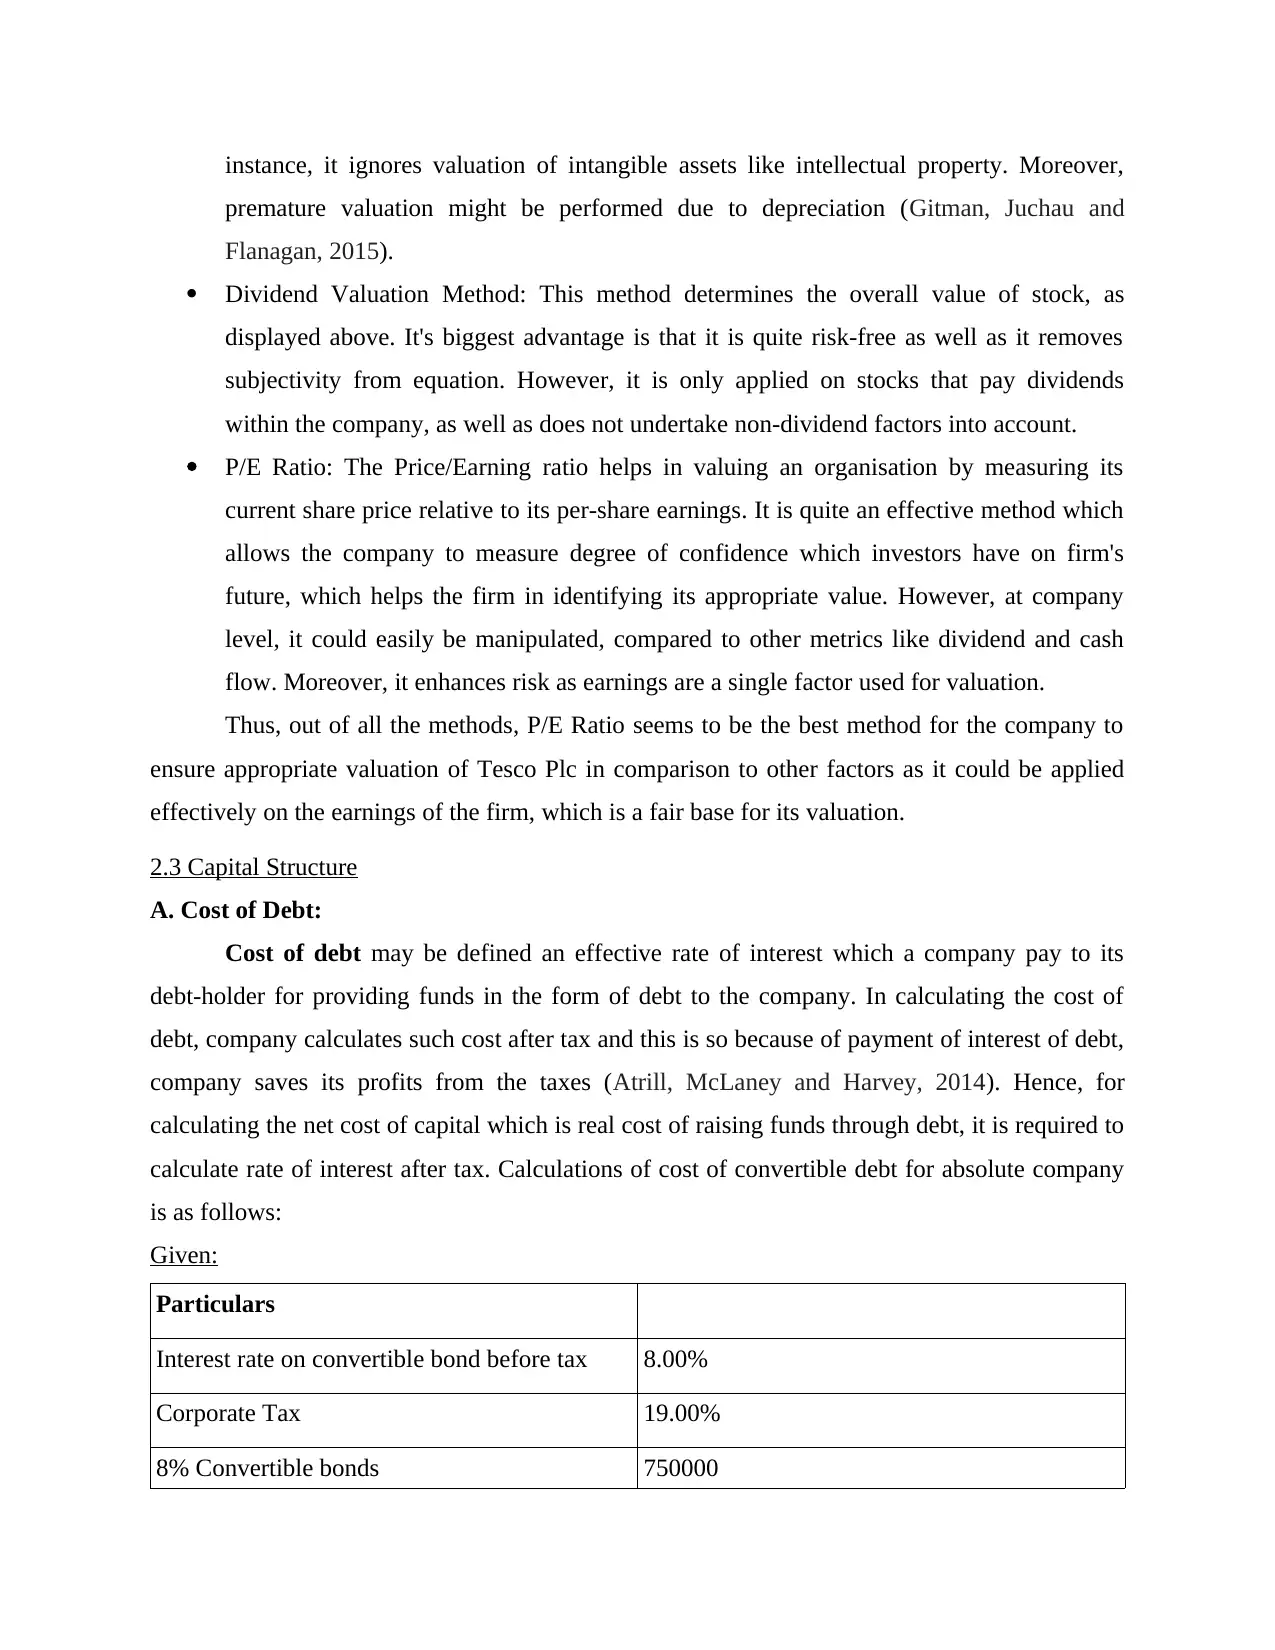
Dividend Valuation Method: This method determines the overall value of stock, as
displayed above. It's biggest advantage is that it is quite risk-free as well as it removes
subjectivity from equation. However, it is only applied on stocks that pay dividends
within the company, as well as does not undertake non-dividend factors into account.
P/E Ratio: The Price/Earning ratio helps in valuing an organisation by measuring its
current share price relative to its per-share earnings. It is quite an effective method which
allows the company to measure degree of confidence which investors have on firm's
future, which helps the firm in identifying its appropriate value. However, at company
level, it could easily be manipulated, compared to other metrics like dividend and cash
flow. Moreover, it enhances risk as earnings are a single factor used for valuation.
Thus, out of all the methods, P/E Ratio seems to be the best method for the company to
ensure appropriate valuation of Tesco Plc in comparison to other factors as it could be applied
effectively on the earnings of the firm, which is a fair base for its valuation.
2.3 Capital Structure
A. Cost of Debt:
Cost of debt may be defined an effective rate of interest which a company pay to its
debt-holder for providing funds in the form of debt to the company. In calculating the cost of
debt, company calculates such cost after tax and this is so because of payment of interest of debt,
company saves its profits from the taxes (Atrill, McLaney and Harvey, 2014). Hence, for
calculating the net cost of capital which is real cost of raising funds through debt, it is required to
calculate rate of interest after tax. Calculations of cost of convertible debt for absolute company
is as follows:
Given:
Particulars
Interest rate on convertible bond before tax 8.00%
Corporate Tax 19.00%
8% Convertible bonds 750000
premature valuation might be performed due to depreciation (Gitman, Juchau and
Flanagan, 2015).
Dividend Valuation Method: This method determines the overall value of stock, as
displayed above. It's biggest advantage is that it is quite risk-free as well as it removes
subjectivity from equation. However, it is only applied on stocks that pay dividends
within the company, as well as does not undertake non-dividend factors into account.
P/E Ratio: The Price/Earning ratio helps in valuing an organisation by measuring its
current share price relative to its per-share earnings. It is quite an effective method which
allows the company to measure degree of confidence which investors have on firm's
future, which helps the firm in identifying its appropriate value. However, at company
level, it could easily be manipulated, compared to other metrics like dividend and cash
flow. Moreover, it enhances risk as earnings are a single factor used for valuation.
Thus, out of all the methods, P/E Ratio seems to be the best method for the company to
ensure appropriate valuation of Tesco Plc in comparison to other factors as it could be applied
effectively on the earnings of the firm, which is a fair base for its valuation.
2.3 Capital Structure
A. Cost of Debt:
Cost of debt may be defined an effective rate of interest which a company pay to its
debt-holder for providing funds in the form of debt to the company. In calculating the cost of
debt, company calculates such cost after tax and this is so because of payment of interest of debt,
company saves its profits from the taxes (Atrill, McLaney and Harvey, 2014). Hence, for
calculating the net cost of capital which is real cost of raising funds through debt, it is required to
calculate rate of interest after tax. Calculations of cost of convertible debt for absolute company
is as follows:
Given:
Particulars
Interest rate on convertible bond before tax 8.00%
Corporate Tax 19.00%
8% Convertible bonds 750000
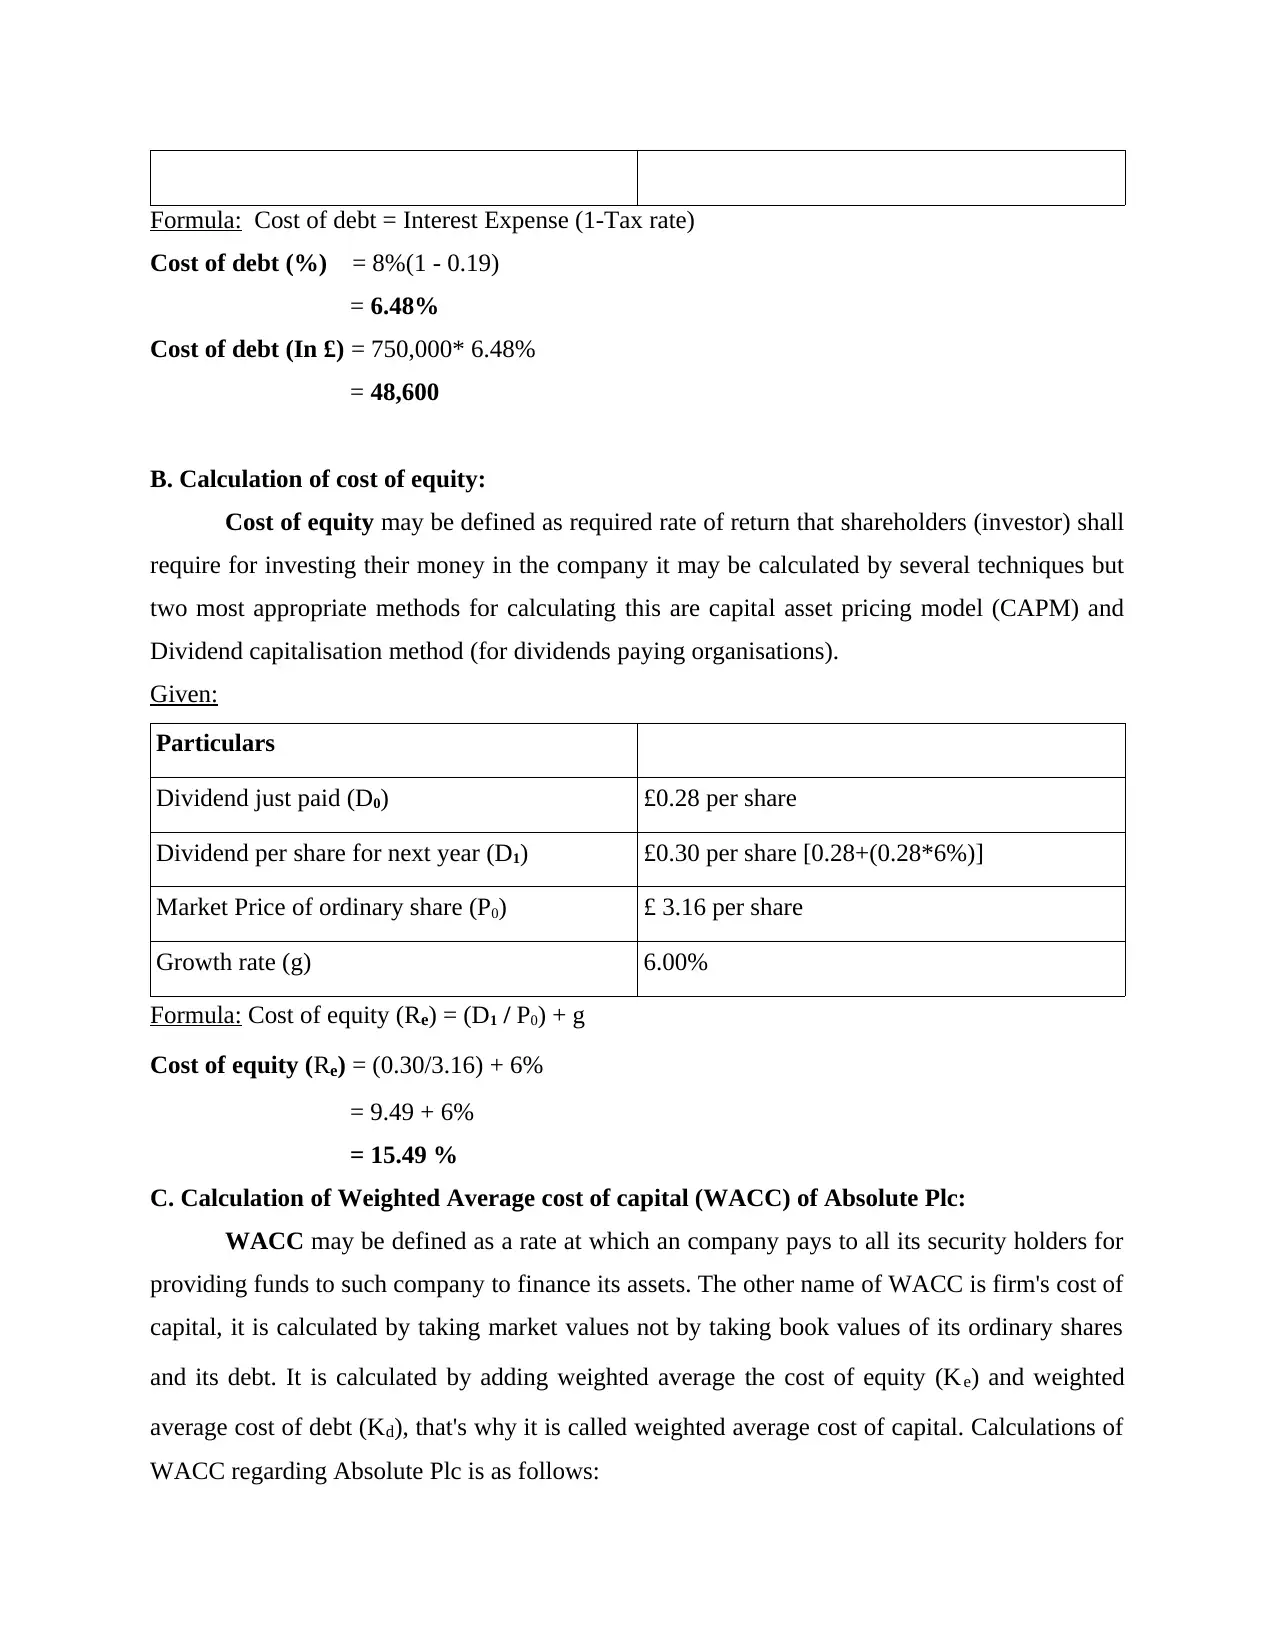
Formula: Cost of debt = Interest Expense (1-Tax rate)
Cost of debt (%) = 8%(1 - 0.19)
= 6.48%
Cost of debt (In £) = 750,000* 6.48%
= 48,600
B. Calculation of cost of equity:
Cost of equity may be defined as required rate of return that shareholders (investor) shall
require for investing their money in the company it may be calculated by several techniques but
two most appropriate methods for calculating this are capital asset pricing model (CAPM) and
Dividend capitalisation method (for dividends paying organisations).
Given:
Particulars
Dividend just paid (D0) £0.28 per share
Dividend per share for next year (D1) £0.30 per share [0.28+(0.28*6%)]
Market Price of ordinary share (P0) £ 3.16 per share
Growth rate (g) 6.00%
Formula: Cost of equity (Re) = (D1 / P0) + g
Cost of equity (Re) = (0.30/3.16) + 6%
= 9.49 + 6%
= 15.49 %
C. Calculation of Weighted Average cost of capital (WACC) of Absolute Plc:
WACC may be defined as a rate at which an company pays to all its security holders for
providing funds to such company to finance its assets. The other name of WACC is firm's cost of
capital, it is calculated by taking market values not by taking book values of its ordinary shares
and its debt. It is calculated by adding weighted average the cost of equity (Ke) and weighted
average cost of debt (Kd), that's why it is called weighted average cost of capital. Calculations of
WACC regarding Absolute Plc is as follows:
⊘ This is a preview!⊘
Do you want full access?
Subscribe today to unlock all pages.
Trusted by 1+ million students worldwide
1 out of 13
Related Documents


Your All-in-One AI-Powered Toolkit for Academic Success.
+13062052269
info@desklib.com
Available 24*7 on WhatsApp / Email
![[object Object]](/_next/static/media/star-bottom.7253800d.svg)
Unlock your academic potential
Copyright © 2020–2026 A2Z Services. All Rights Reserved. Developed and managed by ZUCOL.