Financial Analysis Report: Evaluating R Plc Against S Plc, 2020
VerifiedAdded on 2023/06/16
|8
|1395
|96
Report
AI Summary
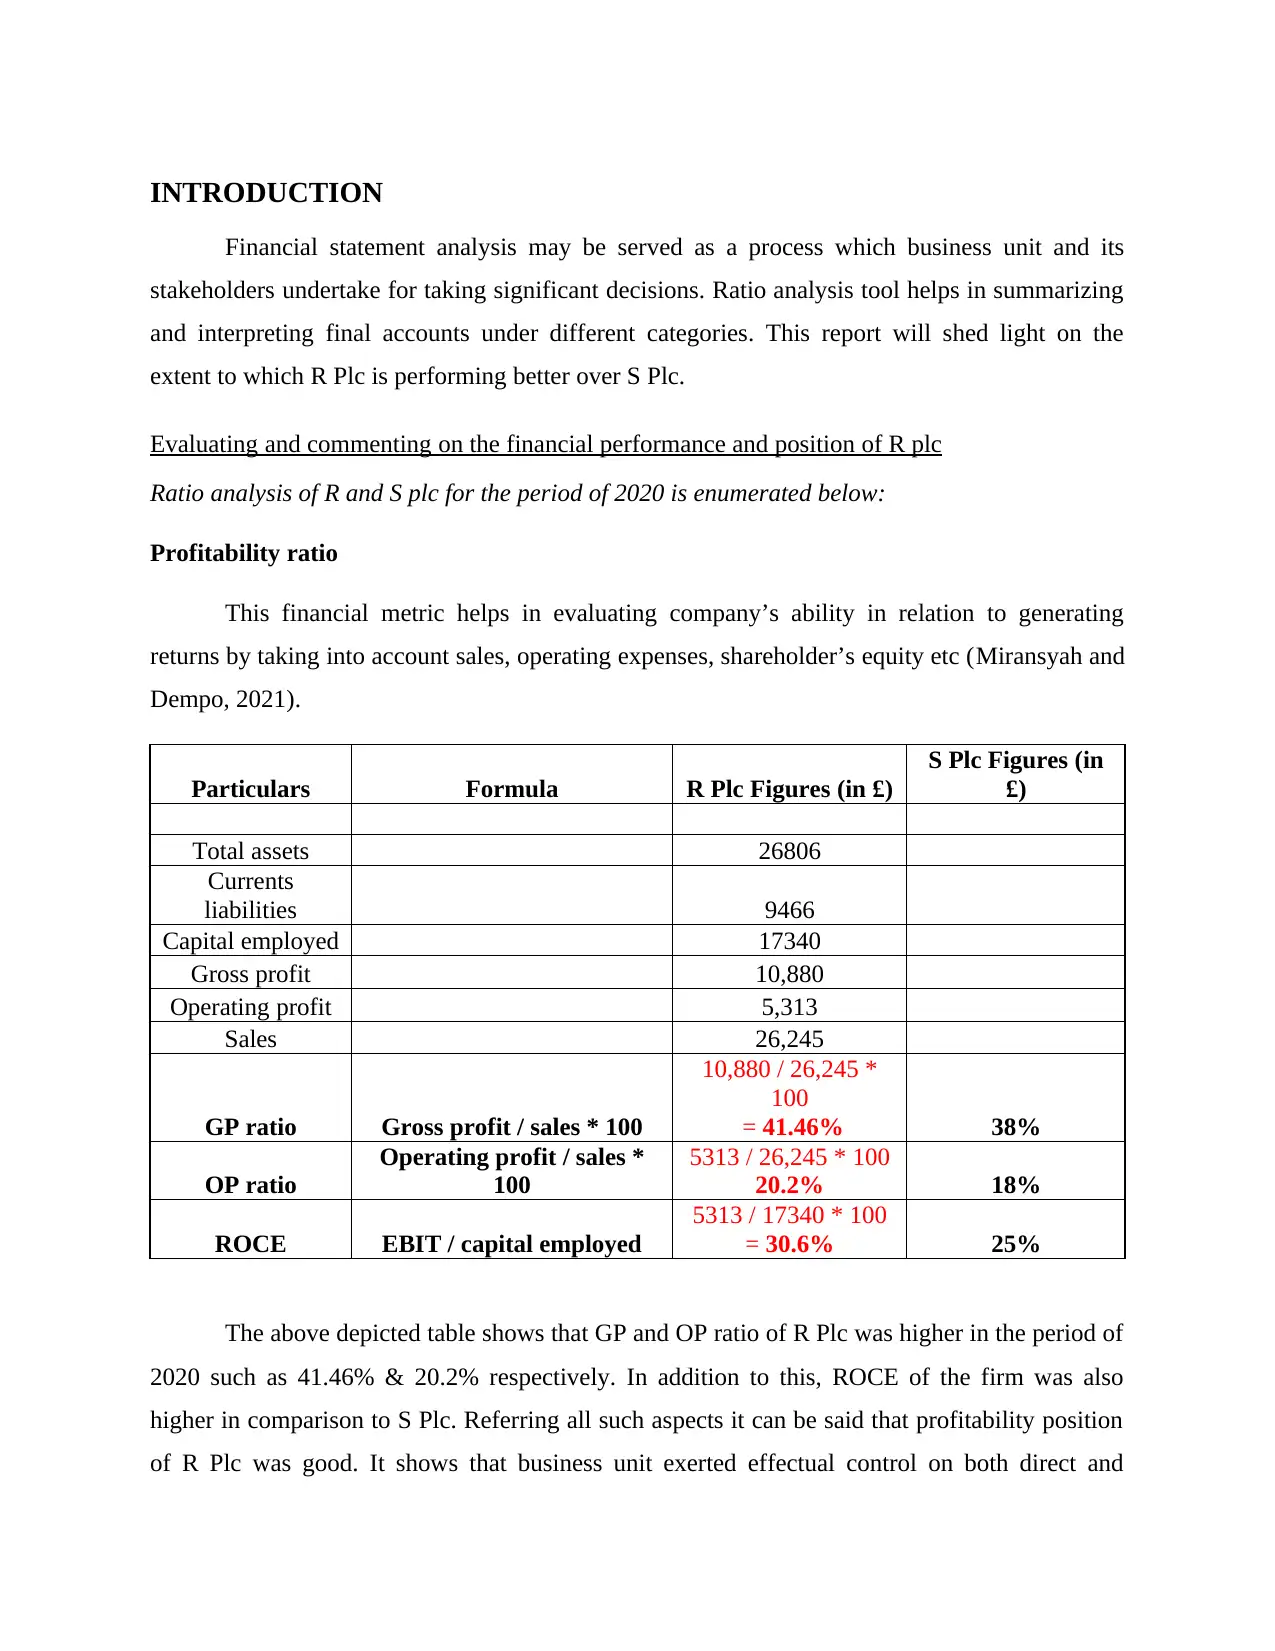
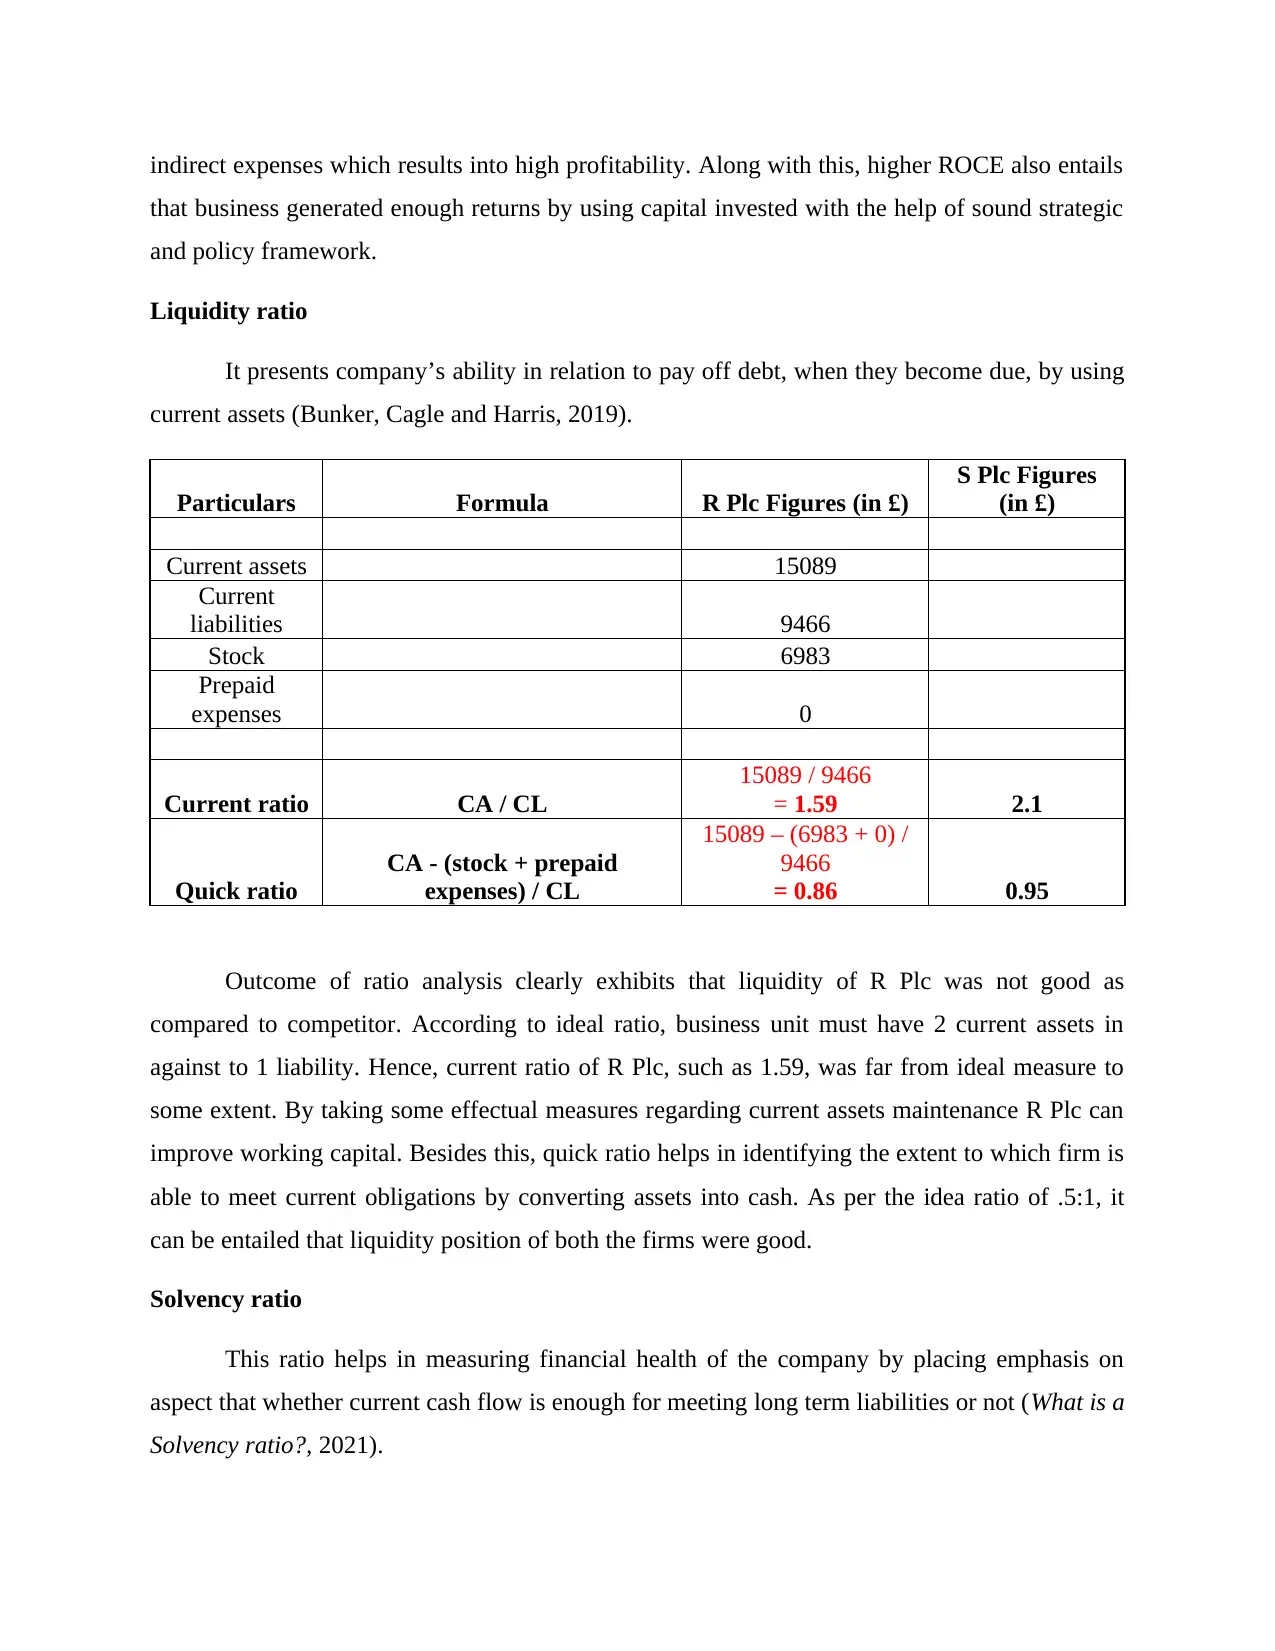
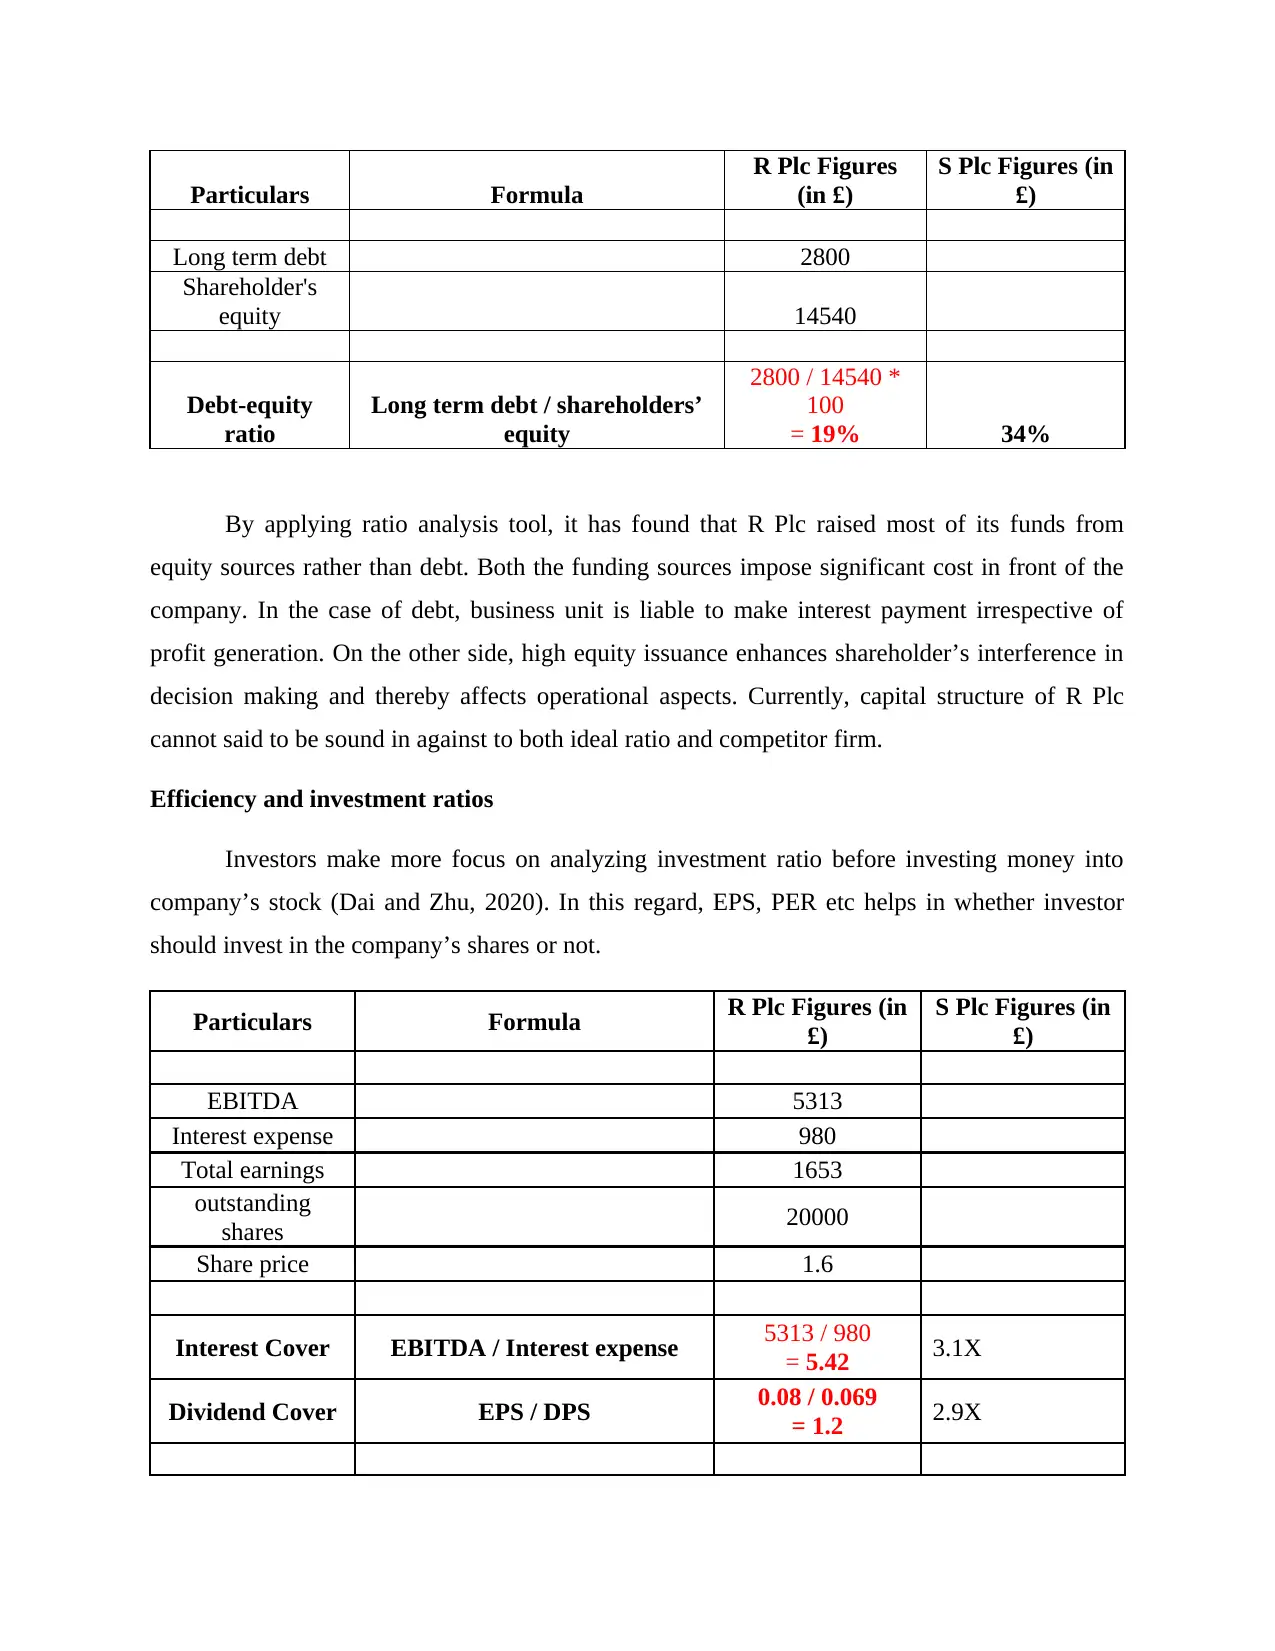
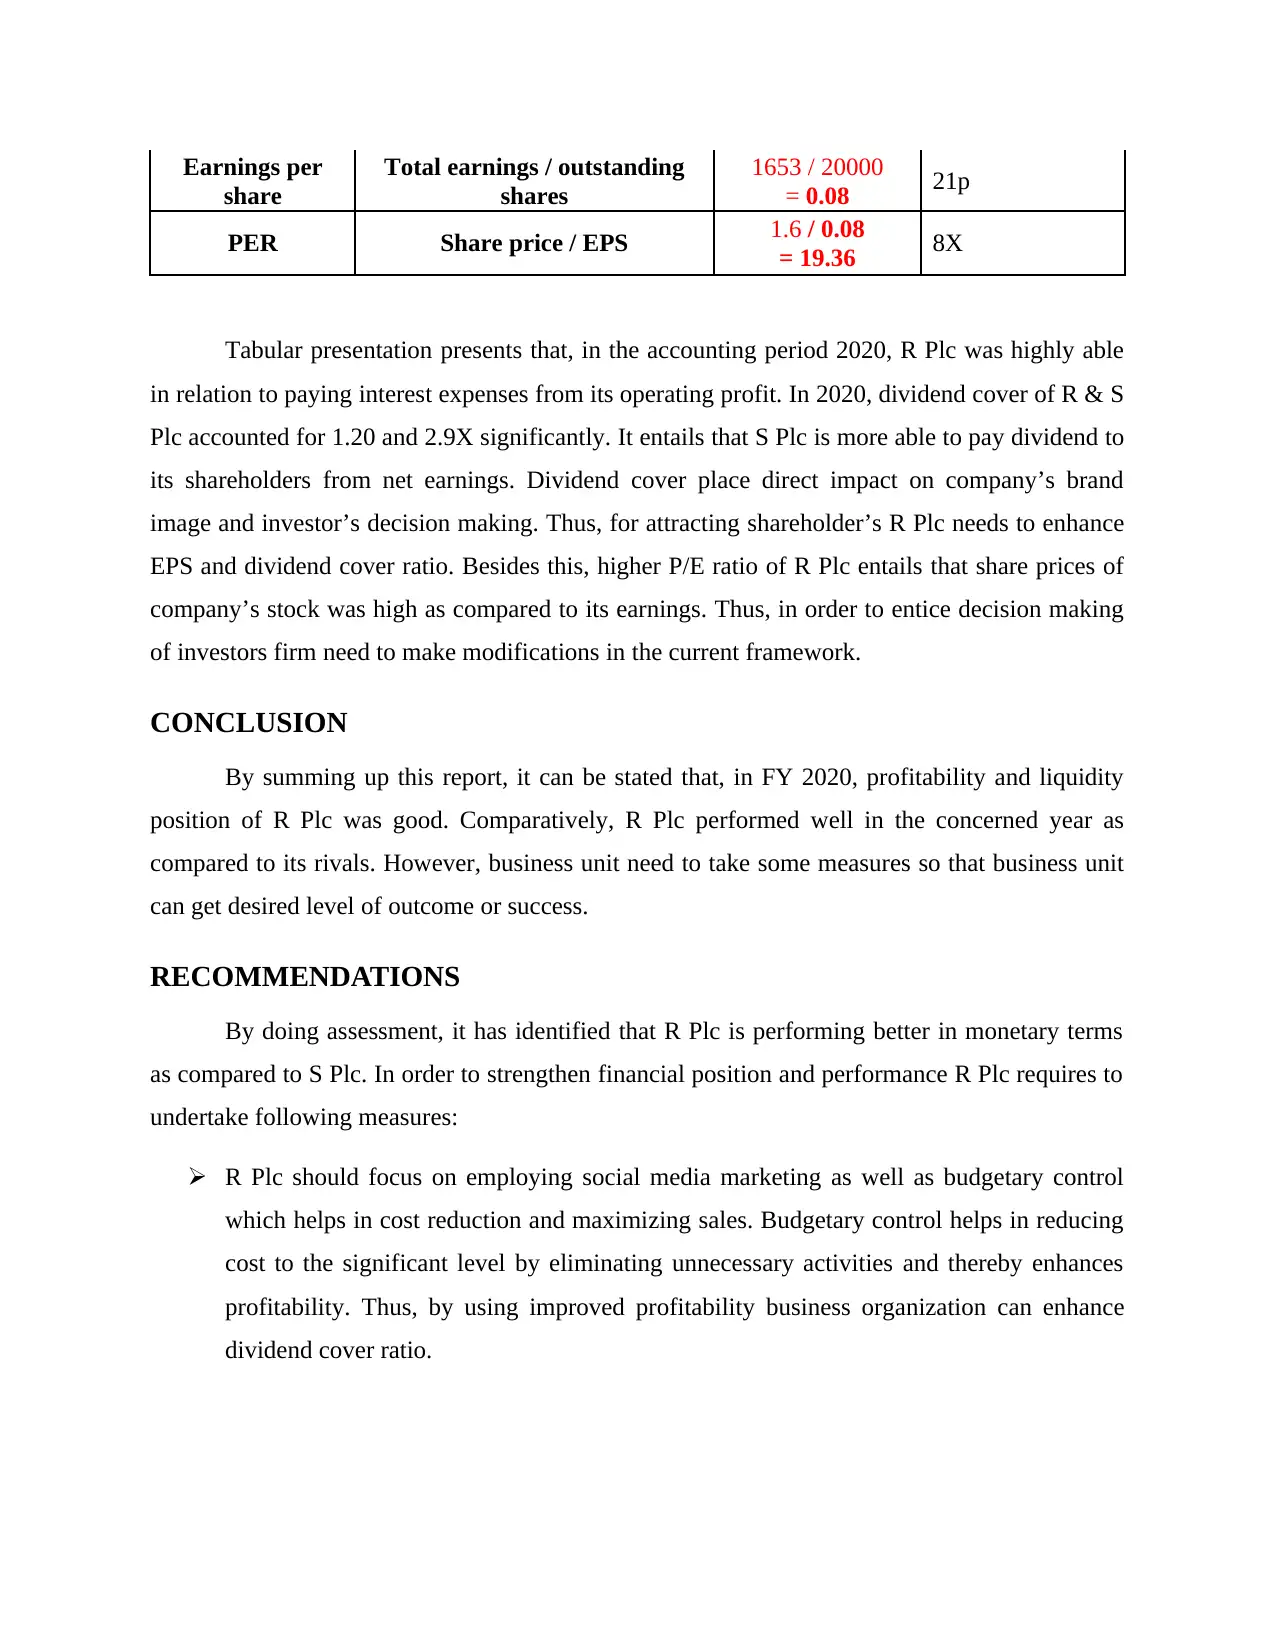
This report provides a comprehensive financial analysis of R Plc compared to S Plc for the year 2020, utilizing ratio analysis to evaluate their performance. The analysis covers profitability, liquidity, solvency, and investment ratios, revealing that R Plc generally exhibits stronger profitability and good liquidity. However, its solvency and capital structure require improvement. The report concludes with recommendations for R Plc, including focusing on social media marketing, budgetary control for cost reduction, maintaining optimal current asset levels to improve liquidity, and adjusting its capital structure by balancing debt and equity financing to strengthen its financial position and attract investors. Desklib provides this solved assignment and many other resources for students.

1 out of 8
Related Documents


Your All-in-One AI-Powered Toolkit for Academic Success.
+13062052269
info@desklib.com
Available 24*7 on WhatsApp / Email
![[object Object]](/_next/static/media/star-bottom.7253800d.svg)
Copyright © 2020–2026 A2Z Services. All Rights Reserved. Developed and managed by ZUCOL.