Financial Plan: Detailed Analysis of a Digital Marketing Startup
VerifiedAdded on 2023/03/31
|13
|2414
|66
Project
AI Summary
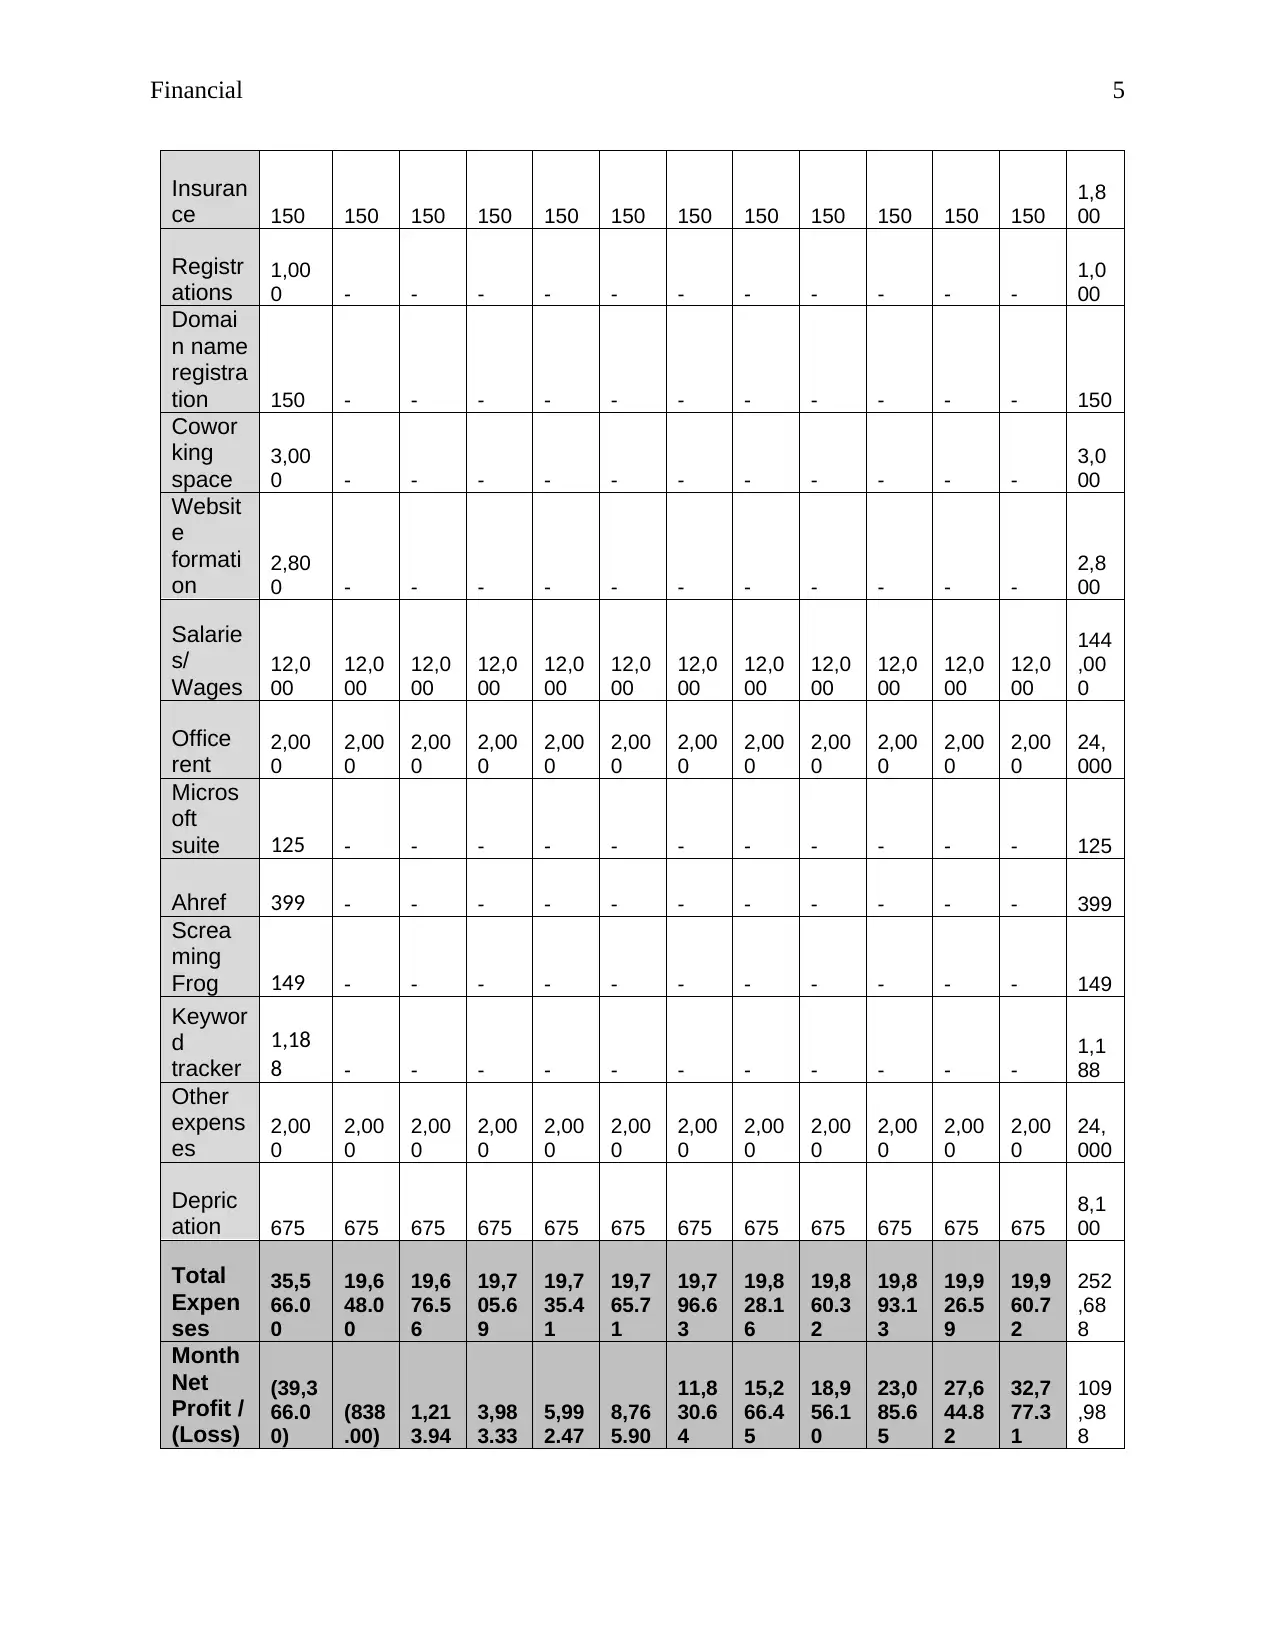
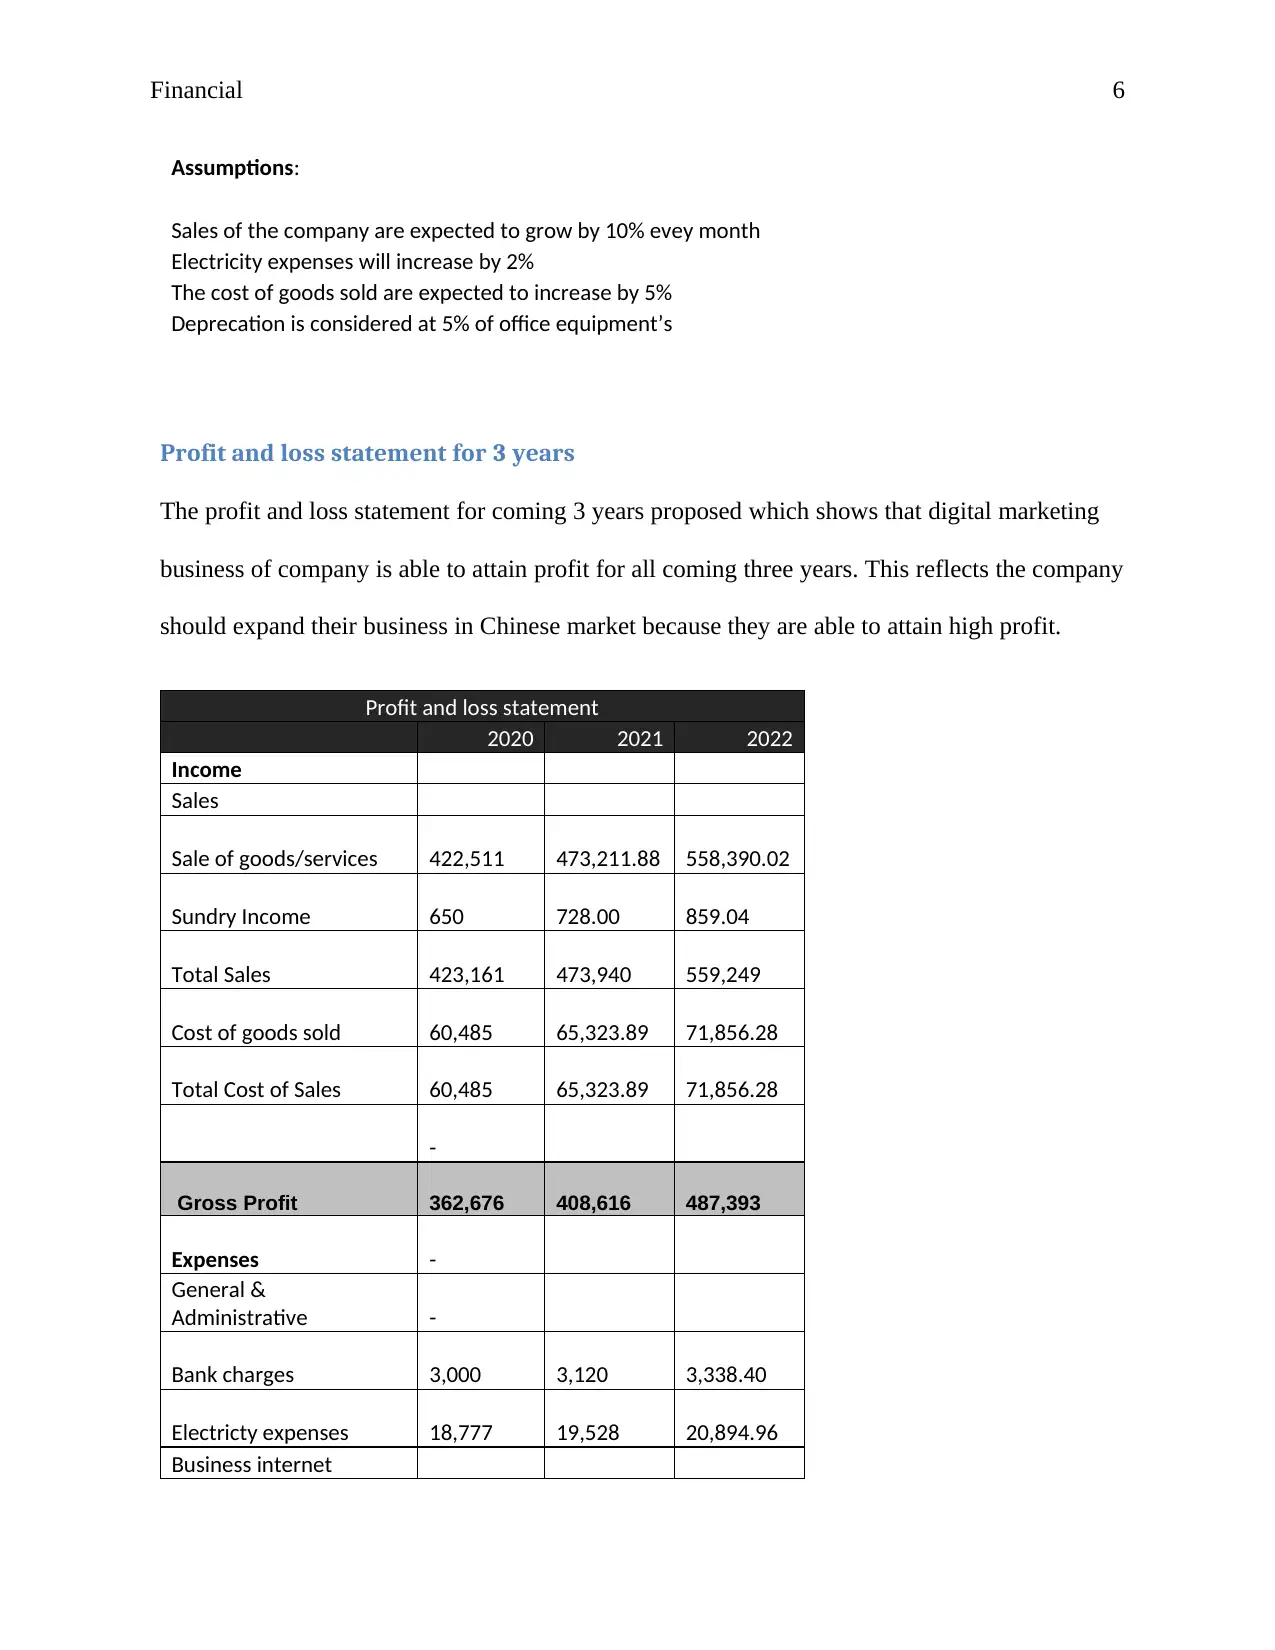
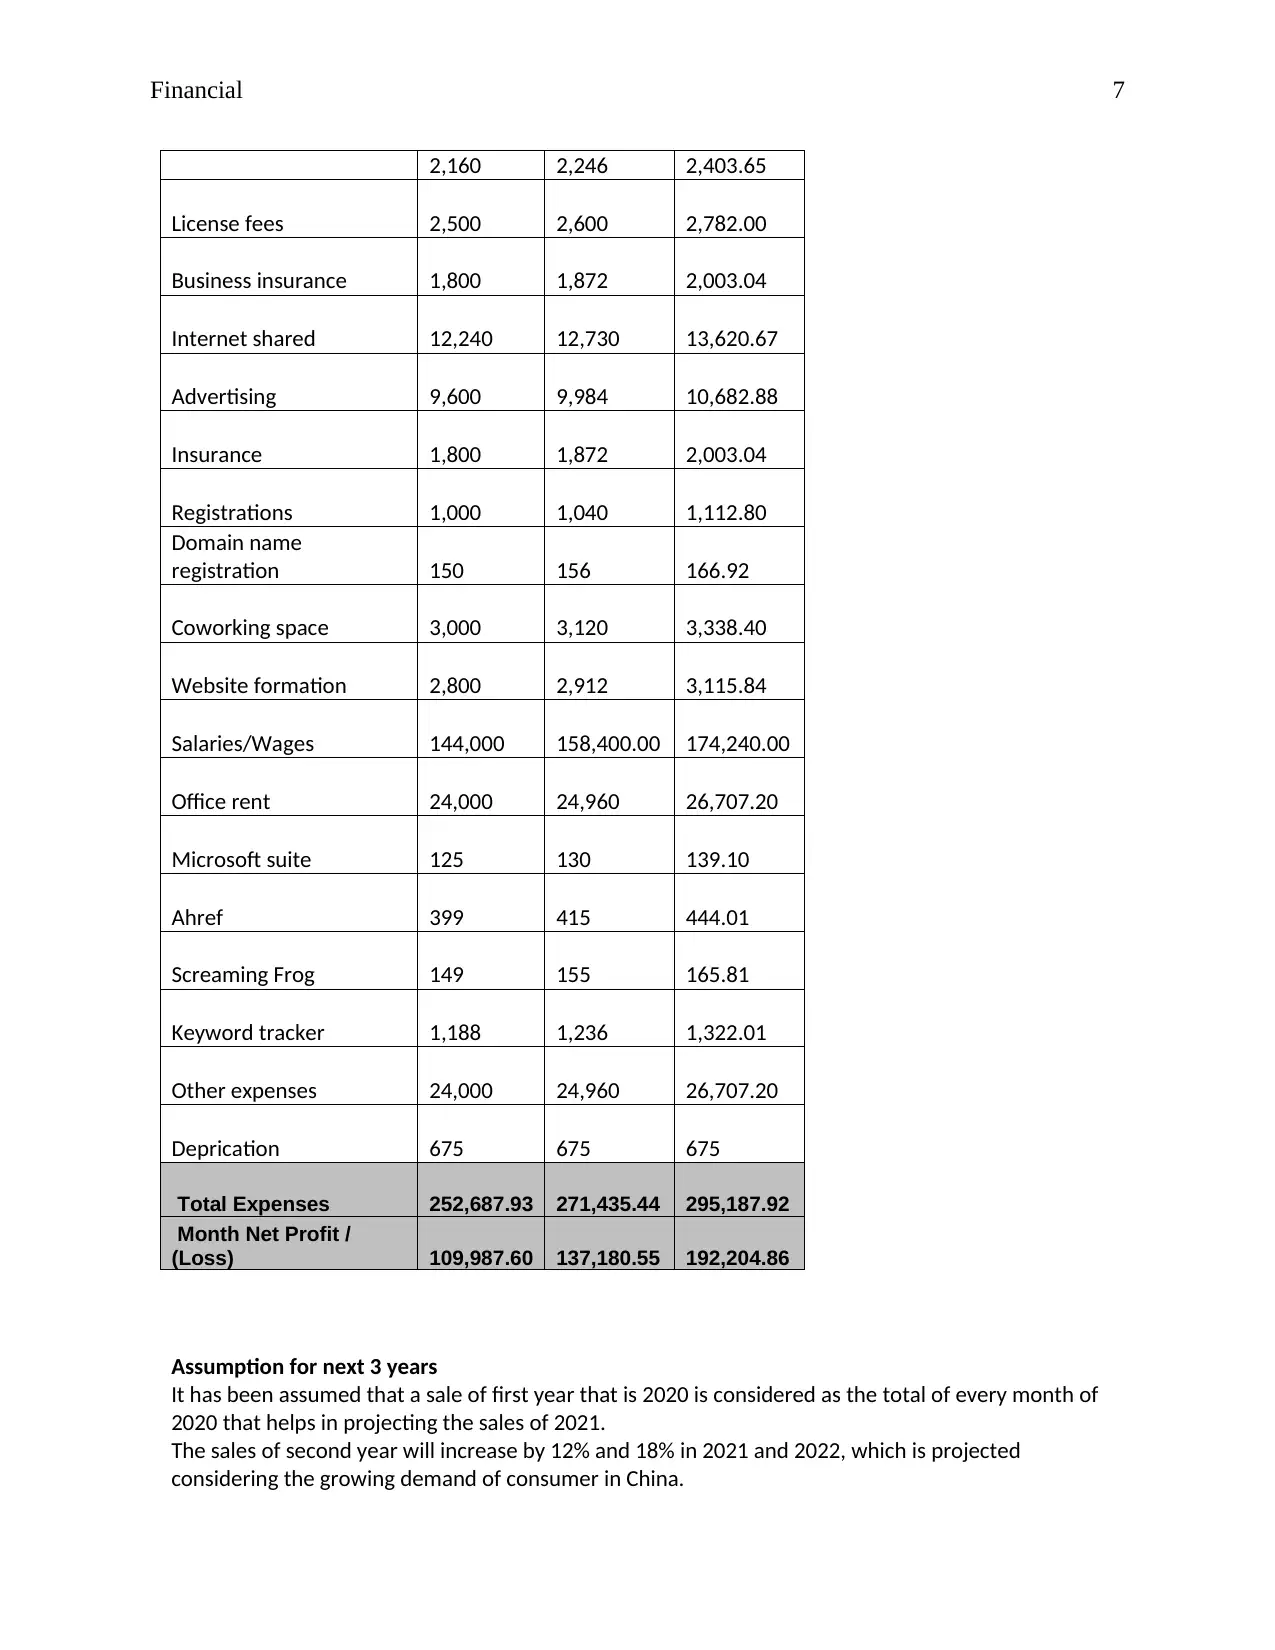
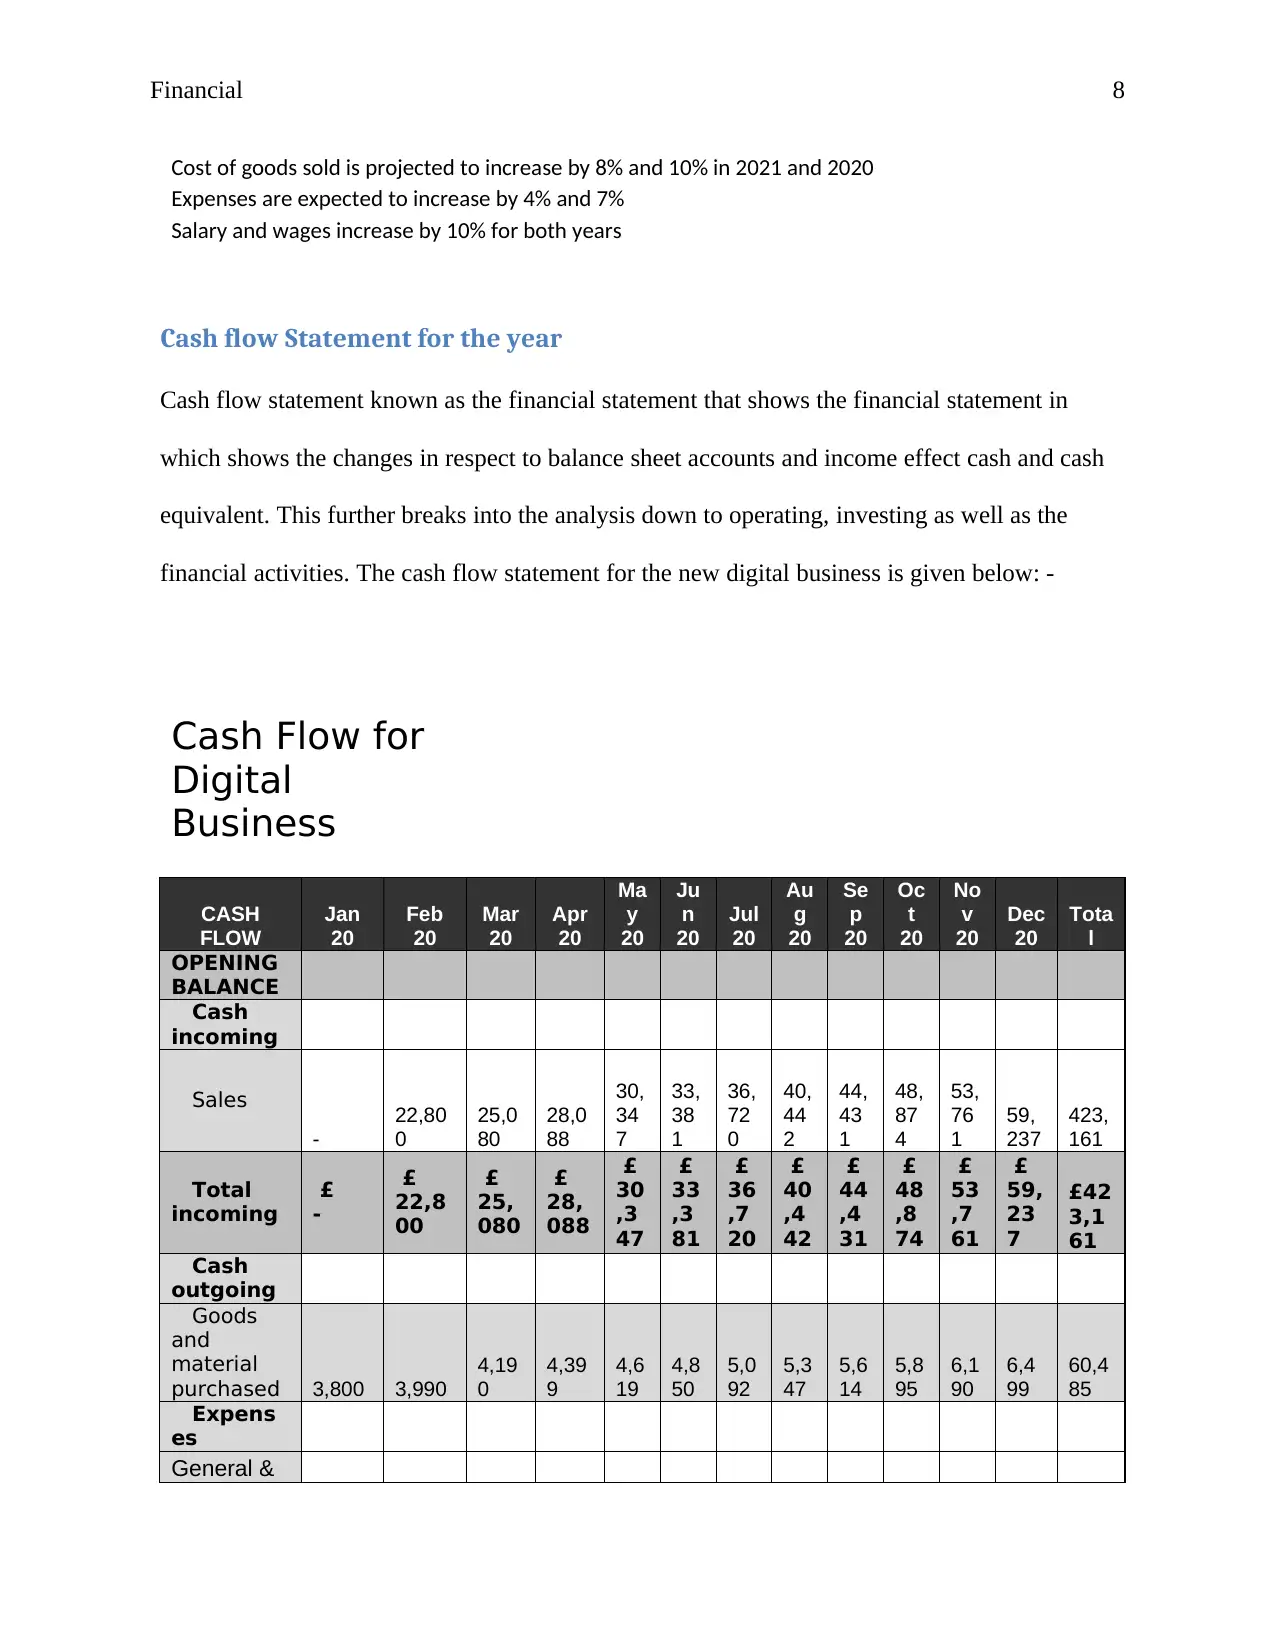
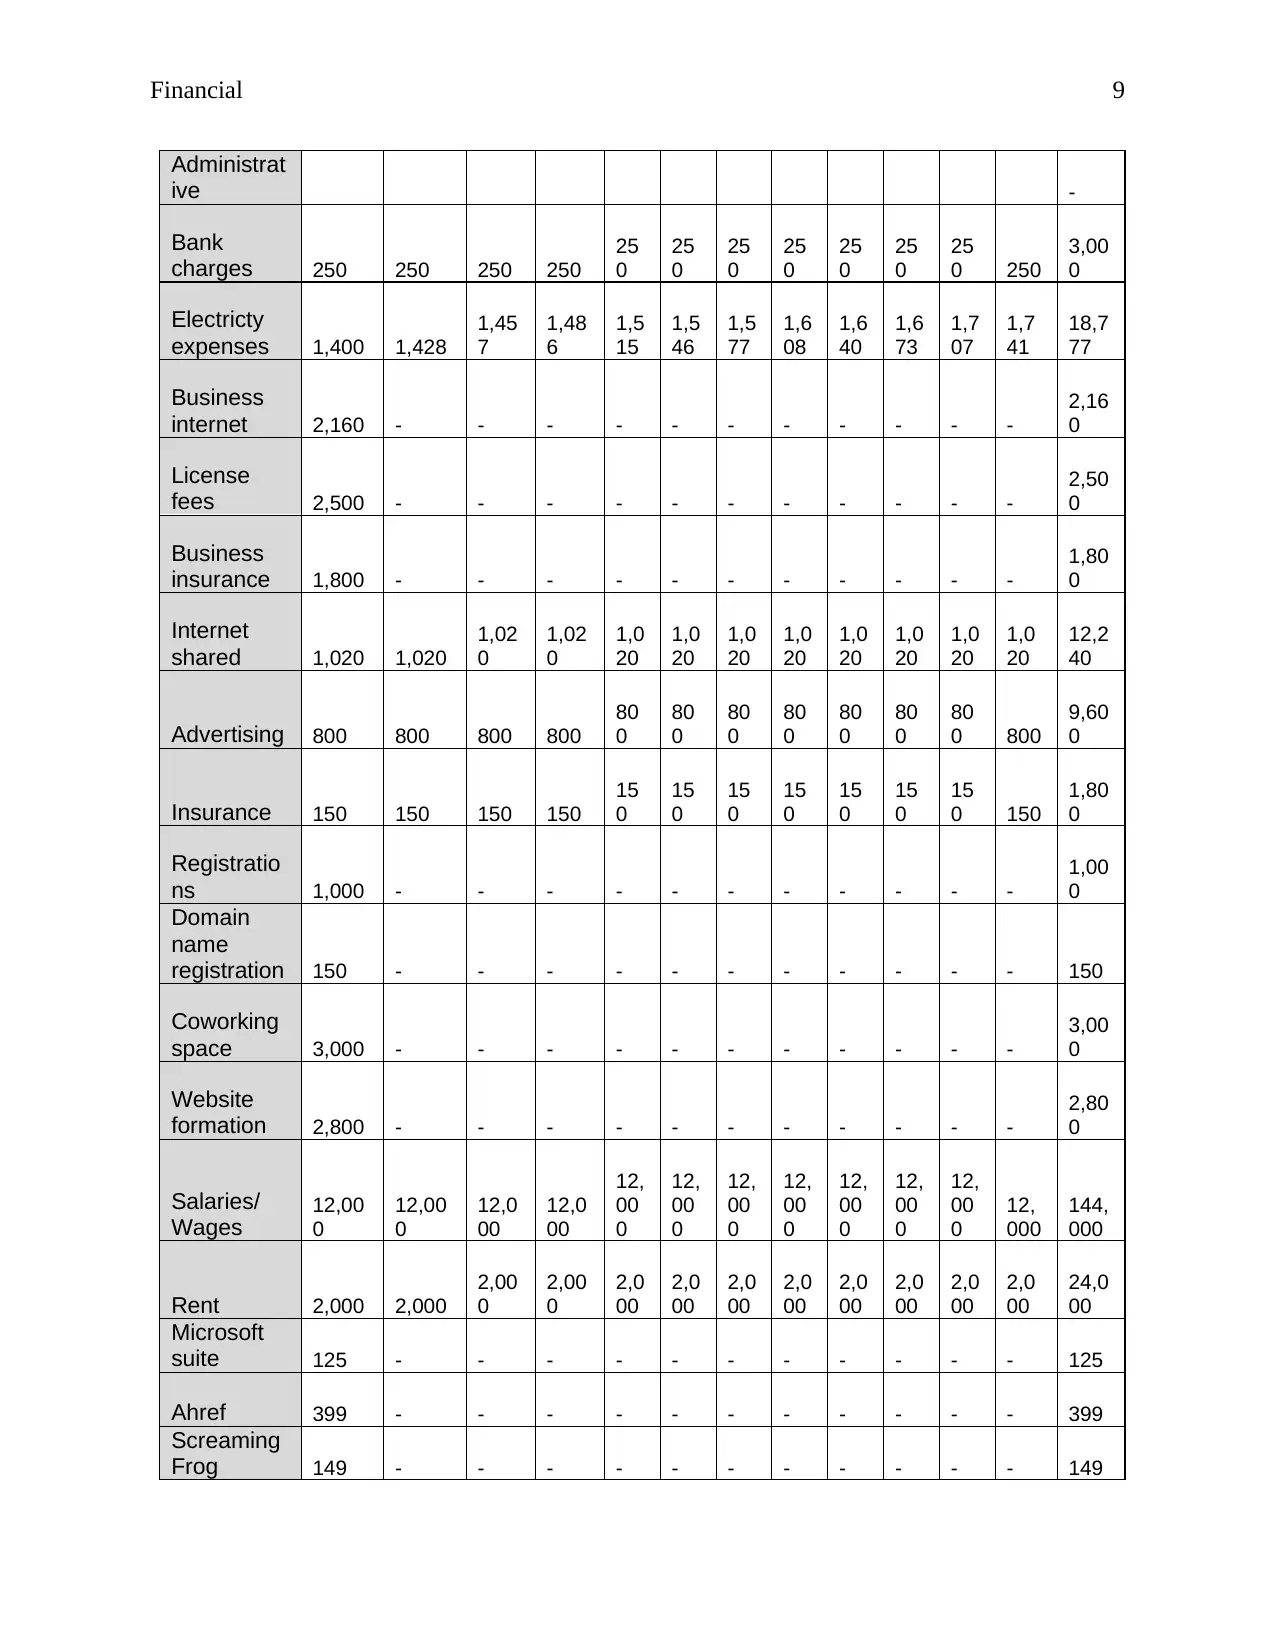
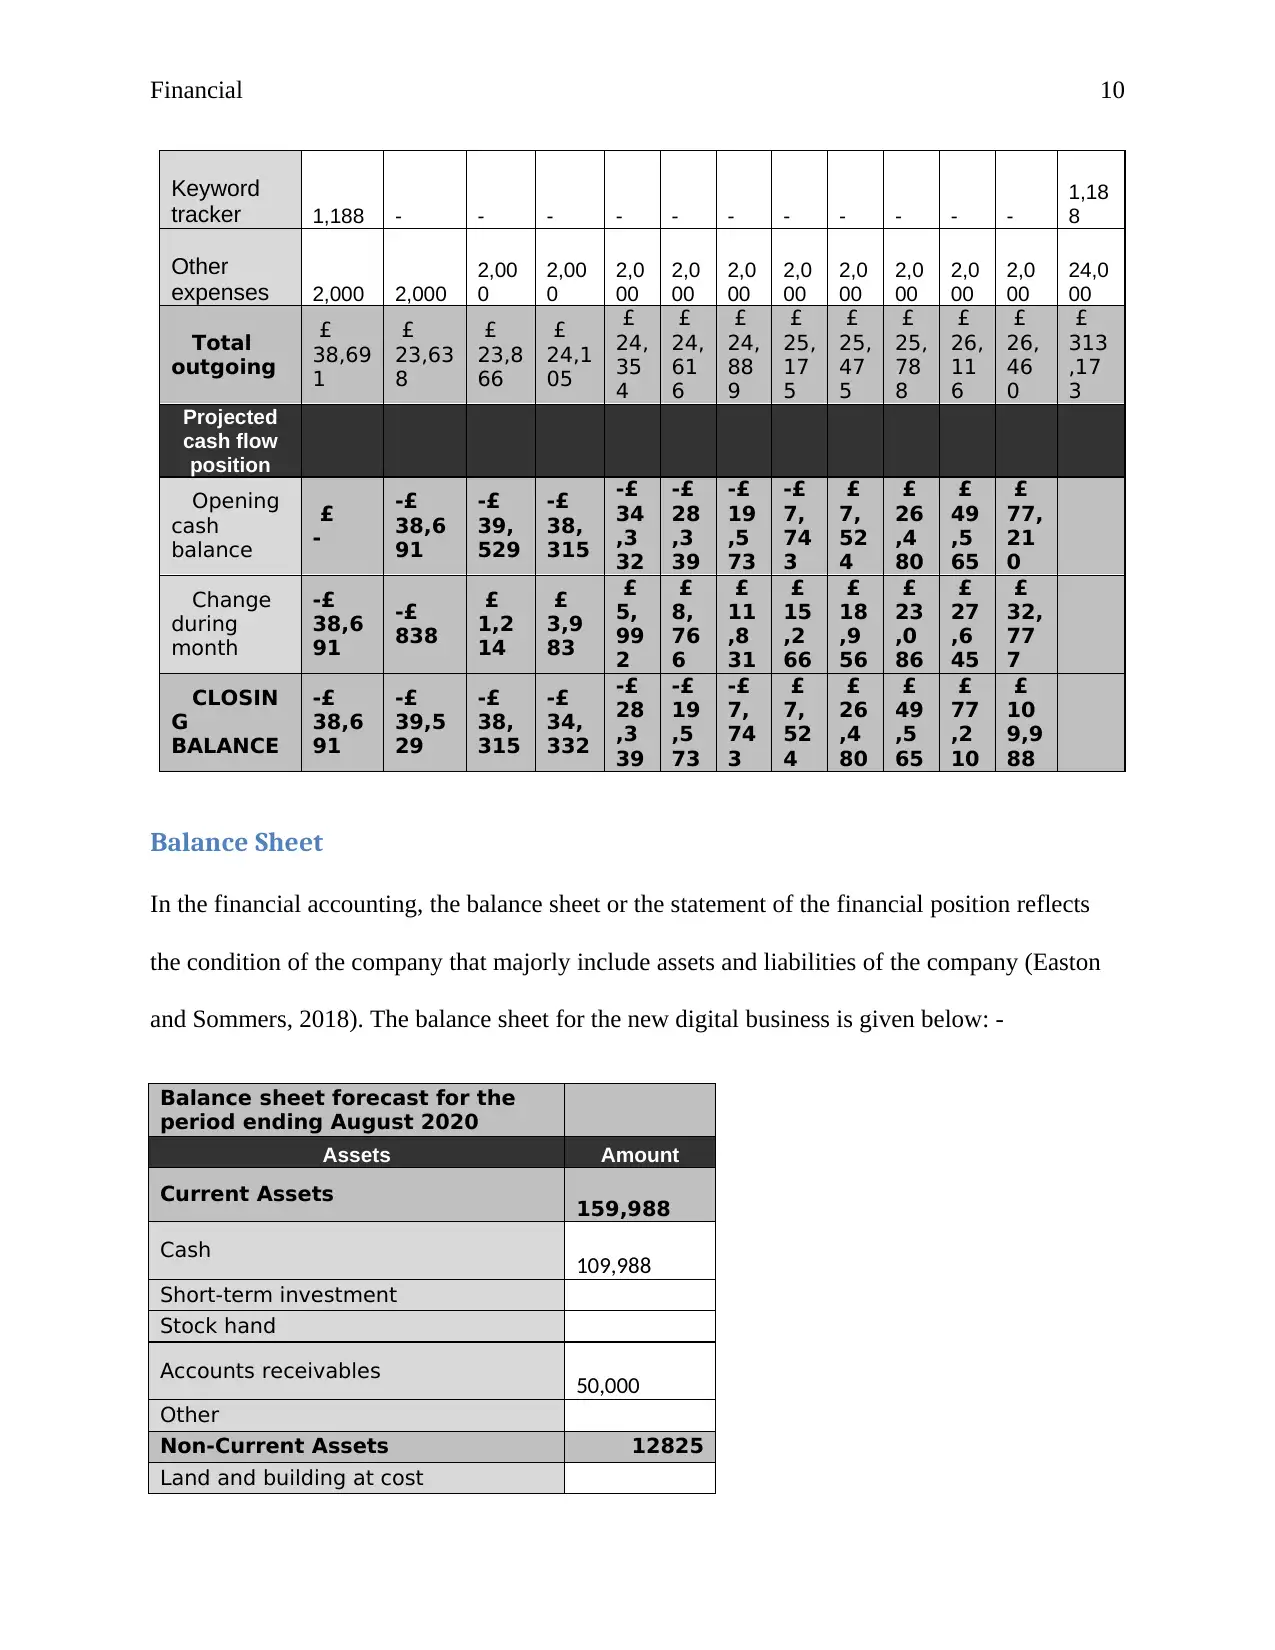
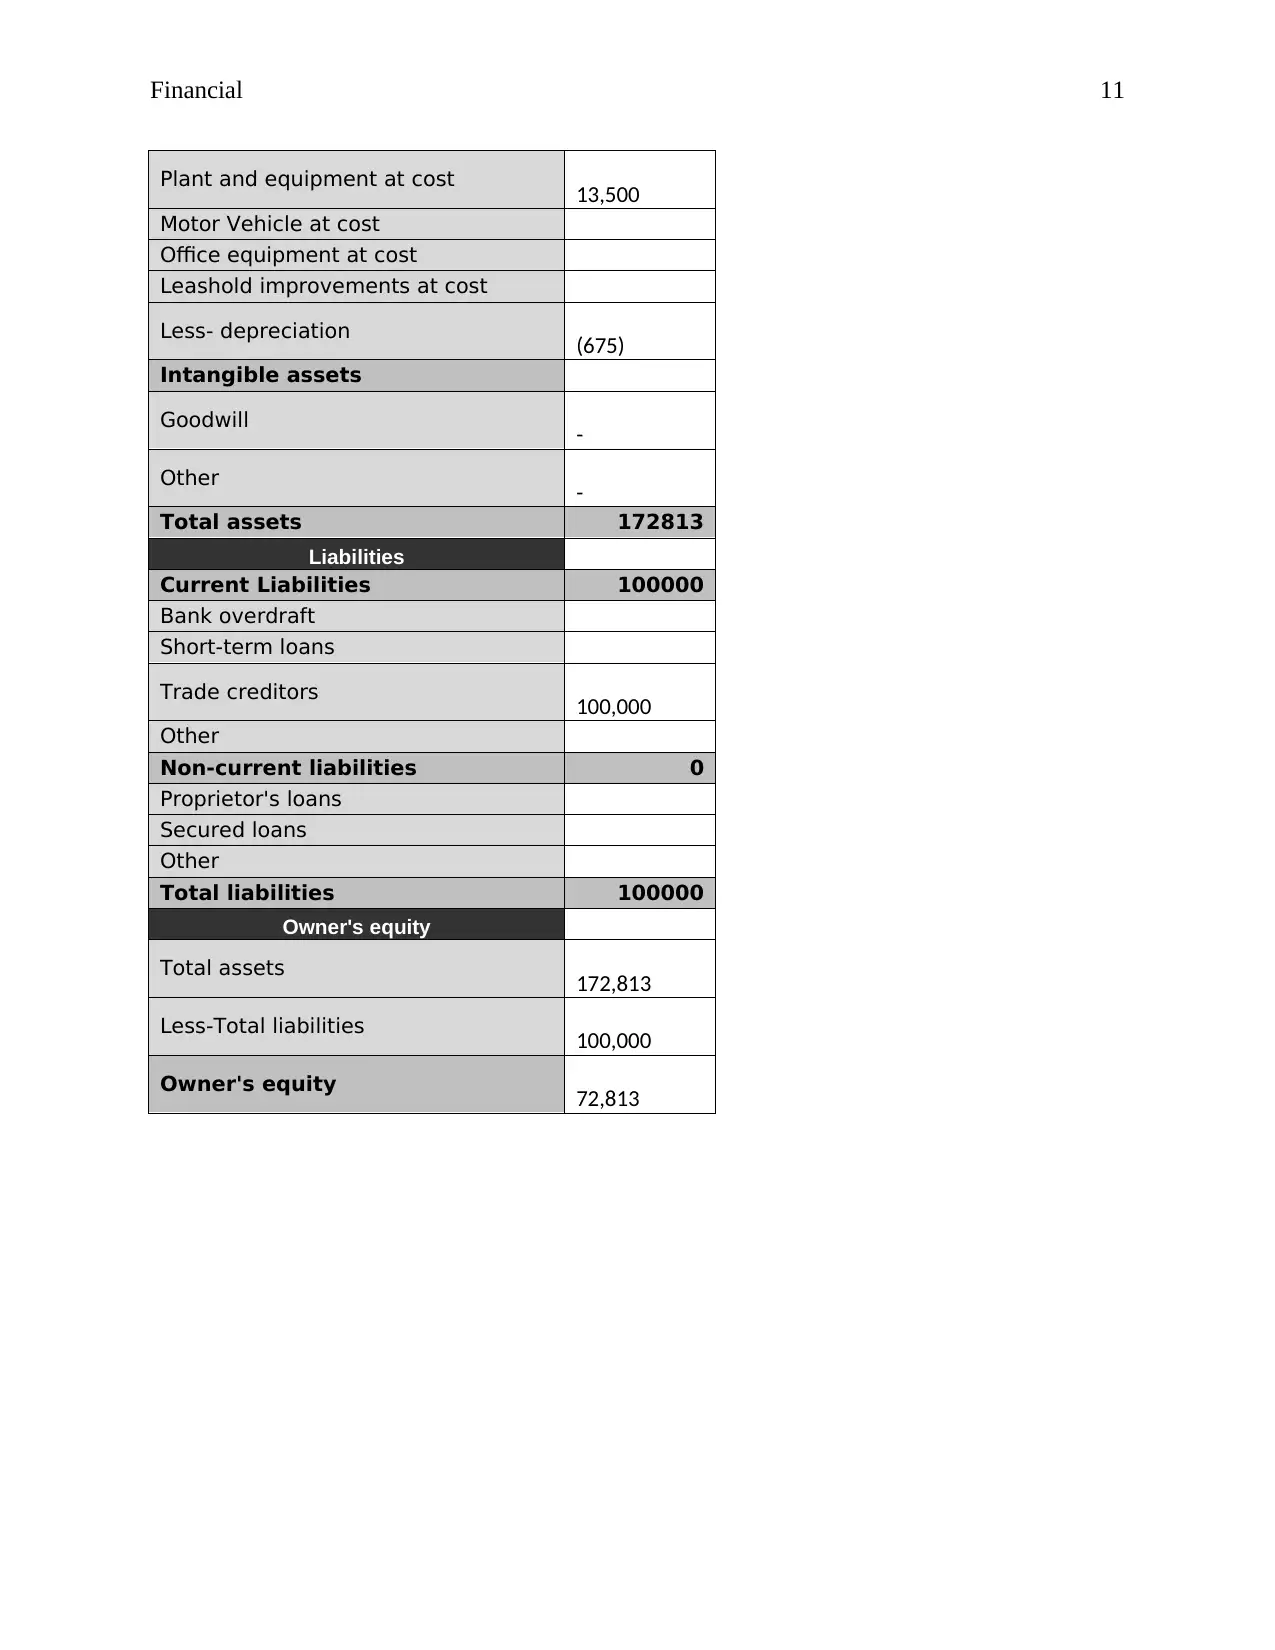
This financial plan outlines the key financial aspects of a digital marketing business, covering startup costs, revenue projections, and financial statements. The plan begins with an overview of the business and its objectives, followed by a detailed breakdown of startup costs, including office expenses, equipment, and initial operating expenses. A profit and loss statement is provided, projecting revenue, expenses, and net profit over a period of months, along with assumptions. Additionally, a cash flow statement is presented, detailing the movement of cash in and out of the business. Finally, the plan includes a balance sheet, showcasing the company's assets, liabilities, and equity. The projections cover a three-year period, with assumptions about sales growth, cost of goods sold, and expenses. The financial plan provides a comprehensive overview of the financial feasibility and potential profitability of the digital marketing business.

1 out of 13
Related Documents


Your All-in-One AI-Powered Toolkit for Academic Success.
+13062052269
info@desklib.com
Available 24*7 on WhatsApp / Email
![[object Object]](/_next/static/media/star-bottom.7253800d.svg)
Copyright © 2020–2026 A2Z Services. All Rights Reserved. Developed and managed by ZUCOL.