Financial Ratio Analysis of BHP Billiton and Rio Tinto
32 Pages4468 Words343 Views
Added on 2023-05-30
About This Document
This report provides a comparative view of BHP Billiton and Rio Tinto for the financial year ended 2017. Financial ratios have been considered to analyse the financial performance of both companies. The report includes analysis of return on assets, return on ordinary equity, profit margin, current ratio, and inventory turnover.
Financial Ratio Analysis of BHP Billiton and Rio Tinto
Added on 2023-05-30
ShareRelated Documents
Running head: MANAGEMENT ACCOUNTING
Management Accounting
Name of the Student
Name of the University
Authors Note
Course ID
Management Accounting
Name of the Student
Name of the University
Authors Note
Course ID
1MANAGEMENT ACCOUNTING
Table of Contents
Introduction: 3
Company Overview 3
BHP Billiton 3
Rio Tinto: 4
Financial Ratio Analysis: 4
Return on Assets: 4
Return on Ordinary Equity: 6
Profit Margin: 7
Current Ratio: 9
Inventory Turnover: 10
Debt Ratio: 12
Equity Ratio 13
Debt and Equity Financing Structure: 14
BHP Billiton 14
Rio Tinto: 16
Conclusion: 17
References: 18
Appendix: 21
BHP Billiton Financial Statements: 21
Income Statement: 21
3MANAGEMENT ACCOUNTING
Introduction:
Financial accounting is defined as the field in bookkeeping that is associated with the
summary, examination and reporting of the financial transaction relating to the business.
Financial accounting involves preparing the financial statement so that it is available for
public consumption (Henderson et al., 2015). Companies generally makes the use of
standardized guidelines, transactions to record, summarized and present the same in the
financial report or the financial statement particularly the income statement or the balance
sheet. The financial statement is helpful in offering the information that is needed for making
a sound economic decision.
The current business report is based on analysing the financial performance of two
businesses that are listed on the ASX stock exchange. The report would be providing a
comparative view of BHP Billiton and Rio Tinto for the financial year ended 2017. To
analyse the comparative performance of BHP Billiton and Rio Tinto financial ratios has been
considered here so that a detailed understanding of the financial performance for both the
companies is obtained.
Company Overview
BHP Billiton
BHP Billiton is the globally leading Resources Company. The company is involved in
extracting and processing the minerals, oil and gas with greater than 60,000 employees and
contractors that are mainly involved in Australia and Americas (Bhp.com, 2017). BHP
Billiton produces are sold across the world with the company sales and marketing expanding
across the Singapore and Houston, US. BHP Billiton worldwide headquarters is located in
Melbourne, Australia. BHP Billiton functions under the structure of Dual Listed Company
4MANAGEMENT ACCOUNTING
with the two parent companies namely the BHP Billiton Ltd and BHP Billiton Plc operating
as the single economic entity.
BHP Billiton was founded in 1885 in the mining town of Broken Hill in New South
Wales. During the year 2017, BHP is ranked as the world’s largest mining company in
respect of its market capitalization and third largest company of Melbourne in terms of
revenue that almost increased between 2004 and 2012.
Rio Tinto:
Rio Tinto Group is the Anglo-Australian international and one of the world’s largest
company engaged in mining. For over 145 years, Rio Tinto has been ground-breaking to the
production of materials necessary to the progress of humans (Riotinto.com, 2017). The
minerals and metals helps in making the modern life work. Rio Tinto Group is the dual listed
company trading on both the London stock exchange and the Australian stock exchange. The
company has created portfolio and it is constantly optimising which offers the company with
the competitive advantage.
Rio Tinto Group makes investment in the assets to develop the suit of high quality
expandable assets which is positioned for decades of premium production. With more than
47,000 workforces, Rio Tinto Group has the common code of conduct with the identical set
of morals, protection, collaboration, reliability and brilliance. Rio Tinto continues to pioneer
its progress for the better future. The company looks for ways so that it makes its trade robust
by driving more production and performance from the coalmine to market.
Financial Ratio Analysis:
Return on Assets:
The return on assets ratio is generally called as the return on total assets that are
profitability to measure the net profits that is produced by the total assets through the period
5MANAGEMENT ACCOUNTING
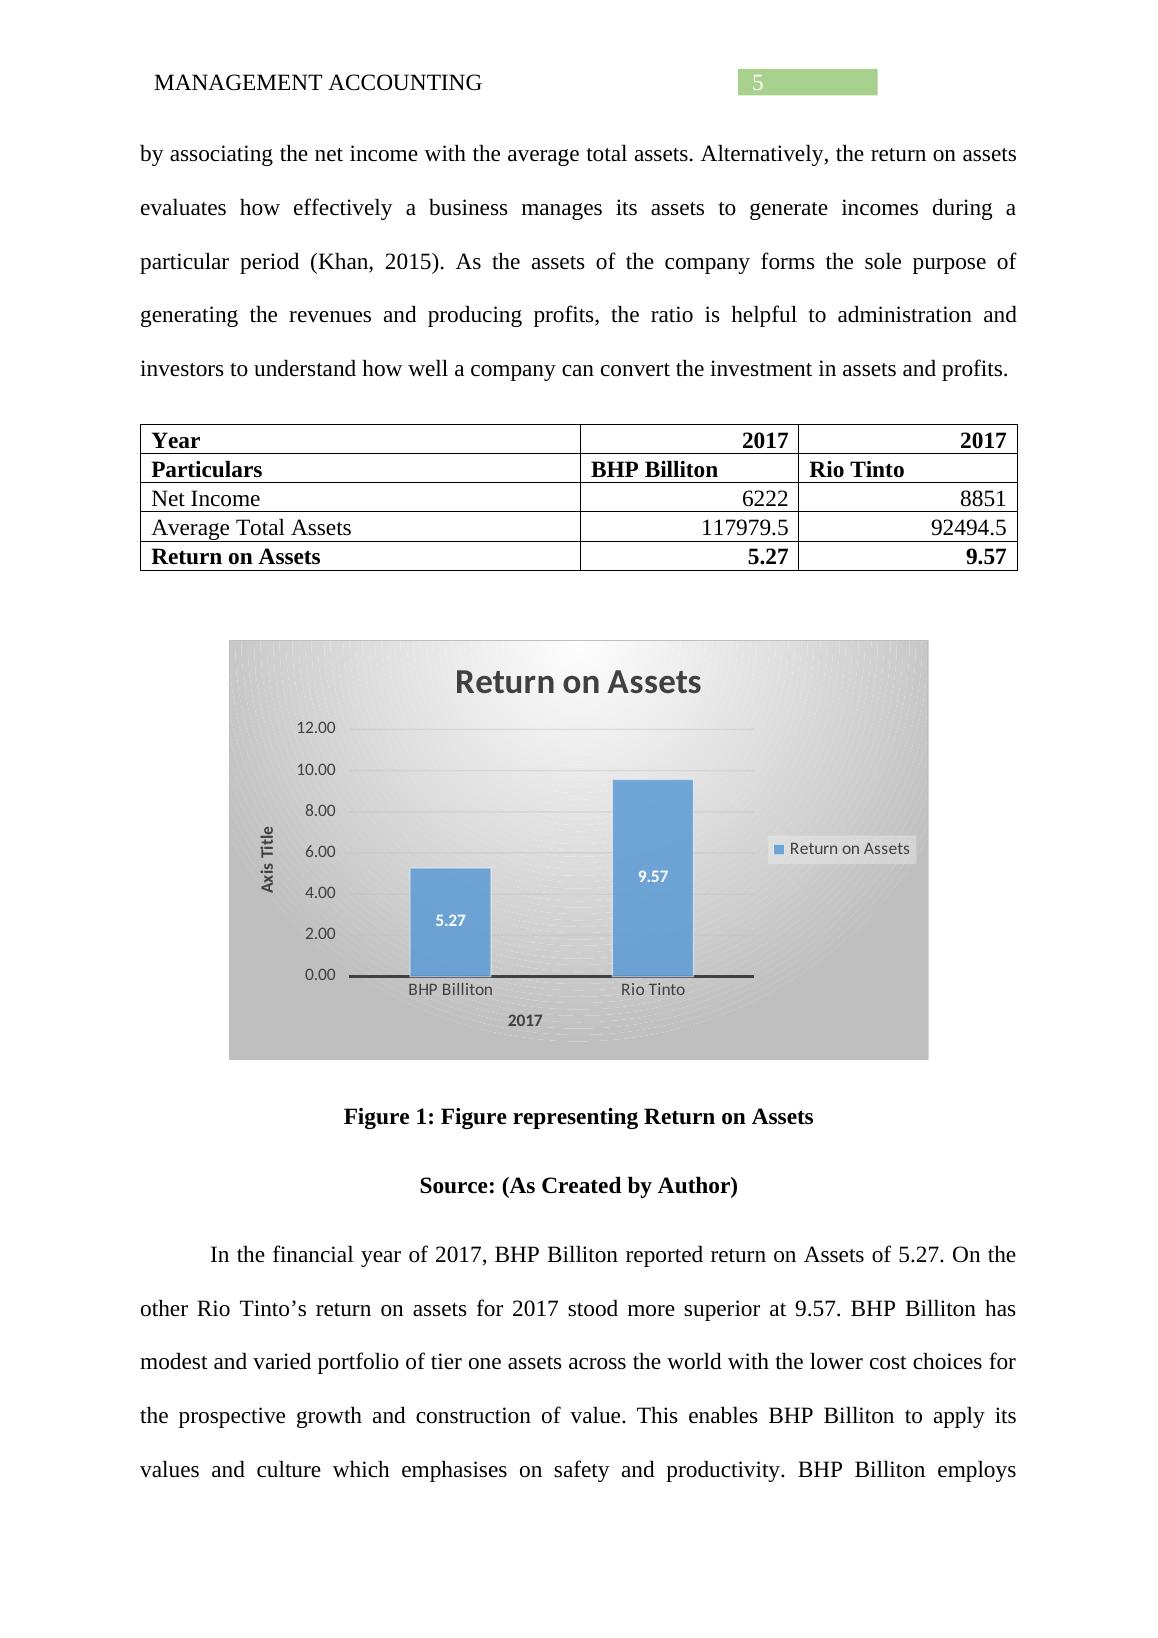
by associating the net income with the average total assets. Alternatively, the return on assets
evaluates how effectively a business manages its assets to generate incomes during a
particular period (Khan, 2015). As the assets of the company forms the sole purpose of
generating the revenues and producing profits, the ratio is helpful to administration and
investors to understand how well a company can convert the investment in assets and profits.
Year 2017 2017
Particulars BHP Billiton Rio Tinto
Net Income 6222 8851
Average Total Assets 117979.5 92494.5
Return on Assets 5.27 9.57
BHP Billiton Rio Tinto
0.00
2.00
4.00
6.00
8.00
10.00
12.00
5.27
9.57
Return on Assets
Return on Assets
2017
Axis Title
Figure 1: Figure representing Return on Assets
Source: (As Created by Author)
In the financial year of 2017, BHP Billiton reported return on Assets of 5.27. On the
other Rio Tinto’s return on assets for 2017 stood more superior at 9.57. BHP Billiton has
modest and varied portfolio of tier one assets across the world with the lower cost choices for
the prospective growth and construction of value. This enables BHP Billiton to apply its
values and culture which emphasises on safety and productivity. BHP Billiton employs
6MANAGEMENT ACCOUNTING
technology and uses disciplined investment to extract the most worth and maximum returns
from its assets.
Rio Tinto’s annualized return on assets for the year stood 9.57. Rio Tinto reported a
capitalized property plant and equipment of US $441 million. Additionally, the book value of
assets increasingly stood US $118 million. Understandably, Rio Tinto’s return on assets as
represents large investment in the capital assets with the ultimate objective of generating
greater revenue and producing higher profits (Barth, 2015). On a comparative note, the return
on assets of Rio Tinto’s stood stronger than BHP Billiton which implies that Rio Tinto has
the better ability of generating revenues and profits from its given assets.
Return on Ordinary Equity:
The return on ordinary equity or return on equity is the profitability ratio which
evaluates the capability of an organization to produce profits from the stakeholders’
investment in the company (Hoskin et al., 2014). Alternatively, the return on equity evaluates
the efficiency of the company to use its money from the shareholders to yield profits and
enlarge the business.
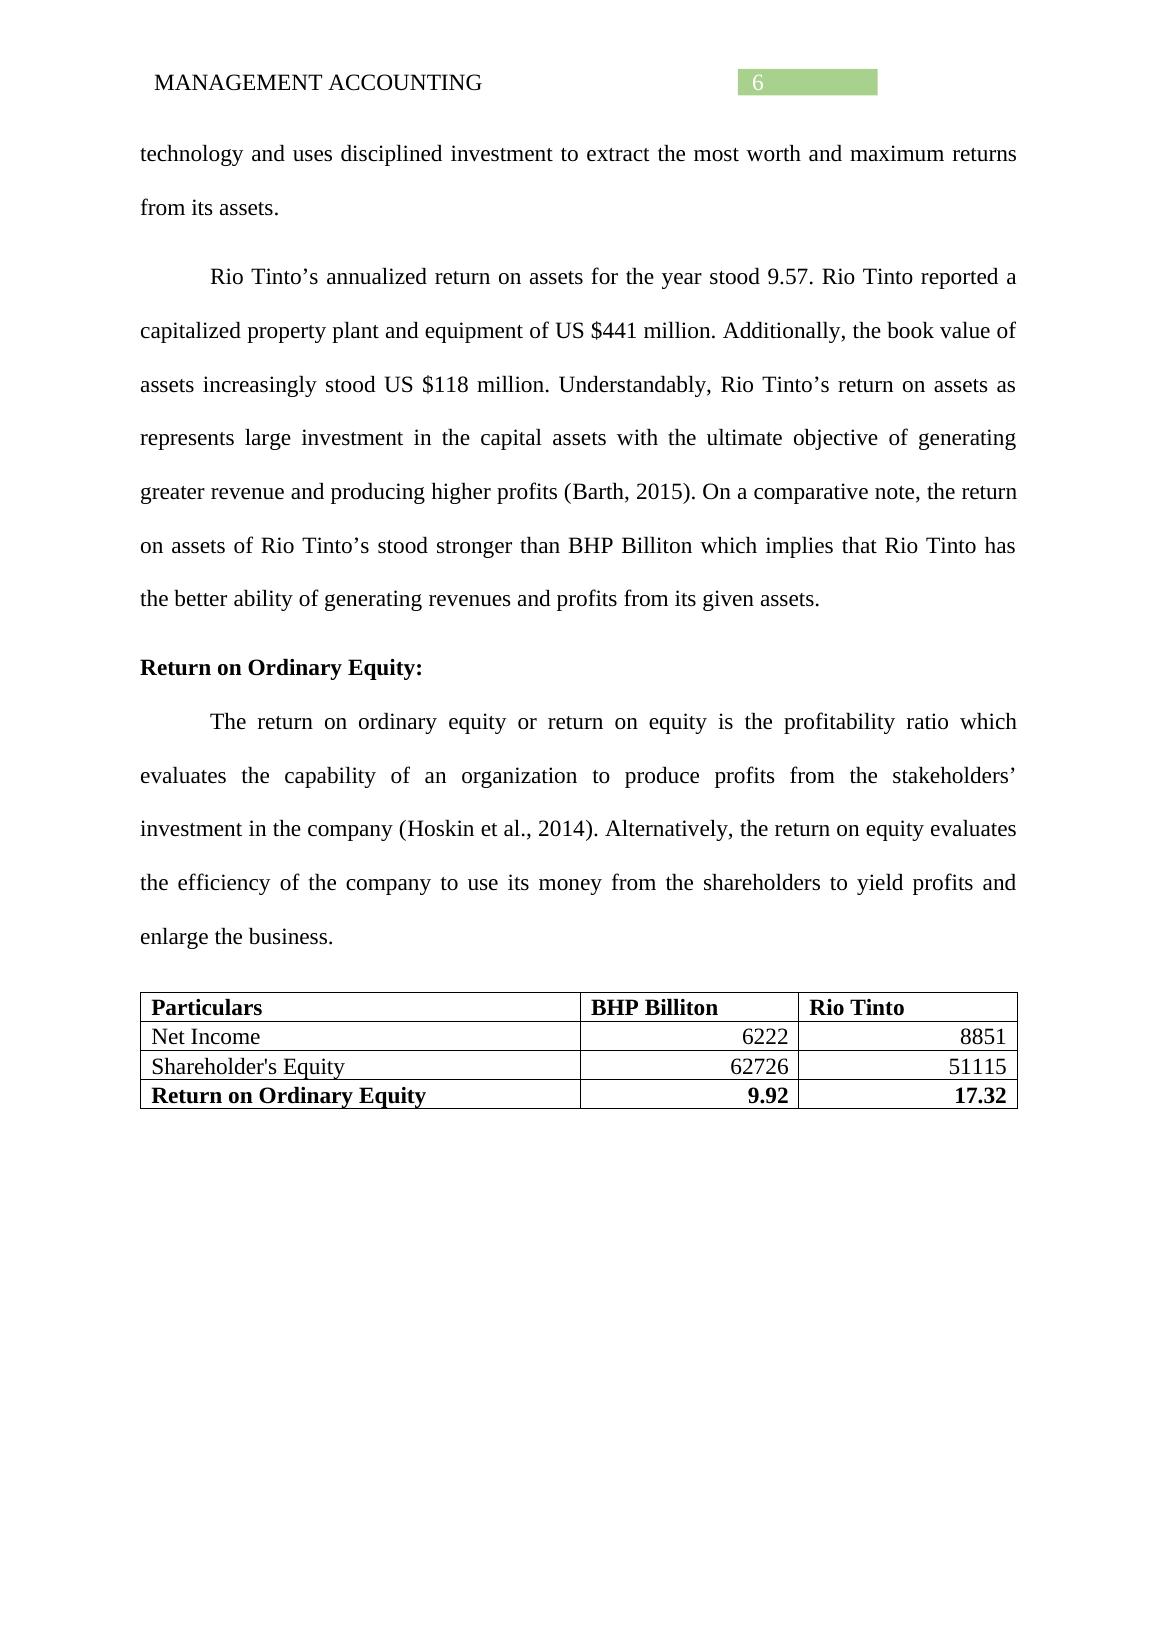
Particulars BHP Billiton Rio Tinto
Net Income 6222 8851
Shareholder's Equity 62726 51115
Return on Ordinary Equity 9.92 17.32
technology and uses disciplined investment to extract the most worth and maximum returns
from its assets.
Rio Tinto’s annualized return on assets for the year stood 9.57. Rio Tinto reported a
capitalized property plant and equipment of US $441 million. Additionally, the book value of
assets increasingly stood US $118 million. Understandably, Rio Tinto’s return on assets as
represents large investment in the capital assets with the ultimate objective of generating
greater revenue and producing higher profits (Barth, 2015). On a comparative note, the return
on assets of Rio Tinto’s stood stronger than BHP Billiton which implies that Rio Tinto has
the better ability of generating revenues and profits from its given assets.
Return on Ordinary Equity:
The return on ordinary equity or return on equity is the profitability ratio which
evaluates the capability of an organization to produce profits from the stakeholders’
investment in the company (Hoskin et al., 2014). Alternatively, the return on equity evaluates
the efficiency of the company to use its money from the shareholders to yield profits and
enlarge the business.
Particulars BHP Billiton Rio Tinto
Net Income 6222 8851
Shareholder's Equity 62726 51115
Return on Ordinary Equity 9.92 17.32
7MANAGEMENT ACCOUNTING
BHP Billiton Rio Tinto
0.00
2.00
4.00
6.00
8.00
10.00
12.00
14.00
16.00
18.00
20.00
9.92
17.32
Return on Ordinary Equity
Return on Ordinary Equity
2017
Axis Title
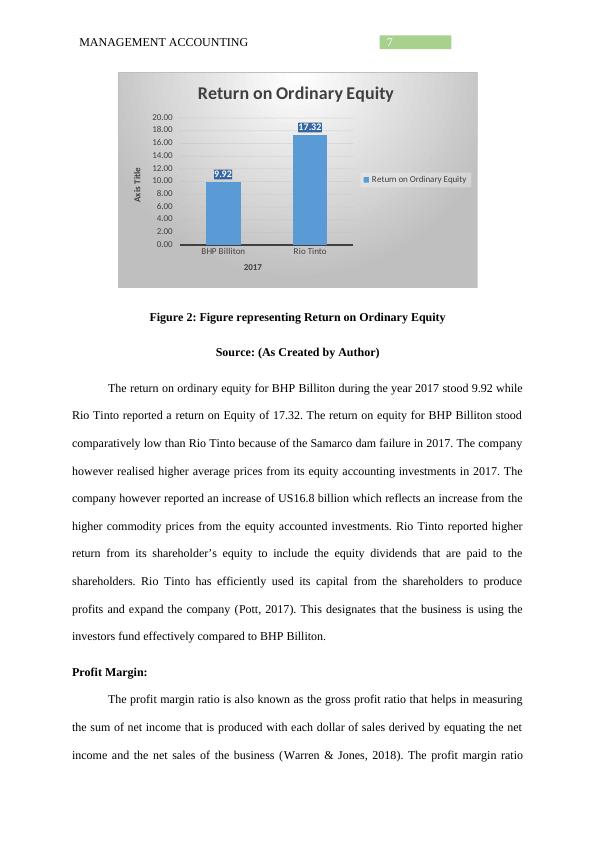
Figure 2: Figure representing Return on Ordinary Equity
Source: (As Created by Author)
The return on ordinary equity for BHP Billiton during the year 2017 stood 9.92 while
Rio Tinto reported a return on Equity of 17.32. The return on equity for BHP Billiton stood
comparatively low than Rio Tinto because of the Samarco dam failure in 2017. The company
however realised higher average prices from its equity accounting investments in 2017. The
company however reported an increase of US16.8 billion which reflects an increase from the
higher commodity prices from the equity accounted investments. Rio Tinto reported higher
return from its shareholder’s equity to include the equity dividends that are paid to the
shareholders. Rio Tinto has efficiently used its capital from the shareholders to produce
profits and expand the company (Pott, 2017). This designates that the business is using the
investors fund effectively compared to BHP Billiton.
Profit Margin:
The profit margin ratio is also known as the gross profit ratio that helps in measuring
the sum of net income that is produced with each dollar of sales derived by equating the net
income and the net sales of the business (Warren & Jones, 2018). The profit margin ratio
BHP Billiton Rio Tinto
0.00
2.00
4.00
6.00
8.00
10.00
12.00
14.00
16.00
18.00
20.00
9.92
17.32
Return on Ordinary Equity
Return on Ordinary Equity
2017
Axis Title
Figure 2: Figure representing Return on Ordinary Equity
Source: (As Created by Author)
The return on ordinary equity for BHP Billiton during the year 2017 stood 9.92 while
Rio Tinto reported a return on Equity of 17.32. The return on equity for BHP Billiton stood
comparatively low than Rio Tinto because of the Samarco dam failure in 2017. The company
however realised higher average prices from its equity accounting investments in 2017. The
company however reported an increase of US16.8 billion which reflects an increase from the
higher commodity prices from the equity accounted investments. Rio Tinto reported higher
return from its shareholder’s equity to include the equity dividends that are paid to the
shareholders. Rio Tinto has efficiently used its capital from the shareholders to produce
profits and expand the company (Pott, 2017). This designates that the business is using the
investors fund effectively compared to BHP Billiton.
Profit Margin:
The profit margin ratio is also known as the gross profit ratio that helps in measuring
the sum of net income that is produced with each dollar of sales derived by equating the net
income and the net sales of the business (Warren & Jones, 2018). The profit margin ratio
End of preview
Want to access all the pages? Upload your documents or become a member.
Related Documents
Accounting for Business Assignment PDFlg...
|19
|3321
|46
Corporate Accounting: Analysis of Finance Statements of ASX Listed Entitieslg...
|25
|4640
|111
Corporate Accountinglg...
|23
|4909
|209
Analysing Financials of the BHP Billitonlg...
|33
|10149
|34
Mining Company in Australia- BHP Billitonlg...
|2
|577
|47
Financial Analysis of BHP Billiton and Rio Tintolg...
|10
|1402
|354