Financial Ratio Analysis and Comparison of Apex Printing Company
VerifiedAdded on 2023/06/04
|7
|1229
|132
Report
AI Summary
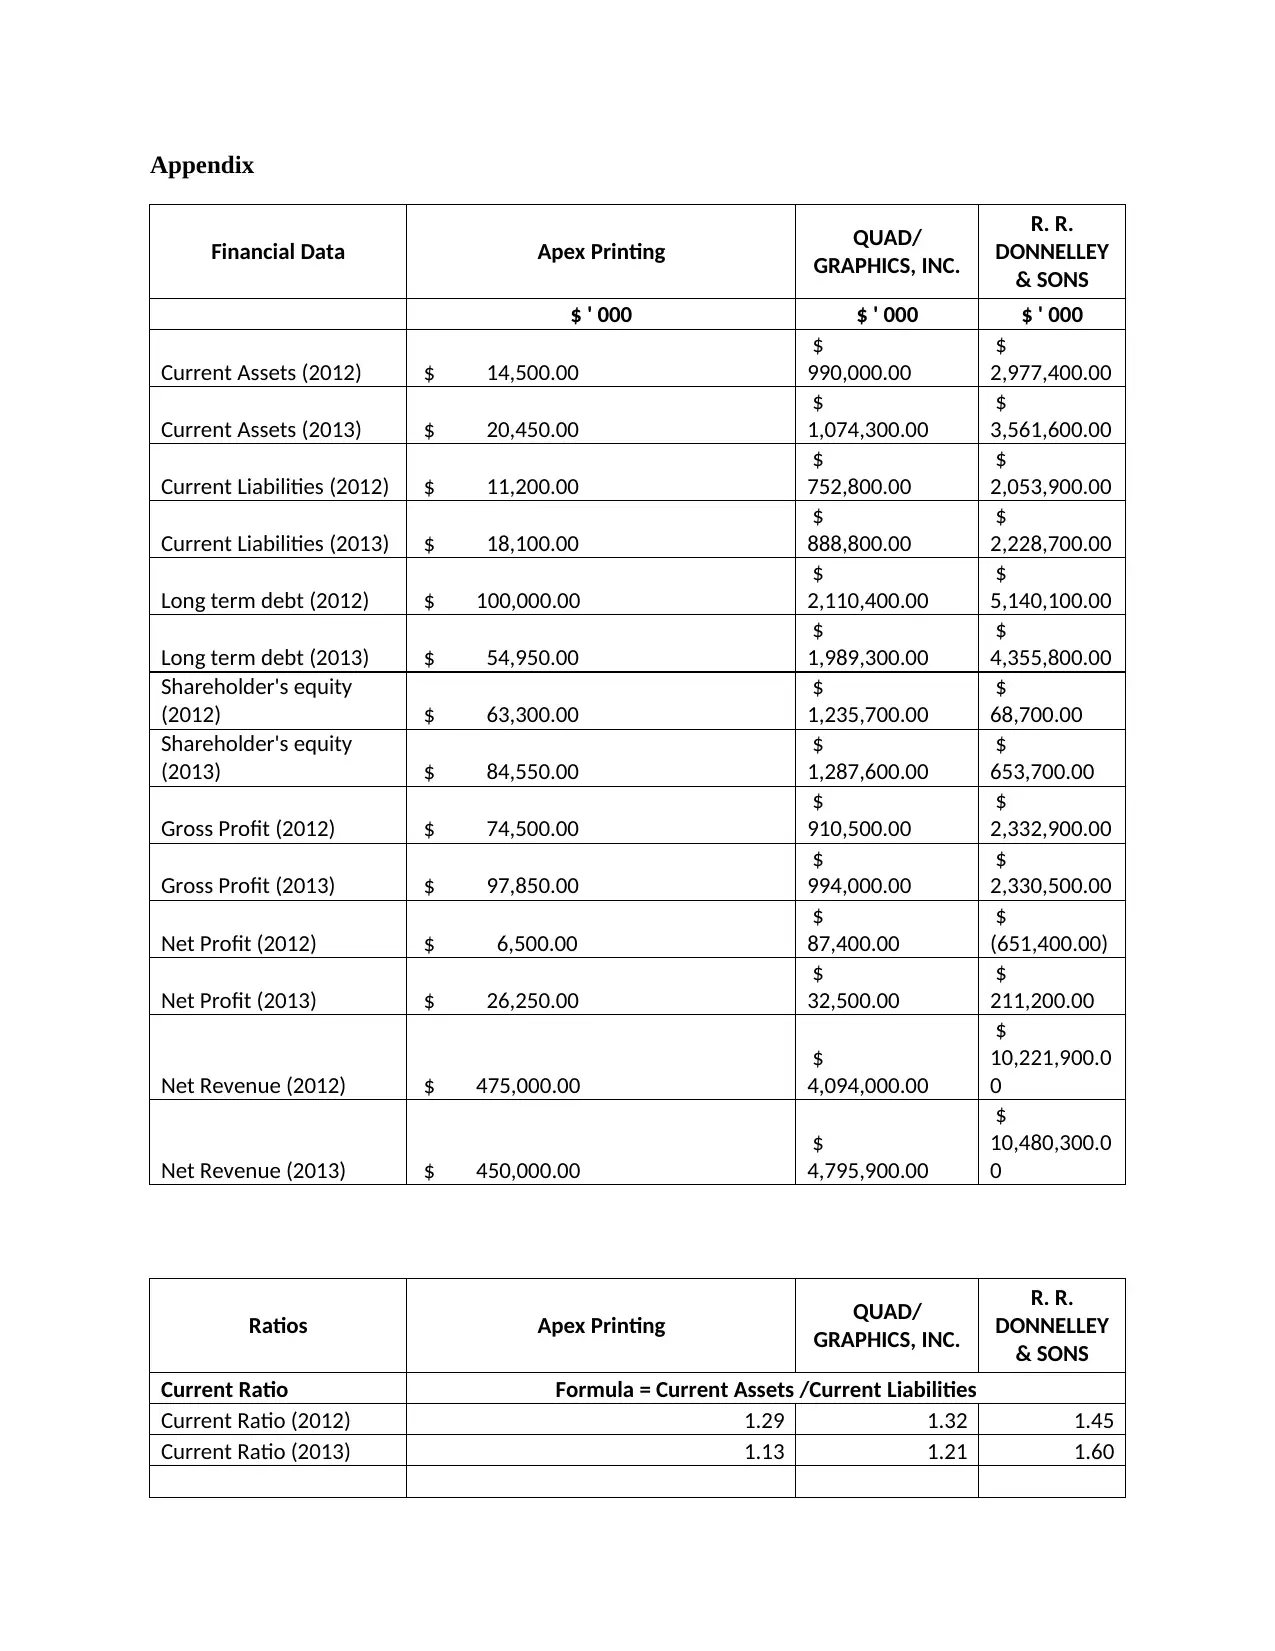
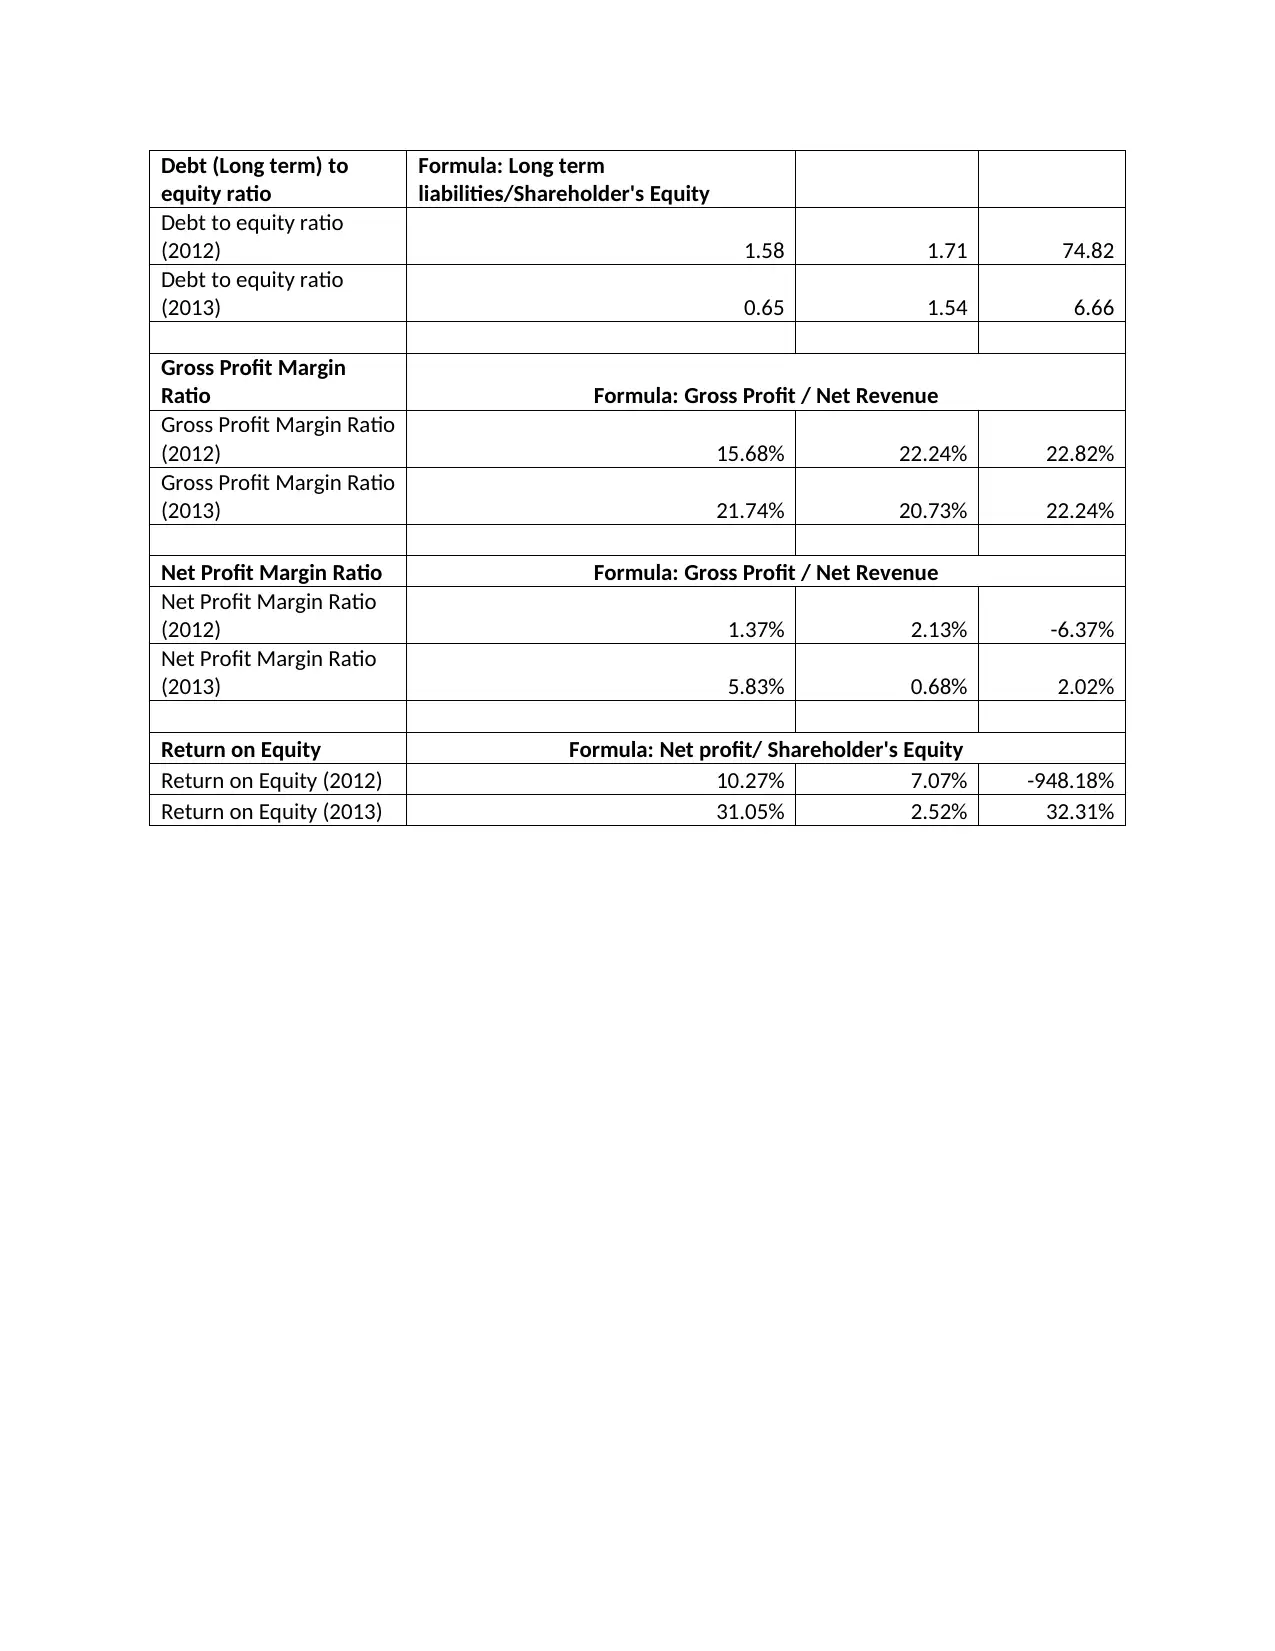
This report presents a comparative financial ratio analysis of Apex Printing Company, evaluating its performance against two competitors, QUAD/GRAPHICS and R.R. Donnelley & Sons. The analysis covers key financial ratios including current ratio, debt-to-equity ratio, gross profit margin, net profit margin, and return on equity for the years 2012 and 2013. The report highlights trends, such as the declining current ratio of Apex Printing, its improved debt position, and the fluctuating profit margins and return on equity compared to its competitors. It utilizes financial data from the provided appendix and draws conclusions about the company's liquidity, solvency, and profitability relative to its industry peers, referencing relevant financial management literature.

1 out of 7
Related Documents


Your All-in-One AI-Powered Toolkit for Academic Success.
+13062052269
info@desklib.com
Available 24*7 on WhatsApp / Email
![[object Object]](/_next/static/media/star-bottom.7253800d.svg)
Copyright © 2020–2025 A2Z Services. All Rights Reserved. Developed and managed by ZUCOL.