Financial Ratio Analysis Report - Financial Performance Analysis

Verified

Added on  2020/05/16

|4
|382
|115
Report
AI Summary
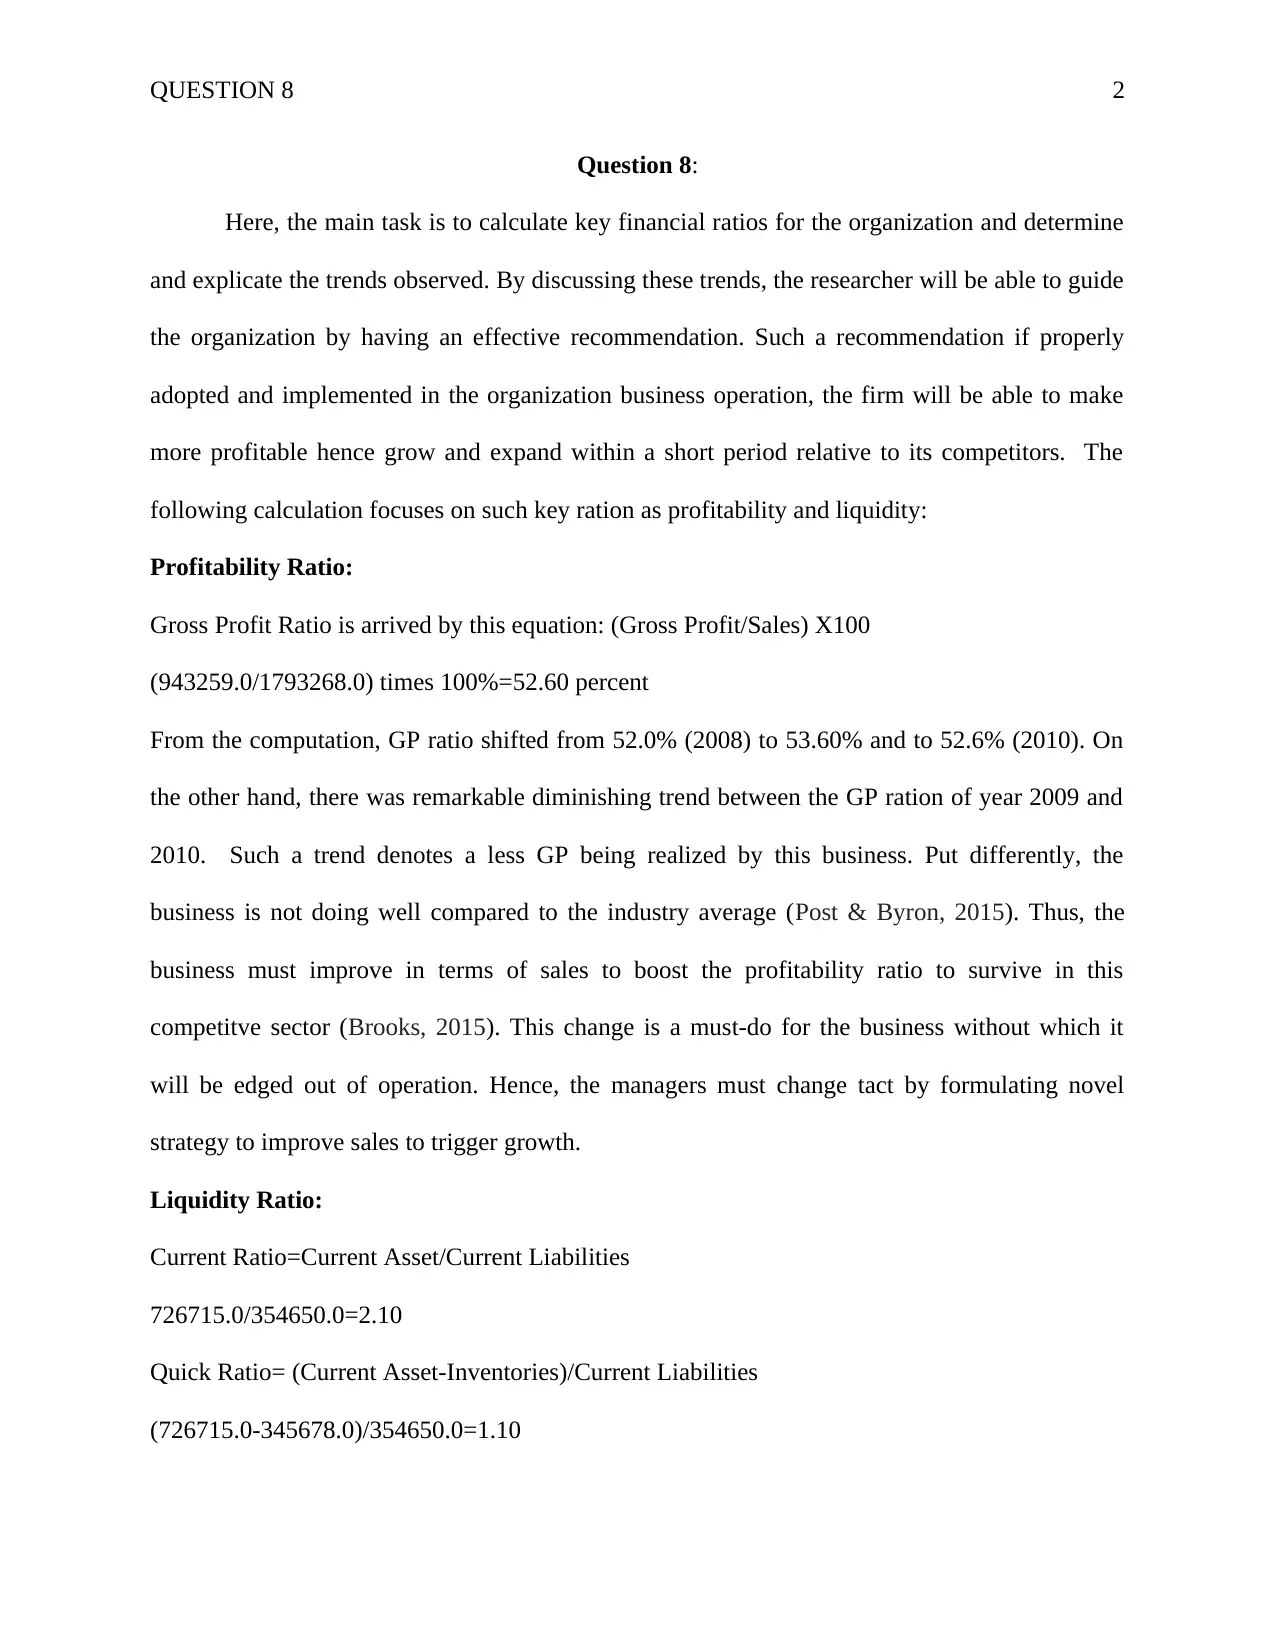
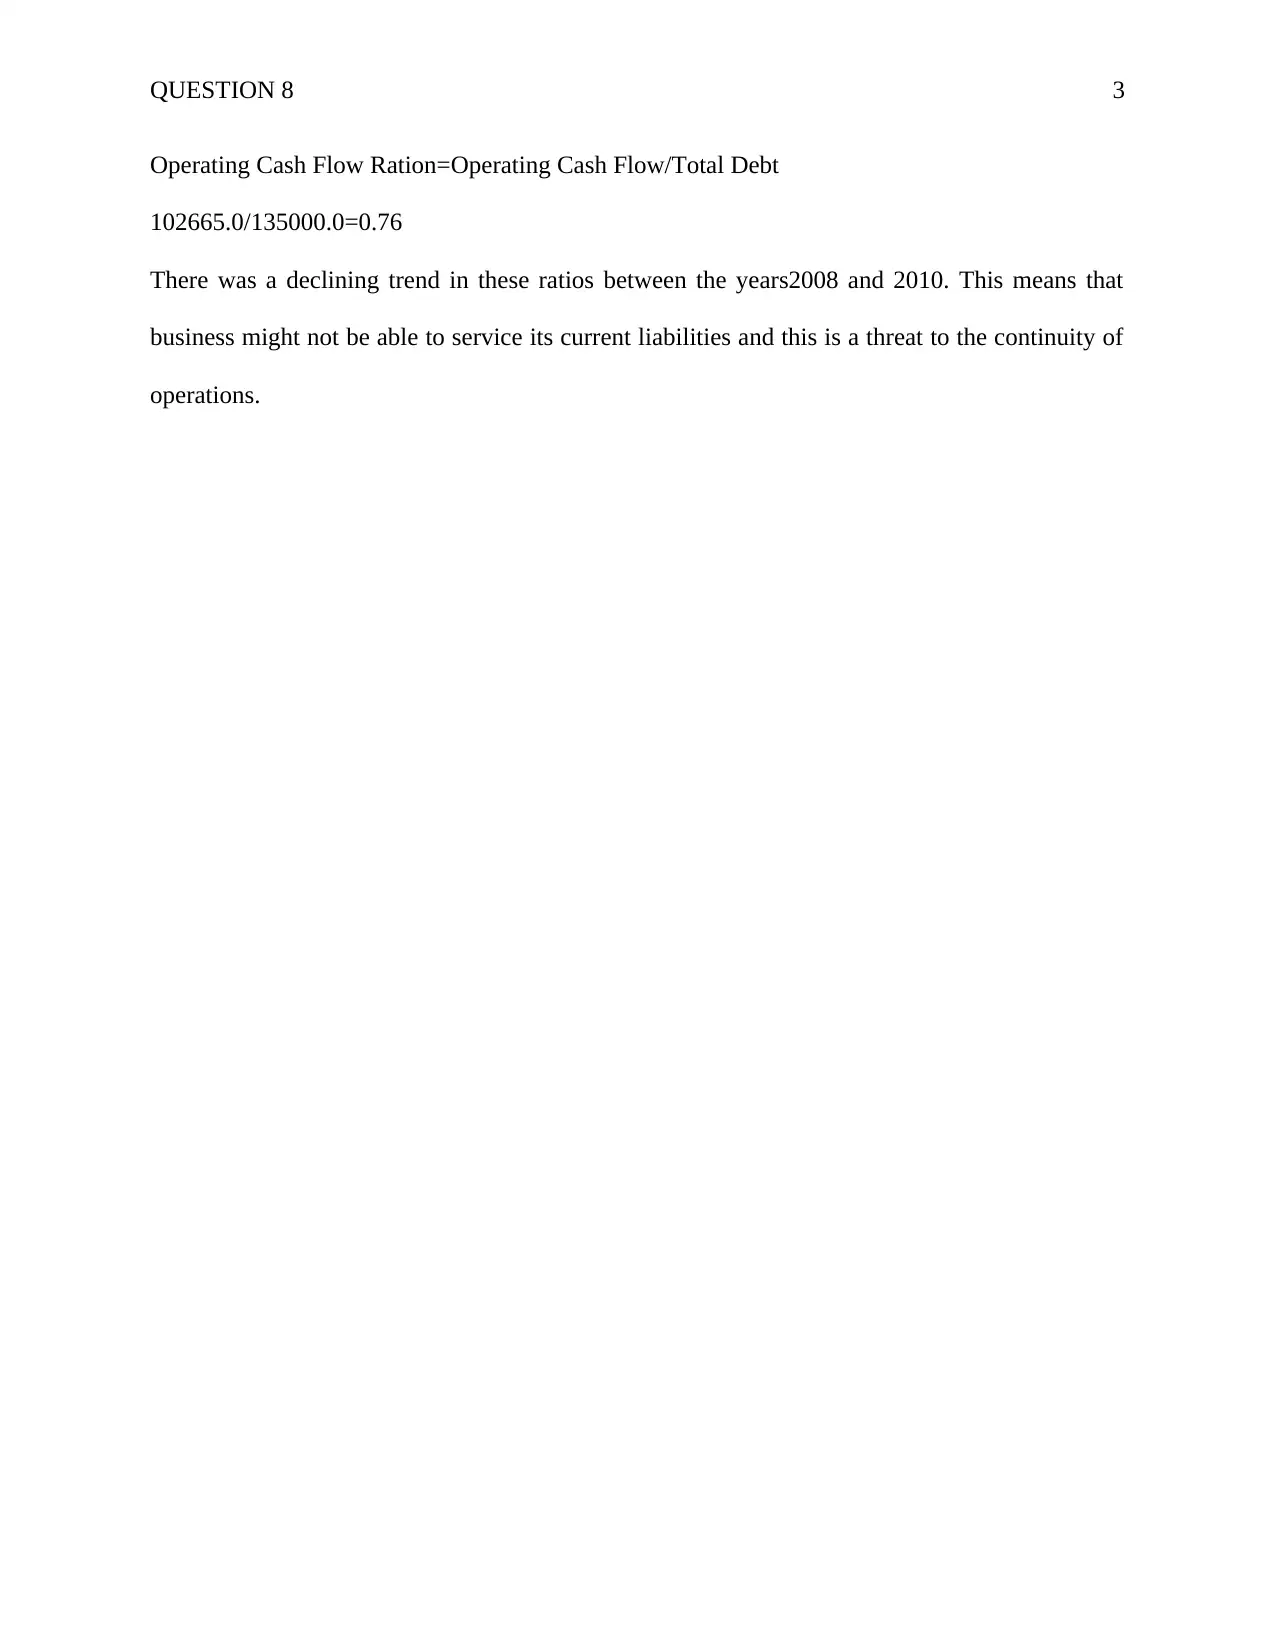
This report presents a financial ratio analysis, focusing on profitability and liquidity. The analysis includes the calculation of Gross Profit (GP) ratio, current ratio, quick ratio, and operating cash flow ratio for the years 2008, 2009, and 2010. The GP ratio analysis indicates a slight decline, suggesting potential challenges in sales. Liquidity ratios, including current and quick ratios, reveal a decreasing trend, raising concerns about the business's ability to meet current liabilities. The report underscores the need for strategic improvements in sales and financial management to ensure the business's sustainability and competitive edge. The report also references relevant literature on financial management and business performance.
Document Page
Running head: QUESTION 8 1
Question 8
Name
Institution
tabler-icon-diamond-filled.svg

Paraphrase This Document

Need a fresh take? Get an instant paraphrase of this document with our AI Paraphraser
Document Page
QUESTION 8 2
Question 8:
Here, the main task is to calculate key financial ratios for the organization and determine
and explicate the trends observed. By discussing these trends, the researcher will be able to guide
the organization by having an effective recommendation. Such a recommendation if properly
adopted and implemented in the organization business operation, the firm will be able to make
more profitable hence grow and expand within a short period relative to its competitors. The
following calculation focuses on such key ration as profitability and liquidity:
Profitability Ratio:
Gross Profit Ratio is arrived by this equation: (Gross Profit/Sales) X100
(943259.0/1793268.0) times 100%=52.60 percent
From the computation, GP ratio shifted from 52.0% (2008) to 53.60% and to 52.6% (2010). On
the other hand, there was remarkable diminishing trend between the GP ration of year 2009 and
2010. Such a trend denotes a less GP being realized by this business. Put differently, the
business is not doing well compared to the industry average (Post & Byron, 2015). Thus, the
business must improve in terms of sales to boost the profitability ratio to survive in this
competitve sector (Brooks, 2015). This change is a must-do for the business without which it
will be edged out of operation. Hence, the managers must change tact by formulating novel
strategy to improve sales to trigger growth.
Liquidity Ratio:
Current Ratio=Current Asset/Current Liabilities
726715.0/354650.0=2.10
Quick Ratio= (Current Asset-Inventories)/Current Liabilities
(726715.0-345678.0)/354650.0=1.10
Document Page
QUESTION 8 3
Operating Cash Flow Ration=Operating Cash Flow/Total Debt
102665.0/135000.0=0.76
There was a declining trend in these ratios between the years2008 and 2010. This means that
business might not be able to service its current liabilities and this is a threat to the continuity of
operations.
Document Page
QUESTION 8 4
References
Brooks, R. (2015). Financial management: core concepts. Pearson.
Post, C., & Byron, K. (2015). Women on boards and firm financial performance: A meta-
analysis. Academy of Management Journal, 58(5), 1546-1571.
chevron_up_icon
1 out of 4
circle_padding
hide_on_mobile
zoom_out_icon
[object Object]