Corporate Accounting: Financial Statement Analysis of Baby Bunting
VerifiedAdded on 2023/06/11
|20
|3495
|428
Report
AI Summary
This report provides a critical analysis of the financial statements of Baby Bunting Group Ltd, an Australian company listed on the ASX, for the years 2015 to 2017. The analysis focuses on the cash flow statement, other comprehensive income statement, and corporate income tax accounting. It includes a comparative analysis of cash flow categories (operating, investing, and financing activities) and an examination of the components of other comprehensive income, which are absent in Baby Bunting's reports. The report also discusses the reasons behind differences in income tax payments, deferred tax treatments, and the relationship between tax payments in the cash flow statement and tax expenses in the income statement, concluding with overall observations about the company's tax treatment. Desklib is a platform where students can find such solved assignments.
Corporate Accounting- Financial Statement Analysis of Baby Bunting Group Ltd: 2015 to 2017
1
1
Paraphrase This Document
Need a fresh take? Get an instant paraphrase of this document with our AI Paraphraser
Executive Summary
This report will emphasize on an Australian corporate about their audited financial statement.
The comparison will be done on different types of reports for last three years to understand the
financial condition of the company. The area of concentration will be on cash flow statement,
other comprehensive income statement and income tax accounting of the company. A critical
analysis will feature different aspects of those reports for the considered three years.
Key words- cash flow, Corporate Income tax, comprehensive income statement
2
Table of Contents
Introduction.................................................................................................................................................4
Cash Flow statement analysis......................................................................................................................5
Comparative analysis of broad categories cash flow...............................................................................7
Other comprehensive income statement....................................................................................................8
Accounting for corporate income tax........................................................................................................12
Reasons behind differences of income tax payment.............................................................................13
Deferred tax..........................................................................................................................................13
Current Tax liability................................................................................................................................16
Income tax – payment shown in cash flow and expense booked in income statement........................17
Overall observation about tax treatment..............................................................................................18
References:................................................................................................................................................19
3
⊘ This is a preview!⊘
Do you want full access?
Subscribe today to unlock all pages.
Trusted by 1+ million students worldwide
Introduction
The subject of this report will be critical analysis of different financial statements of any
Australian company with ASX listing. For this purpose, the chosen company is Baby Bunting
Group Ltd of Victoria. The company is enlisted in ASX in 2015 with its ASX code BBN and
GICS Industry Group – retailing. (ASX, 2018) This report will emphasize on comparison of
audited financial report of the company for three years from 2015 to 2017. Main areas of
concentration will be cash flow statement, other comprehensive income statement and
accounting of corporate income tax with critical analysis of its different heads to highlight
significant changes for last three years in those domains. (Bunting, 2016) Cash flow statement
will be analyzed with the identification of the reason for such changes. Moreover, a comparative
analysis of cash flow statement with its broad category headings like operating activities,
investing activities and financing activities will be done with proper evaluation for the specified
period. Other comprehensive income statement will be analyzed in respect of its components
with their nature and the reason behind those components not being featured in income
statement. For corporate income tax, an analysis of tax expense of the company for considered
three years as per financial statement with its similarity as per corporate tax rate, discussion on
deferred tax treatment as per balance sheet, the amount of tax paid and the amount showed in
different financial statements along with other critical aspects of income tax accounting of the
4
Paraphrase This Document
Need a fresh take? Get an instant paraphrase of this document with our AI Paraphraser
company. This report will end up with some obdervations to make this report complete in all
aspect.
Cash Flow statement analysis
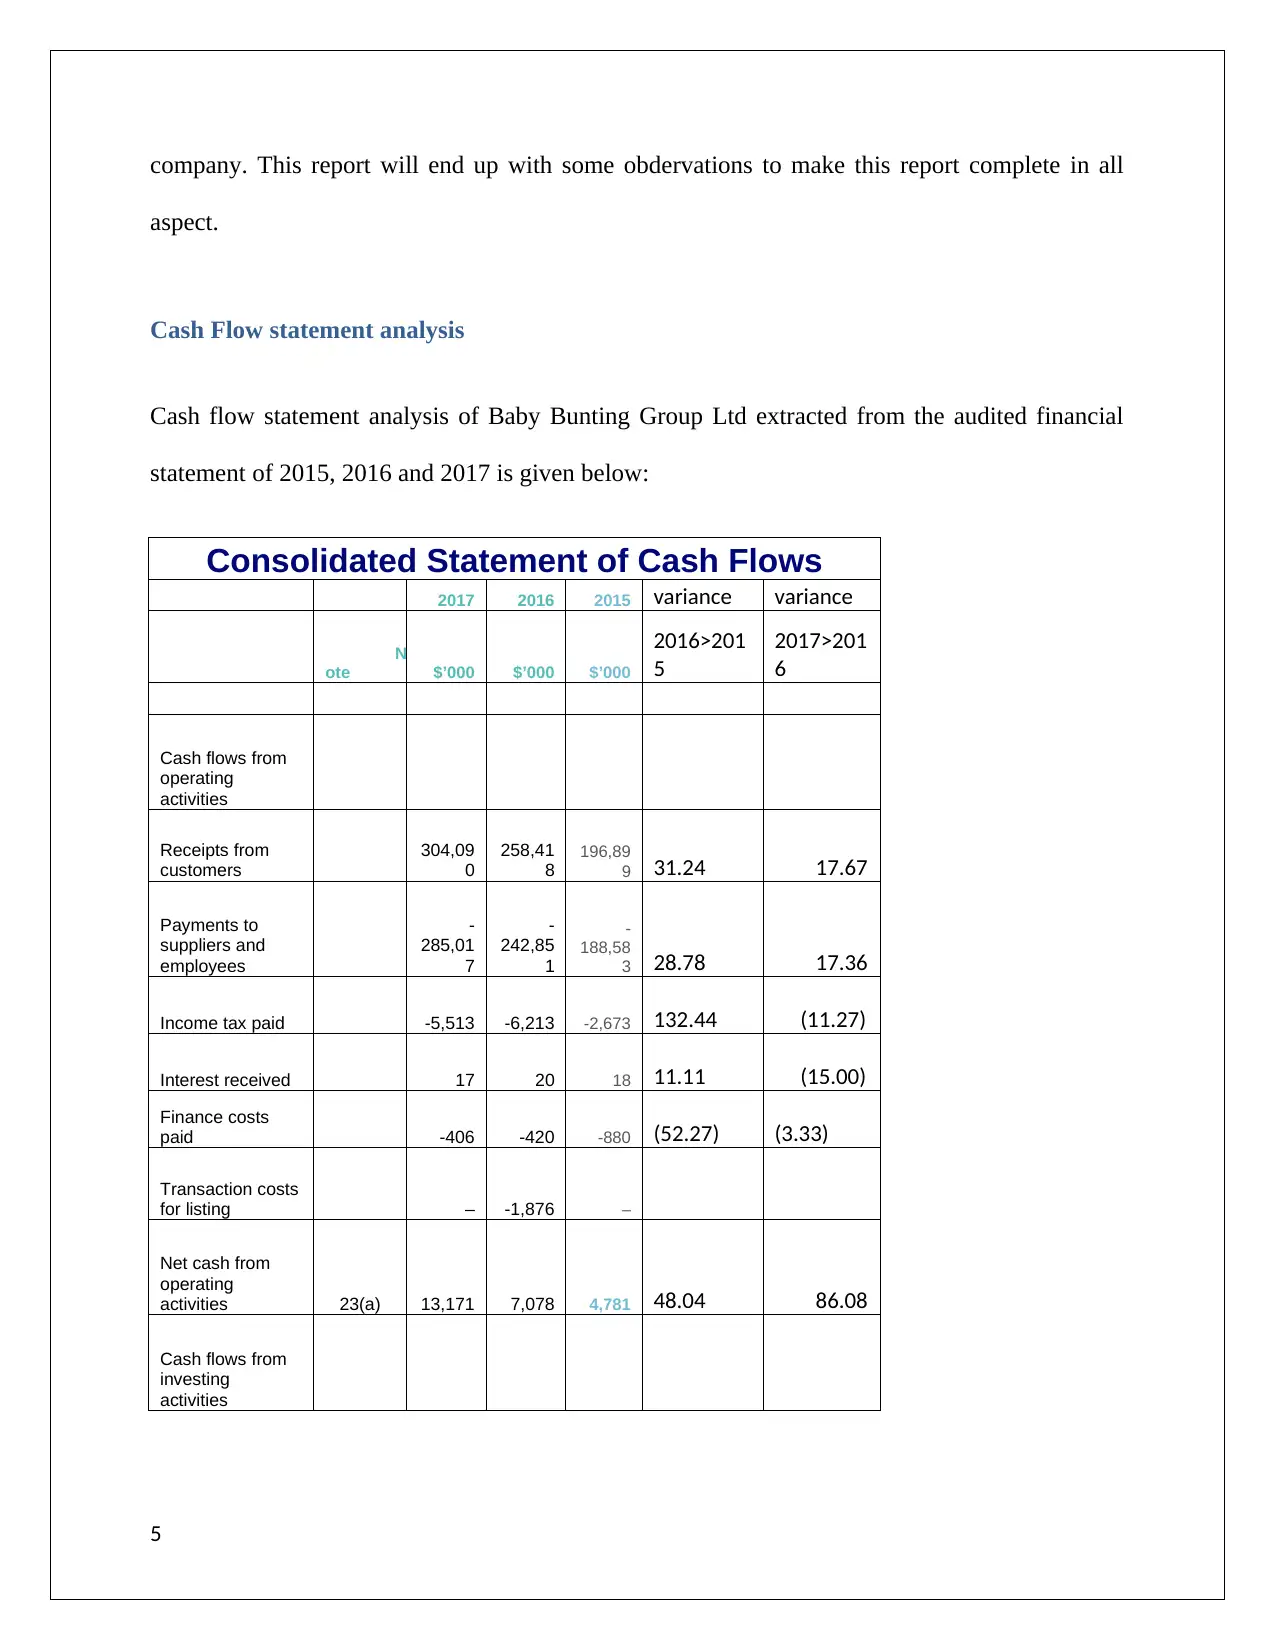
Cash flow statement analysis of Baby Bunting Group Ltd extracted from the audited financial
statement of 2015, 2016 and 2017 is given below:
Consolidated Statement of Cash Flows
2017 2016 2015 variance variance
N
ote $’000 $’000 $’000
2016>201
5
2017>201
6
Cash flows from
operating
activities
Receipts from
customers
304,09
0
258,41
8
196,89
9 31.24 17.67
Payments to
suppliers and
employees
-
285,01
7
-
242,85
1
-
188,58
3 28.78 17.36
Income tax paid -5,513 -6,213 -2,673 132.44 (11.27)
Interest received 17 20 18 11.11 (15.00)
Finance costs
paid -406 -420 -880 (52.27) (3.33)
Transaction costs
for listing – -1,876 –
Net cash from
operating
activities 23(a) 13,171 7,078 4,781 48.04 86.08
Cash flows from
investing
activities
5
aspect.
Cash Flow statement analysis
Cash flow statement analysis of Baby Bunting Group Ltd extracted from the audited financial
statement of 2015, 2016 and 2017 is given below:
Consolidated Statement of Cash Flows
2017 2016 2015 variance variance
N
ote $’000 $’000 $’000
2016>201
5
2017>201
6
Cash flows from
operating
activities
Receipts from
customers
304,09
0
258,41
8
196,89
9 31.24 17.67
Payments to
suppliers and
employees
-
285,01
7
-
242,85
1
-
188,58
3 28.78 17.36
Income tax paid -5,513 -6,213 -2,673 132.44 (11.27)
Interest received 17 20 18 11.11 (15.00)
Finance costs
paid -406 -420 -880 (52.27) (3.33)
Transaction costs
for listing – -1,876 –
Net cash from
operating
activities 23(a) 13,171 7,078 4,781 48.04 86.08
Cash flows from
investing
activities
5
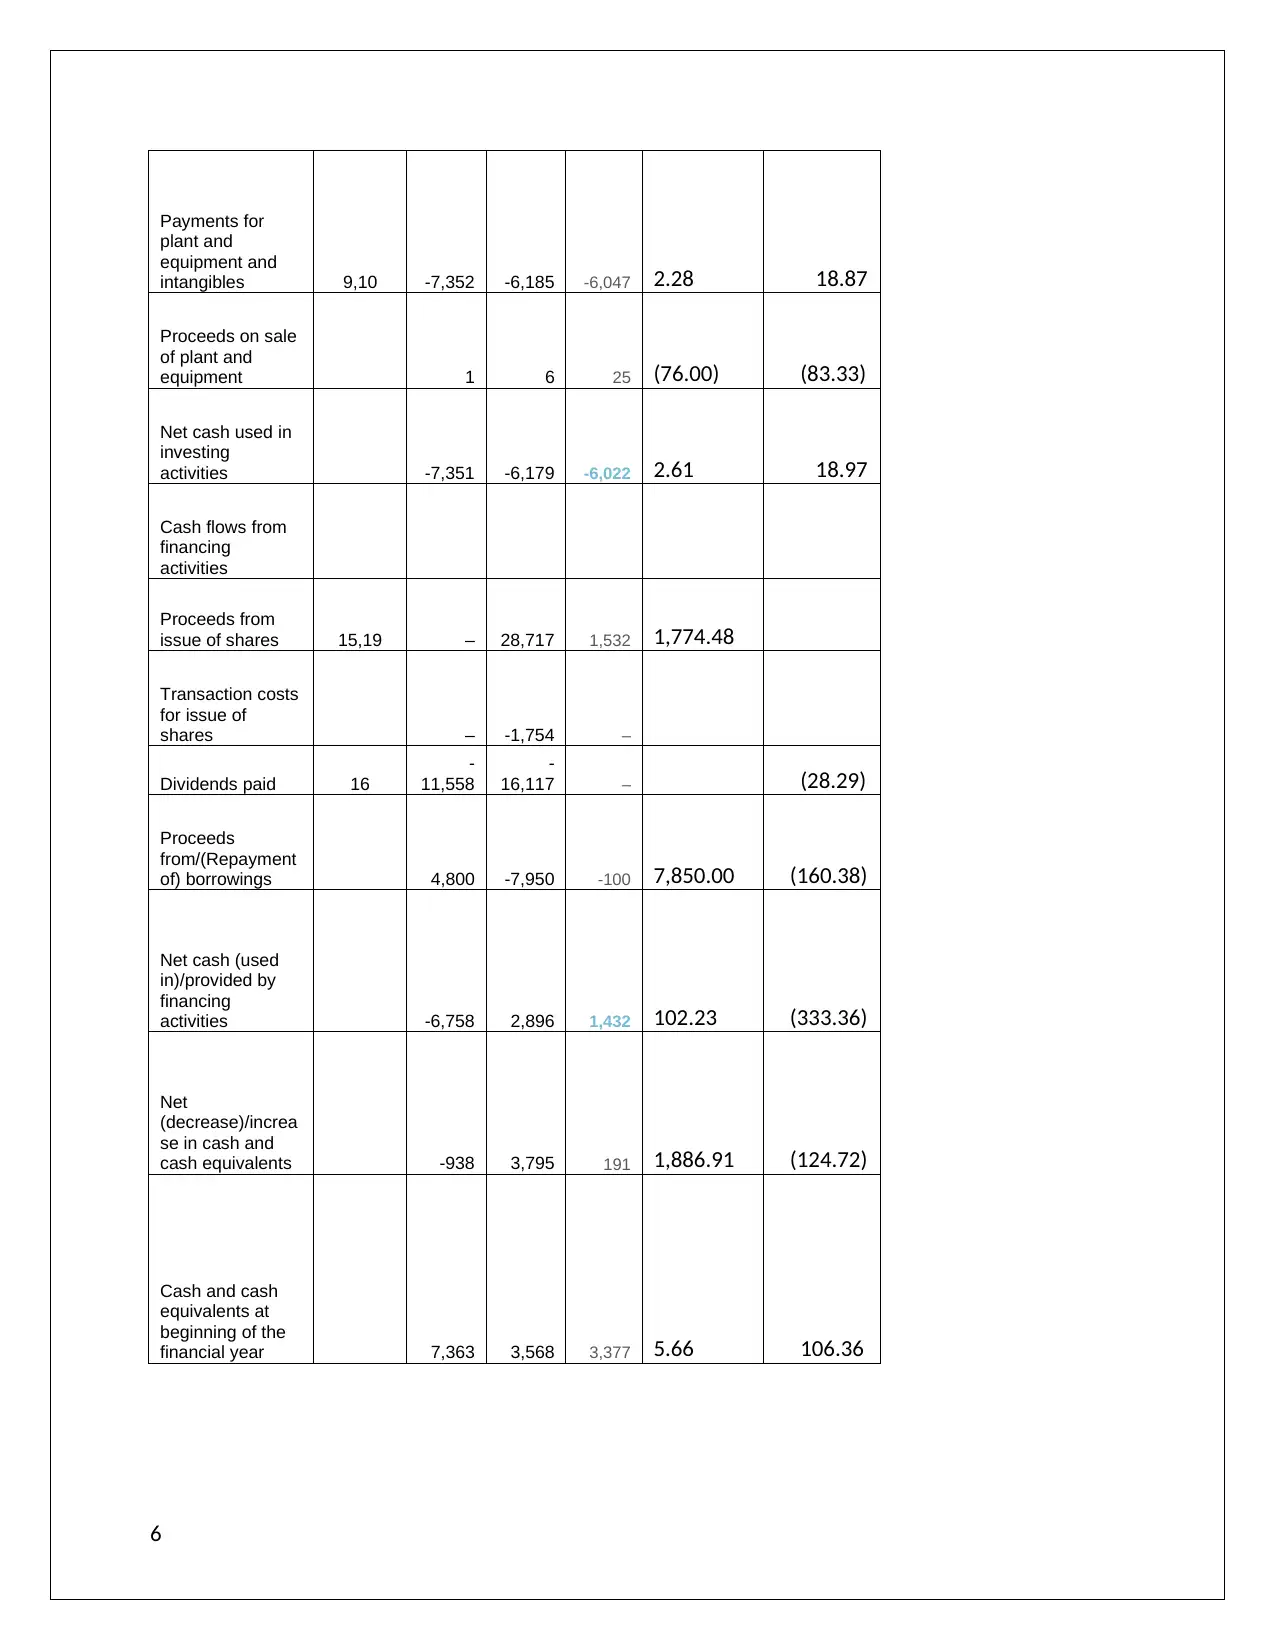
Payments for
plant and
equipment and
intangibles 9,10 -7,352 -6,185 -6,047 2.28 18.87
Proceeds on sale
of plant and
equipment 1 6 25 (76.00) (83.33)
Net cash used in
investing
activities -7,351 -6,179 -6,022 2.61 18.97
Cash flows from
financing
activities
Proceeds from
issue of shares 15,19 – 28,717 1,532 1,774.48
Transaction costs
for issue of
shares – -1,754 –
Dividends paid 16
-
11,558
-
16,117 – (28.29)
Proceeds
from/(Repayment
of) borrowings 4,800 -7,950 -100 7,850.00 (160.38)
Net cash (used
in)/provided by
financing
activities -6,758 2,896 1,432 102.23 (333.36)
Net
(decrease)/increa
se in cash and
cash equivalents -938 3,795 191 1,886.91 (124.72)
Cash and cash
equivalents at
beginning of the
financial year 7,363 3,568 3,377 5.66 106.36
6
⊘ This is a preview!⊘
Do you want full access?
Subscribe today to unlock all pages.
Trusted by 1+ million students worldwide
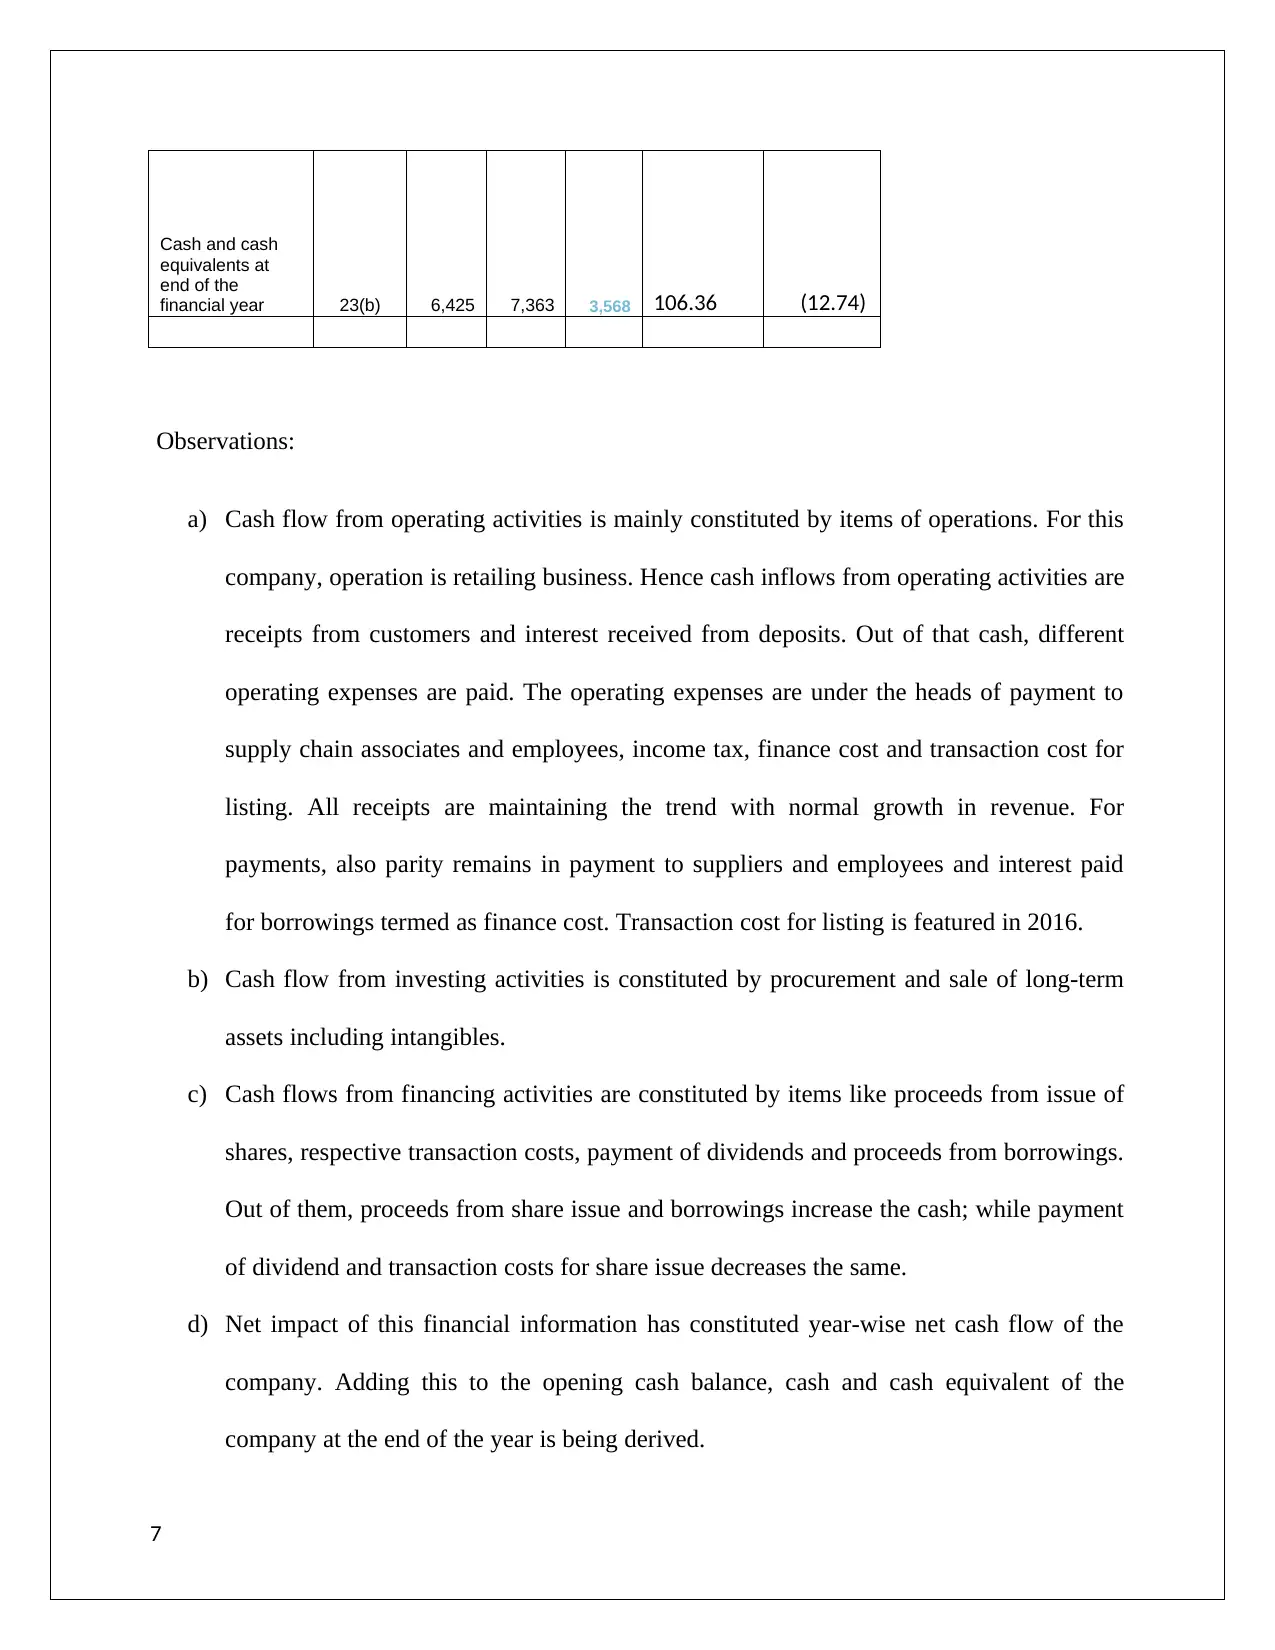
Cash and cash
equivalents at
end of the
financial year 23(b) 6,425 7,363 3,568 106.36 (12.74)
Observations:
a) Cash flow from operating activities is mainly constituted by items of operations. For this
company, operation is retailing business. Hence cash inflows from operating activities are
receipts from customers and interest received from deposits. Out of that cash, different
operating expenses are paid. The operating expenses are under the heads of payment to
supply chain associates and employees, income tax, finance cost and transaction cost for
listing. All receipts are maintaining the trend with normal growth in revenue. For
payments, also parity remains in payment to suppliers and employees and interest paid
for borrowings termed as finance cost. Transaction cost for listing is featured in 2016.
b) Cash flow from investing activities is constituted by procurement and sale of long-term
assets including intangibles.
c) Cash flows from financing activities are constituted by items like proceeds from issue of
shares, respective transaction costs, payment of dividends and proceeds from borrowings.
Out of them, proceeds from share issue and borrowings increase the cash; while payment
of dividend and transaction costs for share issue decreases the same.
d) Net impact of this financial information has constituted year-wise net cash flow of the
company. Adding this to the opening cash balance, cash and cash equivalent of the
company at the end of the year is being derived.
7
Paraphrase This Document
Need a fresh take? Get an instant paraphrase of this document with our AI Paraphraser
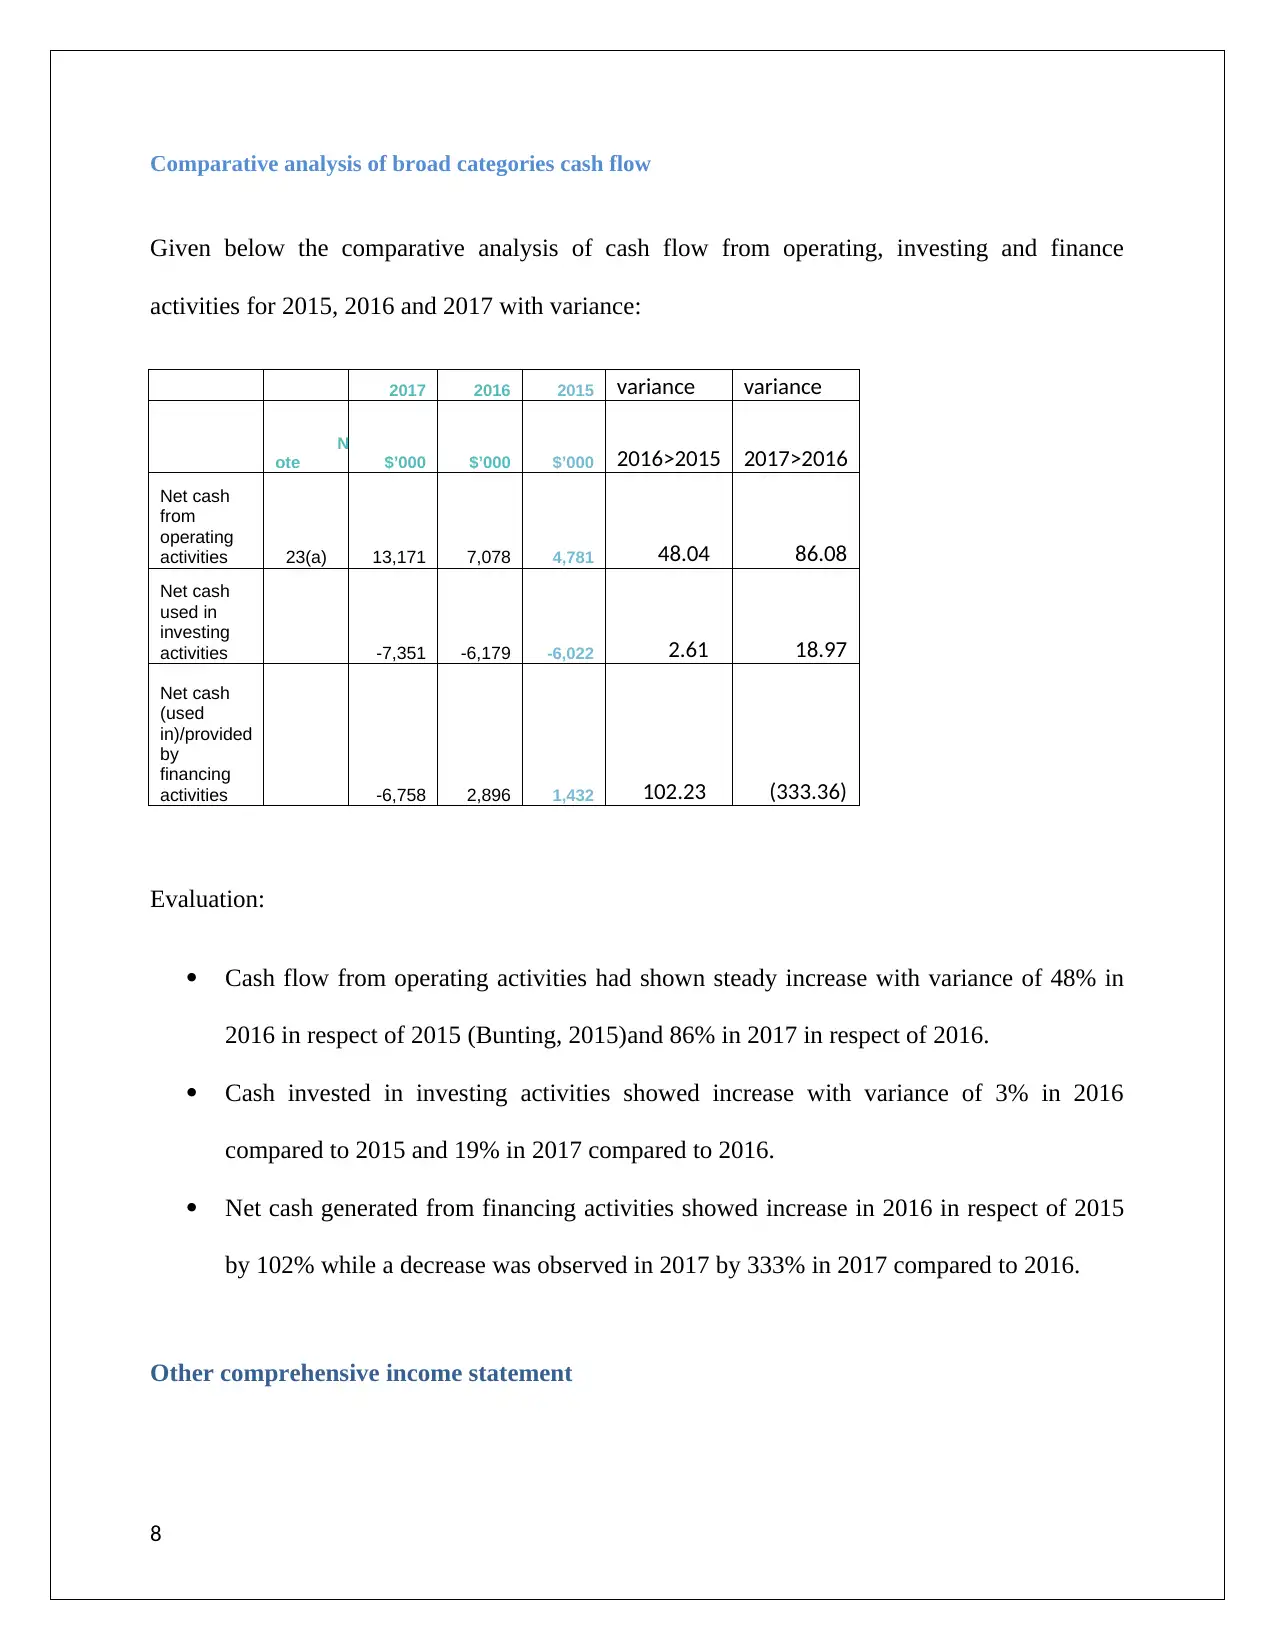
Comparative analysis of broad categories cash flow
Given below the comparative analysis of cash flow from operating, investing and finance
activities for 2015, 2016 and 2017 with variance:
2017 2016 2015 variance variance
N
ote $’000 $’000 $’000 2016>2015 2017>2016
Net cash
from
operating
activities 23(a) 13,171 7,078 4,781 48.04 86.08
Net cash
used in
investing
activities -7,351 -6,179 -6,022 2.61 18.97
Net cash
(used
in)/provided
by
financing
activities -6,758 2,896 1,432 102.23 (333.36)
Evaluation:
Cash flow from operating activities had shown steady increase with variance of 48% in
2016 in respect of 2015 (Bunting, 2015)and 86% in 2017 in respect of 2016.
Cash invested in investing activities showed increase with variance of 3% in 2016
compared to 2015 and 19% in 2017 compared to 2016.
Net cash generated from financing activities showed increase in 2016 in respect of 2015
by 102% while a decrease was observed in 2017 by 333% in 2017 compared to 2016.
Other comprehensive income statement
8
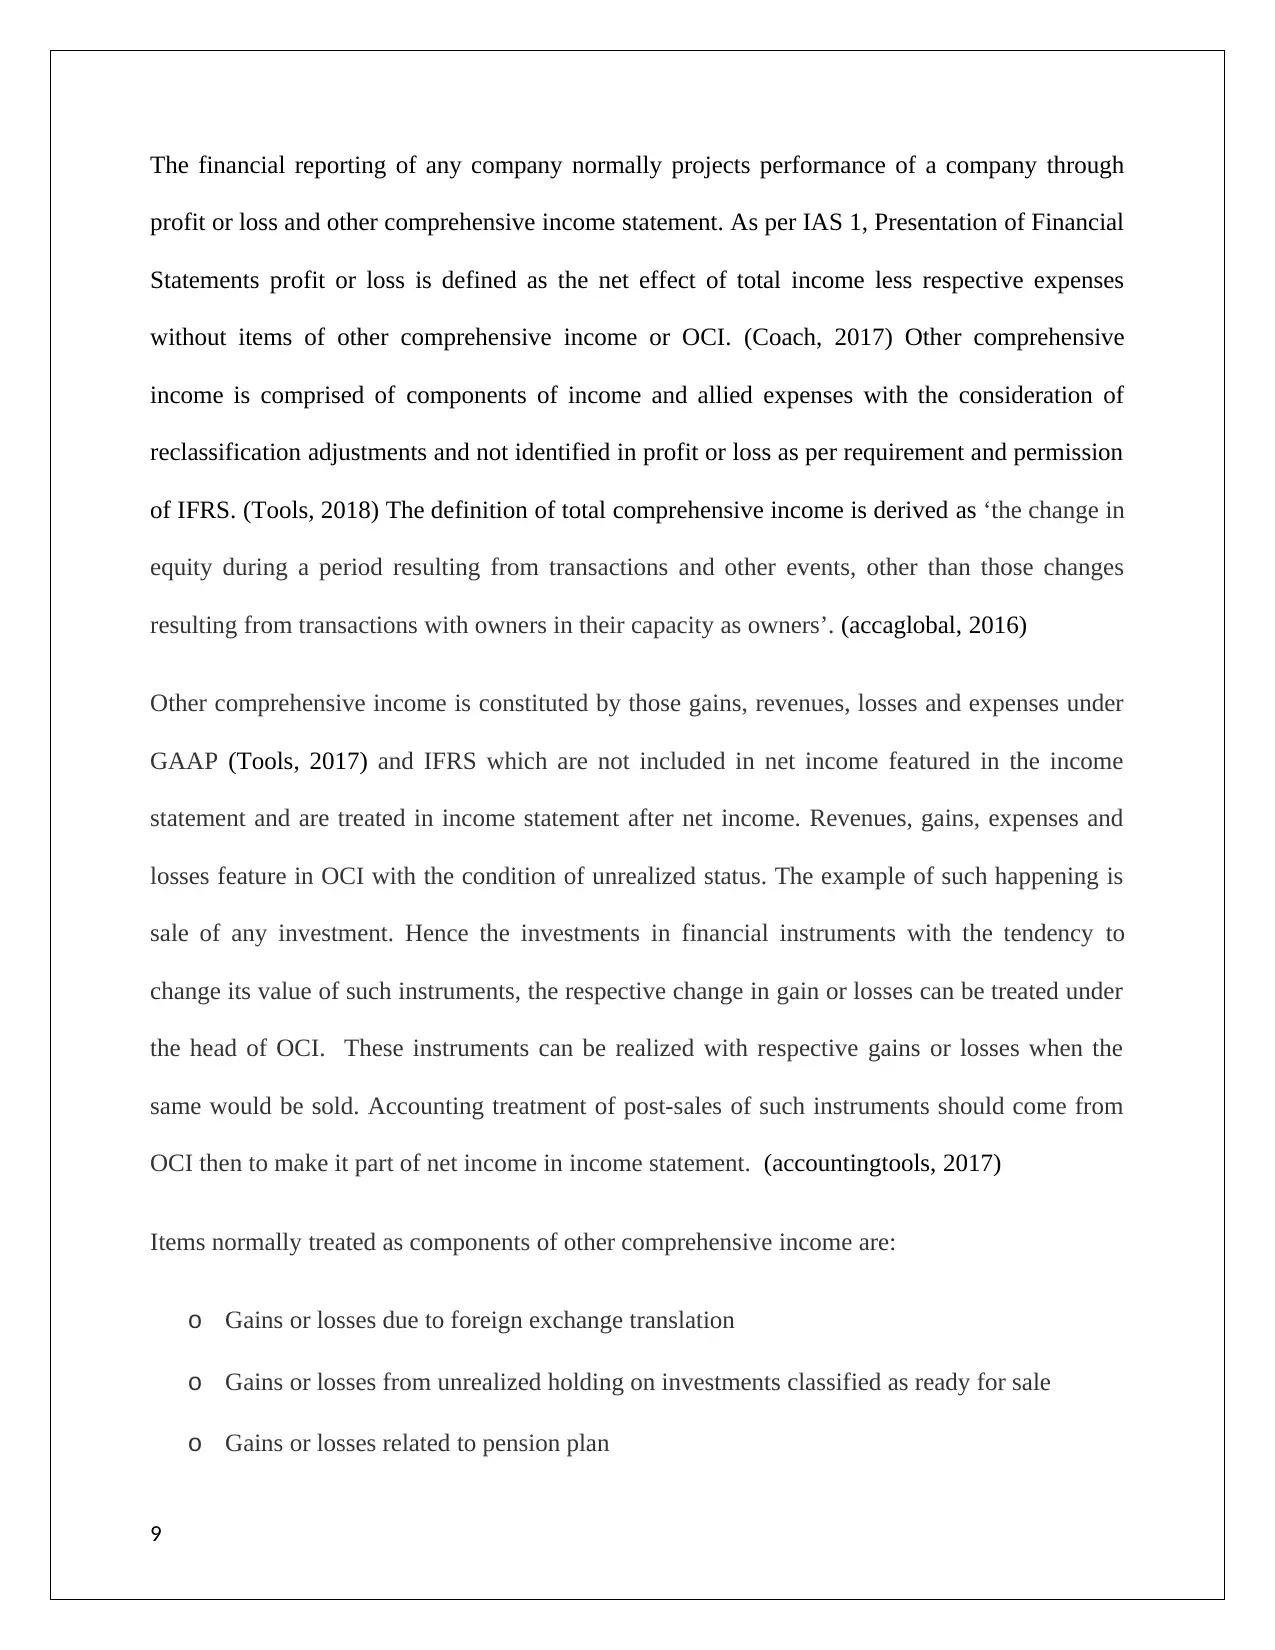
The financial reporting of any company normally projects performance of a company through
profit or loss and other comprehensive income statement. As per IAS 1, Presentation of Financial
Statements profit or loss is defined as the net effect of total income less respective expenses
without items of other comprehensive income or OCI. (Coach, 2017) Other comprehensive
income is comprised of components of income and allied expenses with the consideration of
reclassification adjustments and not identified in profit or loss as per requirement and permission
of IFRS. (Tools, 2018) The definition of total comprehensive income is derived as ‘the change in
equity during a period resulting from transactions and other events, other than those changes
resulting from transactions with owners in their capacity as owners’. (accaglobal, 2016)
Other comprehensive income is constituted by those gains, revenues, losses and expenses under
GAAP (Tools, 2017) and IFRS which are not included in net income featured in the income
statement and are treated in income statement after net income. Revenues, gains, expenses and
losses feature in OCI with the condition of unrealized status. The example of such happening is
sale of any investment. Hence the investments in financial instruments with the tendency to
change its value of such instruments, the respective change in gain or losses can be treated under
the head of OCI. These instruments can be realized with respective gains or losses when the
same would be sold. Accounting treatment of post-sales of such instruments should come from
OCI then to make it part of net income in income statement. (accountingtools, 2017)
Items normally treated as components of other comprehensive income are:
o Gains or losses due to foreign exchange translation
o Gains or losses from unrealized holding on investments classified as ready for sale
o Gains or losses related to pension plan
9
⊘ This is a preview!⊘
Do you want full access?
Subscribe today to unlock all pages.
Trusted by 1+ million students worldwide
o Prior service costs or credits for pension
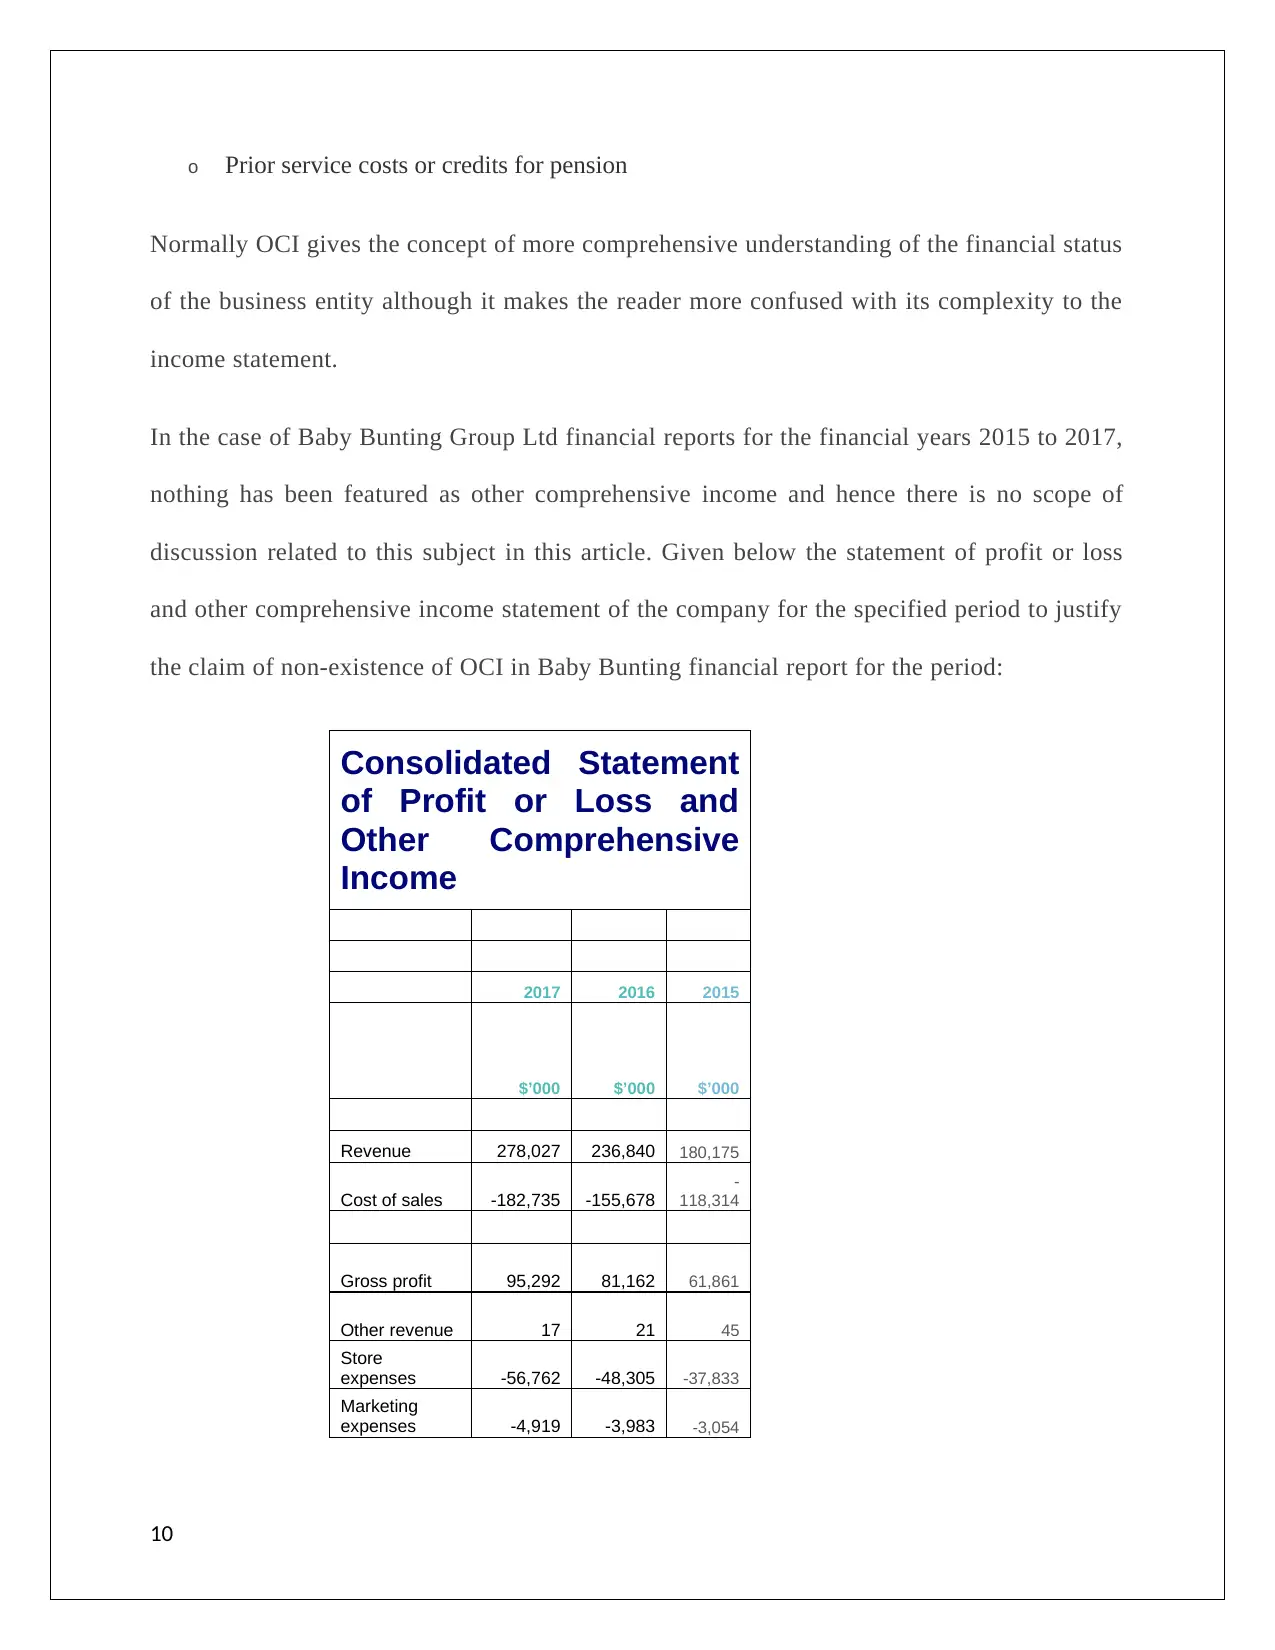
Normally OCI gives the concept of more comprehensive understanding of the financial status
of the business entity although it makes the reader more confused with its complexity to the
income statement.
In the case of Baby Bunting Group Ltd financial reports for the financial years 2015 to 2017,
nothing has been featured as other comprehensive income and hence there is no scope of
discussion related to this subject in this article. Given below the statement of profit or loss
and other comprehensive income statement of the company for the specified period to justify
the claim of non-existence of OCI in Baby Bunting financial report for the period:
Consolidated Statement
of Profit or Loss and
Other Comprehensive
Income
2017 2016 2015
$’000 $’000 $’000
Revenue 278,027 236,840 180,175
Cost of sales -182,735 -155,678
-
118,314
Gross profit 95,292 81,162 61,861
Other revenue 17 21 45
Store
expenses -56,762 -48,305 -37,833
Marketing
expenses -4,919 -3,983 -3,054
10
Paraphrase This Document
Need a fresh take? Get an instant paraphrase of this document with our AI Paraphraser
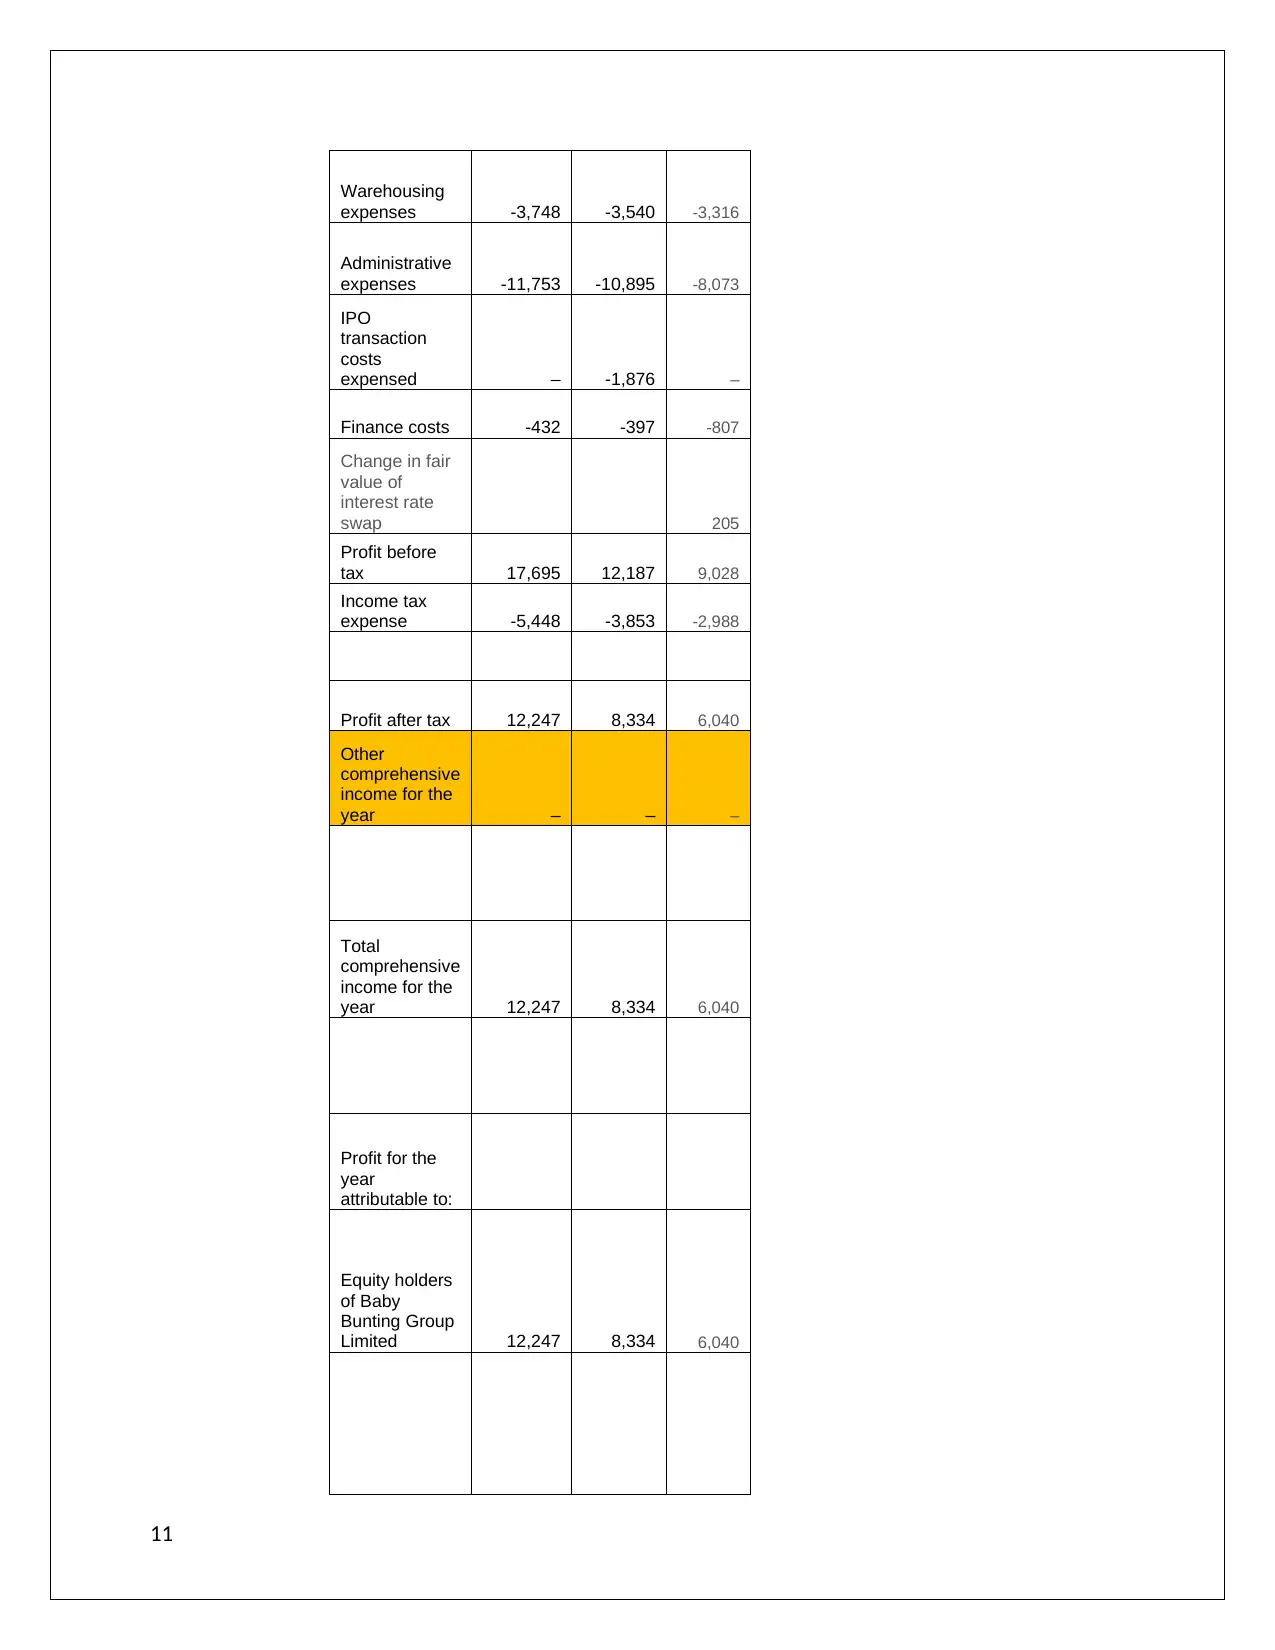
Warehousing
expenses -3,748 -3,540 -3,316
Administrative
expenses -11,753 -10,895 -8,073
IPO
transaction
costs
expensed – -1,876 –
Finance costs -432 -397 -807
Change in fair
value of
interest rate
swap 205
Profit before
tax 17,695 12,187 9,028
Income tax
expense -5,448 -3,853 -2,988
Profit after tax 12,247 8,334 6,040
Other
comprehensive
income for the
year – – –
Total
comprehensive
income for the
year 12,247 8,334 6,040
Profit for the
year
attributable to:
Equity holders
of Baby
Bunting Group
Limited 12,247 8,334 6,040
11
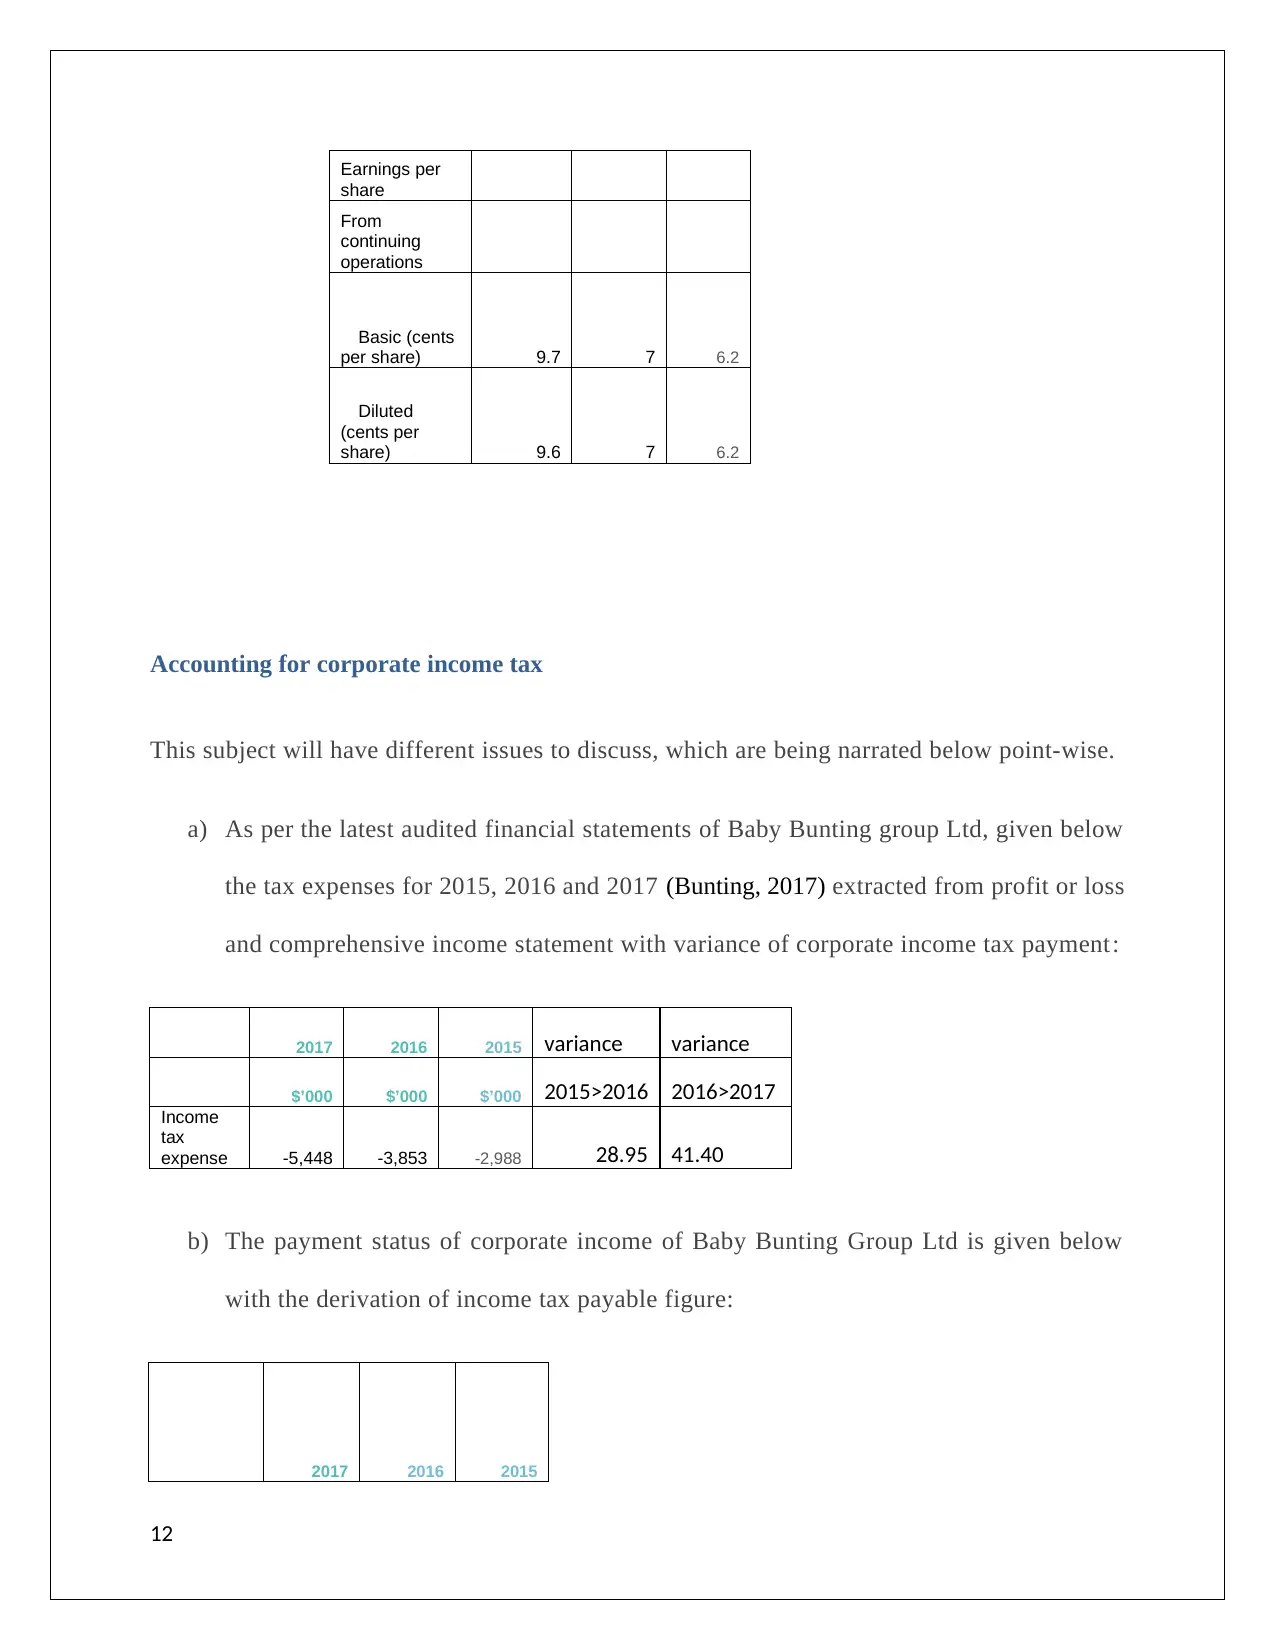
Earnings per
share
From
continuing
operations
Basic (cents
per share) 9.7 7 6.2
Diluted
(cents per
share) 9.6 7 6.2
Accounting for corporate income tax
This subject will have different issues to discuss, which are being narrated below point-wise.
a) As per the latest audited financial statements of Baby Bunting group Ltd, given below
the tax expenses for 2015, 2016 and 2017 (Bunting, 2017) extracted from profit or loss
and comprehensive income statement with variance of corporate income tax payment:
2017 2016 2015 variance variance
$’000 $’000 $’000 2015>2016 2016>2017
Income
tax
expense -5,448 -3,853 -2,988 28.95 41.40
b) The payment status of corporate income of Baby Bunting Group Ltd is given below
with the derivation of income tax payable figure:
2017 2016 2015
12
⊘ This is a preview!⊘
Do you want full access?
Subscribe today to unlock all pages.
Trusted by 1+ million students worldwide
1 out of 20
Related Documents


Your All-in-One AI-Powered Toolkit for Academic Success.
+13062052269
info@desklib.com
Available 24*7 on WhatsApp / Email
![[object Object]](/_next/static/media/star-bottom.7253800d.svg)
Unlock your academic potential
Copyright © 2020–2025 A2Z Services. All Rights Reserved. Developed and managed by ZUCOL.