Financial Analysis Report: Best World International Ltd Performance
VerifiedAdded on 2019/12/18
|21
|4662
|145
Report
AI Summary
This report provides a detailed analysis of Best World International Ltd's financial performance and operations. It includes an introduction to the company, its business activities, and its listing on the Singapore Stock Exchange. The report conducts horizontal and vertical analyses of the company's Profit and Loss (P&L) statements and balance sheets from 2011 to 2015, highlighting trends in revenue, expenses, assets, and liabilities. It also examines economic conditions in Singapore and their impact on the company. Furthermore, the report assesses profitability performance through ratio analysis, including gross profit margin, operating profit margin, and net profit margin. Dividend ratio analysis, solvency, liquidity, and efficiency ratio analyses are also conducted. The report concludes with an assessment of the impact of business news on the company, identification of the board of directors and their roles, and a comparison of net asset value per share with the current price level. The analysis reveals fluctuations in financial performance, with increases in revenue and net income, but also fluctuating trends in profitability and asset management, and recommends strategies for improvement.
Individual report analysing the
performance and operations of a public
listed company
performance and operations of a public
listed company
Paraphrase This Document
Need a fresh take? Get an instant paraphrase of this document with our AI Paraphraser
Table of Contents
SECTION A.....................................................................................................................................3
1 & 2. Selection of listed business organization and its introduction..........................................3
3. Horizontal and vertical analysis Best World International Ltd...............................................3
4. (A) Economic conditions.........................................................................................................8
B & C. Analysis of profitability performance.............................................................................8
5. Dividend ratio analysis..........................................................................................................11
6. Solvency and liquidity analysis.............................................................................................12
7. Efficiency ratio analysis........................................................................................................13
SECTION B...................................................................................................................................14
1 & 2 Assessing the impact of business news on Best World International Ltd.......................14
3. Identifying the team of Board of Directors and their roles....................................................14
4. Comparing net asset value per share from current price level...............................................16
CONCLUSION..............................................................................................................................17
REFERENCES..............................................................................................................................18
APPENDIX....................................................................................................................................20
SECTION A
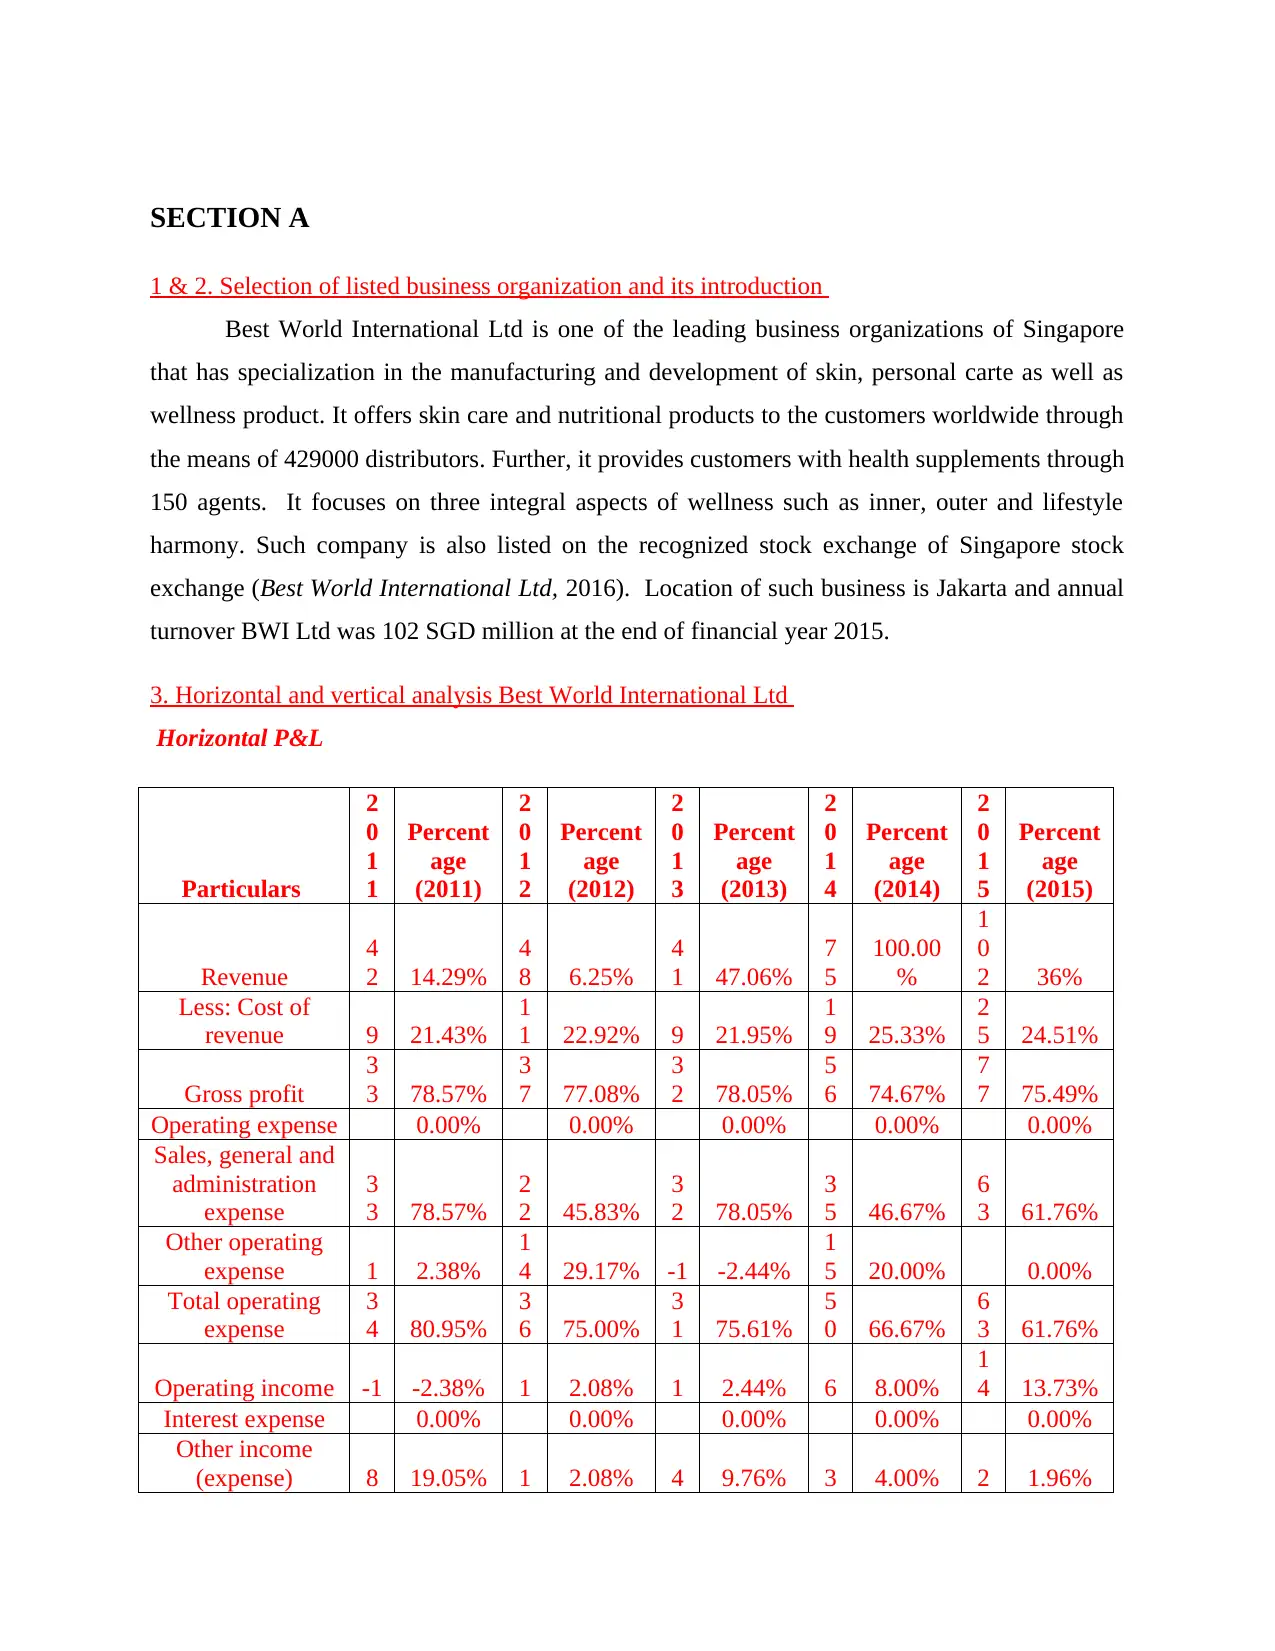
1 & 2. Selection of listed business organization and its introduction
Best World International Ltd is one of the leading business organizations of Singapore
that has specialization in the manufacturing and development of skin, personal carte as well as
wellness product. It offers skin care and nutritional products to the customers worldwide through
the means of 429000 distributors. Further, it provides customers with health supplements through
150 agents. It focuses on three integral aspects of wellness such as inner, outer and lifestyle
harmony. Such company is also listed on the recognized stock exchange of Singapore stock
exchange (Best World International Ltd, 2016). Location of such business is Jakarta and annual
turnover BWI Ltd was 102 SGD million at the end of financial year 2015.
3. Horizontal and vertical analysis Best World International Ltd
Horizontal P&L
Particulars
2
0
1
1
Percent
age
(2011)
2
0
1
2
Percent
age
(2012)
2
0
1
3
Percent
age
(2013)
2
0
1
4
Percent
age
(2014)
2
0
1
5
Percent
age
(2015)
Revenue
4
2 14.29%
4
8 6.25%
4
1 47.06%
7
5
100.00
%
1
0
2 36%
Less: Cost of
revenue 9 21.43%
1
1 22.92% 9 21.95%
1
9 25.33%
2
5 24.51%
Gross profit
3
3 78.57%
3
7 77.08%
3
2 78.05%
5
6 74.67%
7
7 75.49%
Operating expense 0.00% 0.00% 0.00% 0.00% 0.00%
Sales, general and
administration
expense
3
3 78.57%
2
2 45.83%
3
2 78.05%
3
5 46.67%
6
3 61.76%
Other operating
expense 1 2.38%
1
4 29.17% -1 -2.44%
1
5 20.00% 0.00%
Total operating
expense
3
4 80.95%
3
6 75.00%
3
1 75.61%
5
0 66.67%
6
3 61.76%
Operating income -1 -2.38% 1 2.08% 1 2.44% 6 8.00%
1
4 13.73%
Interest expense 0.00% 0.00% 0.00% 0.00% 0.00%
Other income
(expense) 8 19.05% 1 2.08% 4 9.76% 3 4.00% 2 1.96%
⊘ This is a preview!⊘
Do you want full access?
Subscribe today to unlock all pages.
Trusted by 1+ million students worldwide
Income before
taxation 0.00% 2 4.17% 2 4.88% 6 8.00%
1
7 16.67%
provision for
income taxes 0.00% 1 2.08% 1 2.44% 2 2.67% 8 7.84%
Net income from
continuing
operations 0 0.00% 2 4.17% 1 2.44% 4 5.33% 9 8.82%
Other 0.00% 0.00% 0.00% 0.00% 1 0.98%
Net income 0 0.00% 2 4.00% 1 2.44% 4 5.33%
1
0 9.80%
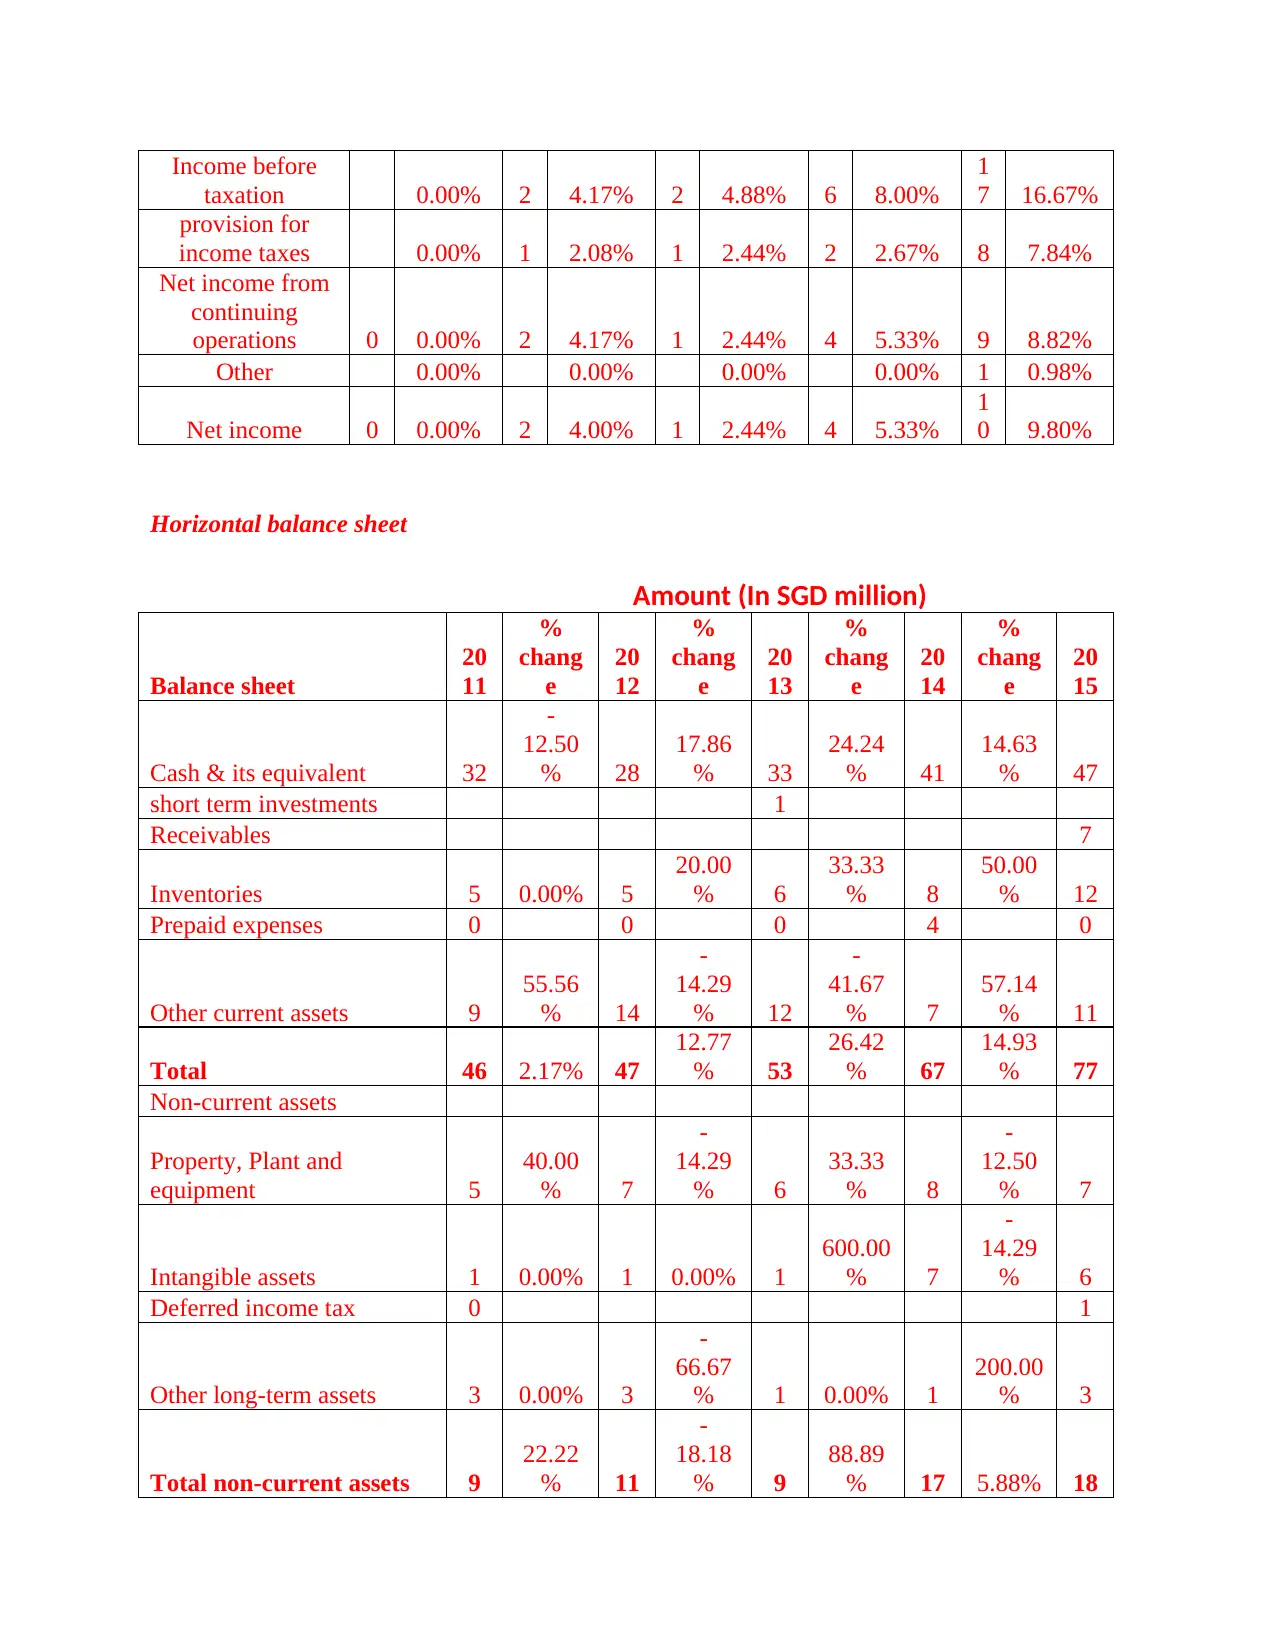
Horizontal balance sheet
Amount (In SGD million)
Balance sheet
20
11
%
chang
e
20
12
%
chang
e
20
13
%
chang
e
20
14
%
chang
e
20
15
Cash & its equivalent 32
-
12.50
% 28
17.86
% 33
24.24
% 41
14.63
% 47
short term investments 1
Receivables 7
Inventories 5 0.00% 5
20.00
% 6
33.33
% 8
50.00
% 12
Prepaid expenses 0 0 0 4 0
Other current assets 9
55.56
% 14
-
14.29
% 12
-
41.67
% 7
57.14
% 11
Total 46 2.17% 47
12.77
% 53
26.42
% 67
14.93
% 77
Non-current assets
Property, Plant and
equipment 5
40.00
% 7
-
14.29
% 6
33.33
% 8
-
12.50
% 7
Intangible assets 1 0.00% 1 0.00% 1
600.00
% 7
-
14.29
% 6
Deferred income tax 0 1
Other long-term assets 3 0.00% 3
-
66.67
% 1 0.00% 1
200.00
% 3
Total non-current assets 9
22.22
% 11
-
18.18
% 9
88.89
% 17 5.88% 18
taxation 0.00% 2 4.17% 2 4.88% 6 8.00%
1
7 16.67%
provision for
income taxes 0.00% 1 2.08% 1 2.44% 2 2.67% 8 7.84%
Net income from
continuing
operations 0 0.00% 2 4.17% 1 2.44% 4 5.33% 9 8.82%
Other 0.00% 0.00% 0.00% 0.00% 1 0.98%
Net income 0 0.00% 2 4.00% 1 2.44% 4 5.33%
1
0 9.80%
Horizontal balance sheet
Amount (In SGD million)
Balance sheet
20
11
%
chang
e
20
12
%
chang
e
20
13
%
chang
e
20
14
%
chang
e
20
15
Cash & its equivalent 32
-
12.50
% 28
17.86
% 33
24.24
% 41
14.63
% 47
short term investments 1
Receivables 7
Inventories 5 0.00% 5
20.00
% 6
33.33
% 8
50.00
% 12
Prepaid expenses 0 0 0 4 0
Other current assets 9
55.56
% 14
-
14.29
% 12
-
41.67
% 7
57.14
% 11
Total 46 2.17% 47
12.77
% 53
26.42
% 67
14.93
% 77
Non-current assets
Property, Plant and
equipment 5
40.00
% 7
-
14.29
% 6
33.33
% 8
-
12.50
% 7
Intangible assets 1 0.00% 1 0.00% 1
600.00
% 7
-
14.29
% 6
Deferred income tax 0 1
Other long-term assets 3 0.00% 3
-
66.67
% 1 0.00% 1
200.00
% 3
Total non-current assets 9
22.22
% 11
-
18.18
% 9
88.89
% 17 5.88% 18
Paraphrase This Document
Need a fresh take? Get an instant paraphrase of this document with our AI Paraphraser
Total assets 55 5.45% 58 6.90% 62
35.48
% 84
11.90
% 94
Current liabilities
Accounts payable 7
-
100.00
% 0 14 7.14% 15
Taxes payable 1 0.00% 1 0.00% 1
400.00
% 5
Other current liabilities 10
20.00
% 12
-
16.67
% 10 0.00% 10
Total current liabilities 7
57.14
% 11
18.18
% 13
92.31
% 25
20.00
% 30
Non-current liabilities
Deferred tax liabilities 0 0 0 2 2
Minority interest -1 0 -1
100.00
% -2
Other long-term liabilities 1 0 0 1
-
100.00
%
Total non-current
liabilities 0 0 0 2
-
100.00
% 0
Stockholders’ equity
Common stock 21
Retained earnings 31 0.00% 31 0.00% 31 9.68% 34
23.53
% 42
Accumulated other reserves 17 0.00% 17
11.76
% 19
21.05
% 23
-
91.30
% 2
Total stockholders’ equity 48 0.00% 48 2.08% 49
14.29
% 56
14.29
% 64
Total liabilities &
stockholders’ equity 56 3.57% 58 6.90% 62
35.48
% 84
11.90
% 94
Vertical analysis of P&L
Amount (In SGD million)
2
0
1
1
Percent
age
(2011)
2
0
1
2
Percent
age
(2012)
2
0
1
3
Percent
age
(2013)
2
0
1
4
Percent
age
(2014)
2
0
1
5
Percent
age
(2015)
Revenue
3
1
100.00
%
3
1
100.00
%
3
0
100.00
%
1
8
100.00
%
1
7
100.00
%
35.48
% 84
11.90
% 94
Current liabilities
Accounts payable 7
-
100.00
% 0 14 7.14% 15
Taxes payable 1 0.00% 1 0.00% 1
400.00
% 5
Other current liabilities 10
20.00
% 12
-
16.67
% 10 0.00% 10
Total current liabilities 7
57.14
% 11
18.18
% 13
92.31
% 25
20.00
% 30
Non-current liabilities
Deferred tax liabilities 0 0 0 2 2
Minority interest -1 0 -1
100.00
% -2
Other long-term liabilities 1 0 0 1
-
100.00
%
Total non-current
liabilities 0 0 0 2
-
100.00
% 0
Stockholders’ equity
Common stock 21
Retained earnings 31 0.00% 31 0.00% 31 9.68% 34
23.53
% 42
Accumulated other reserves 17 0.00% 17
11.76
% 19
21.05
% 23
-
91.30
% 2
Total stockholders’ equity 48 0.00% 48 2.08% 49
14.29
% 56
14.29
% 64
Total liabilities &
stockholders’ equity 56 3.57% 58 6.90% 62
35.48
% 84
11.90
% 94
Vertical analysis of P&L
Amount (In SGD million)
2
0
1
1
Percent
age
(2011)
2
0
1
2
Percent
age
(2012)
2
0
1
3
Percent
age
(2013)
2
0
1
4
Percent
age
(2014)
2
0
1
5
Percent
age
(2015)
Revenue
3
1
100.00
%
3
1
100.00
%
3
0
100.00
%
1
8
100.00
%
1
7
100.00
%
Less: Cost of
revenue
1
9 61.29%
1
9 61.29%
1
8 60.00%
1
1 61.11%
1
0 58.82%
Gross profit
1
2 38.71%
1
2 38.71%
1
2 40.00% 7 38.89% 7 41.18%
Operating expenes 0.00% 0.00% 0.00% 0.00% 0.00%
Sales, general and
administration
expense 9 29.03%
1
0 32.26%
1
2 40.00% 9 50.00% 9 52.94%
Other operating
expense 0 0.00% -7 -22.58% 0 0.00% -8 -44.44% 0 0.00%
Total operating
expense 9 29.03% 3 9.68%
1
2 40.00% 1 5.56% 9 52.94%
Operating income 2 6.45% 9 29.03% 0 0.00% 6 33.33% -2 -11.76%
Interest expense 0 0.00% 0 0.00% 0 0.00% 2 11.11% 2 11.76%
Other income
(expense) 8 25.81% 1 3.23% 4 13.33% 3 16.67% 2 11.76%
Income before
taxation
1
1 35.48%
1
0 32.26% 4 13.33% 9 50.00% 0 0.00%
provision for
income taxes 0 0.00% 1 3.23% 1 3.33% 0 0.00% 0 0.00%
Net income from
continuing
operations
1
1 35.48% 9 29.03% 3 10.00% 9 50.00% 0 0.00%
Other 0 0.00% 0 0.00% 1 3.33% 2 11.11% 2 11.76%
Net income 9 29.03%
1
0 4.00% 4 13.33% 8 44.44% 0 0.00%
Vertical analysis of Balance sheet
Balance sheet
2
0
1
1
Percent
age
(2011)
2
0
1
2
Percent
age
(2012)
2
0
1
3
Percent
age
(2013)
2
0
1
4
Percent
age
(2014)
2
0
1
5
Percent
age
(2015)
Cash & its
equivalent
3
2 57.14%
2
8 48.28%
3
3 53.23%
4
1 48.81% 8 8.51%
Receivables 0 0.00% 0 0.00% 0 0.00% 0 0.00% 7 7.45%
Inventories 5 8.93% 5 8.62% 6 9.68% 8 9.52%
1
2 12.77%
Prepaid expenses 0 0.00% 0 0.00% 0 0.00% 4 4.76% 0 0.00%
Other current
assets 9 16.07%
1
4 24.14%
1
2 19.35% 7 8.33%
1
1 11.70%
Total
4
6 82.14%
4
7 81.03%
5
3 85.48%
6
7 79.76%
7
7 81.91%
Non-current 0.00% 0.00% 0.00% 0.00% 0.00%
⊘ This is a preview!⊘
Do you want full access?
Subscribe today to unlock all pages.
Trusted by 1+ million students worldwide
assets
Property, Plant
and equipment 5 8.93% 7 12.07% 6 9.68% 8 9.52% 7 7.45%
Intangible assets 1 1.79% 1 1.72% 1 1.61% 7 8.33% 6 6.38%
Deferred income
tax 0 0.00% 0 0.00% 0 0.00% 0 0.00% 1 1.06%
Other long-term
assets 3 5.36% 3 5.17% 1 1.61% 1 1.19% 3 3.19%
Total non-
current assets 9 16.07%
1
1 18.97% 9 14.52%
1
7 20.24%
1
8 19.15%
Total assets
5
6
100.00
%
5
8
100.00
%
6
2
100.00
%
8
4
100.00
%
9
4
100.00
%
Current
liabilities 0.00% 0.00% 0.00% 0.00% 0.00%
Accounts payable 7 12.50% 0 0.00% 0 0.00%
1
4 16.67%
1
5 15.96%
Taxes payable 0 0.00% 1 1.72% 1 1.61% 1 1.19% 5 5.32%
Other current
liabilities 0 0.00%
1
0 17.24%
1
2 19.35%
1
0 11.90%
1
0 10.64%
Total current
liabilities 0.00%
1
0 17.24%
1
3 20.97%
2
5 29.76%
3
0 31.91%
Non-current
liabilties 0.00% 0.00% 0.00% 0.00% 0.00%
Deferred tax
liabilities 0 0.00% 0 0.00% 0 0.00% 2 2.38% 2 2.13%
Minority interest -1 -1.79% 0 0.00% 0 0.00% -1 -1.19% -2 -2.13%
Other long-term
liabilities 1 1.79% 0 0.00% 0 0.00% 1 1.19% 0 0.00%
Total non-
current liabilities 0 0.00% 0 0.00% 0 0.00% 2 2.38% 0 0.00%
Stockholders’
equity 0.00% 0.00% 0.00% 0.00% 0.00%
Common stock 0 0.00% 0 0.00% 0 0.00% 0 0.00%
2
1 22.34%
Retained earnings
3
1 55.36%
3
1 53.45%
3
1 50.00%
3
4 40.48%
4
2 44.68%
Accumulated
other reserves
1
7 30.36%
1
7 29.31%
1
9 30.65%
2
3 27.38% 2 2.13%
Total
stockholders’
equity
4
8 85.71%
4
8 82.76%
4
9 79.03%
5
6 66.67%
6
4 68.09%
Total liabilities
& stockholders’
equity
5
6
100.00
%
5
8
100.00
%
6
2
100.00
%
8
4
100.00
%
9
4
100.00
%
Paraphrase This Document
Need a fresh take? Get an instant paraphrase of this document with our AI Paraphraser
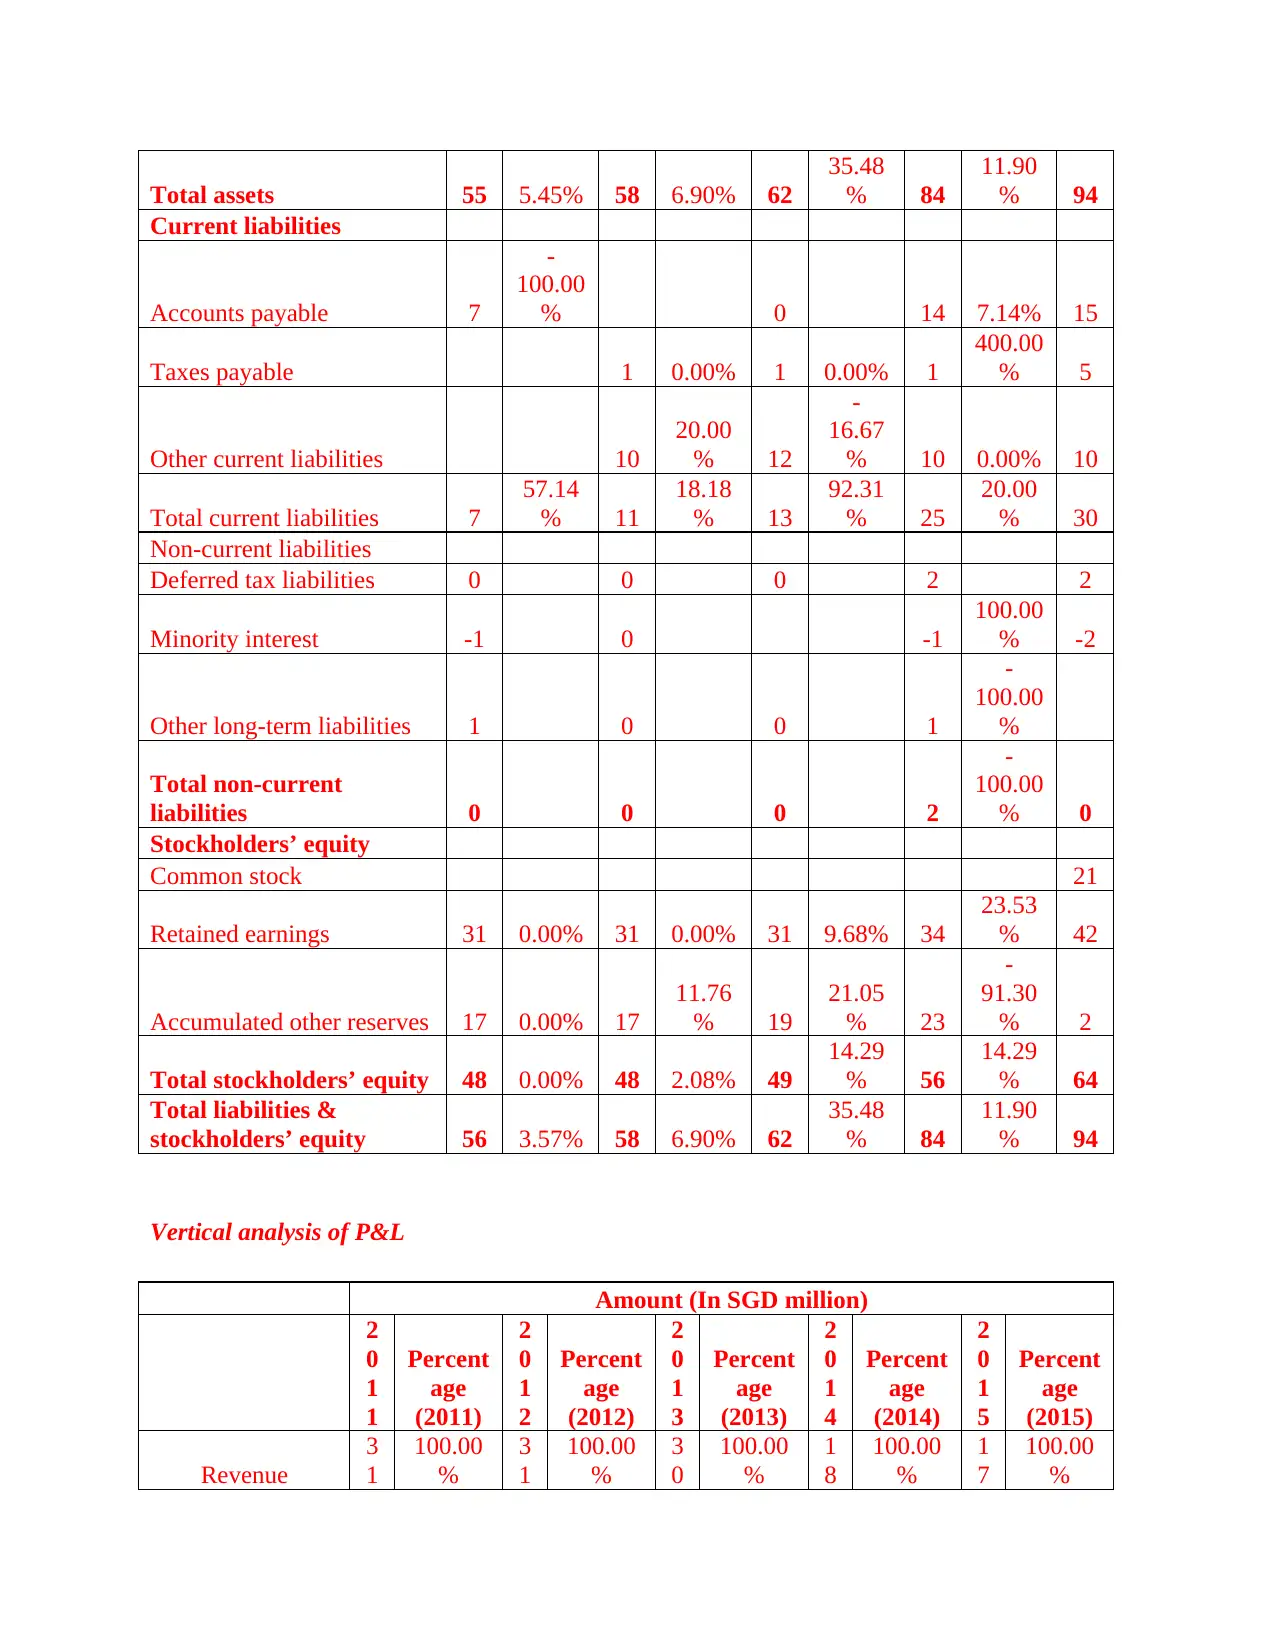
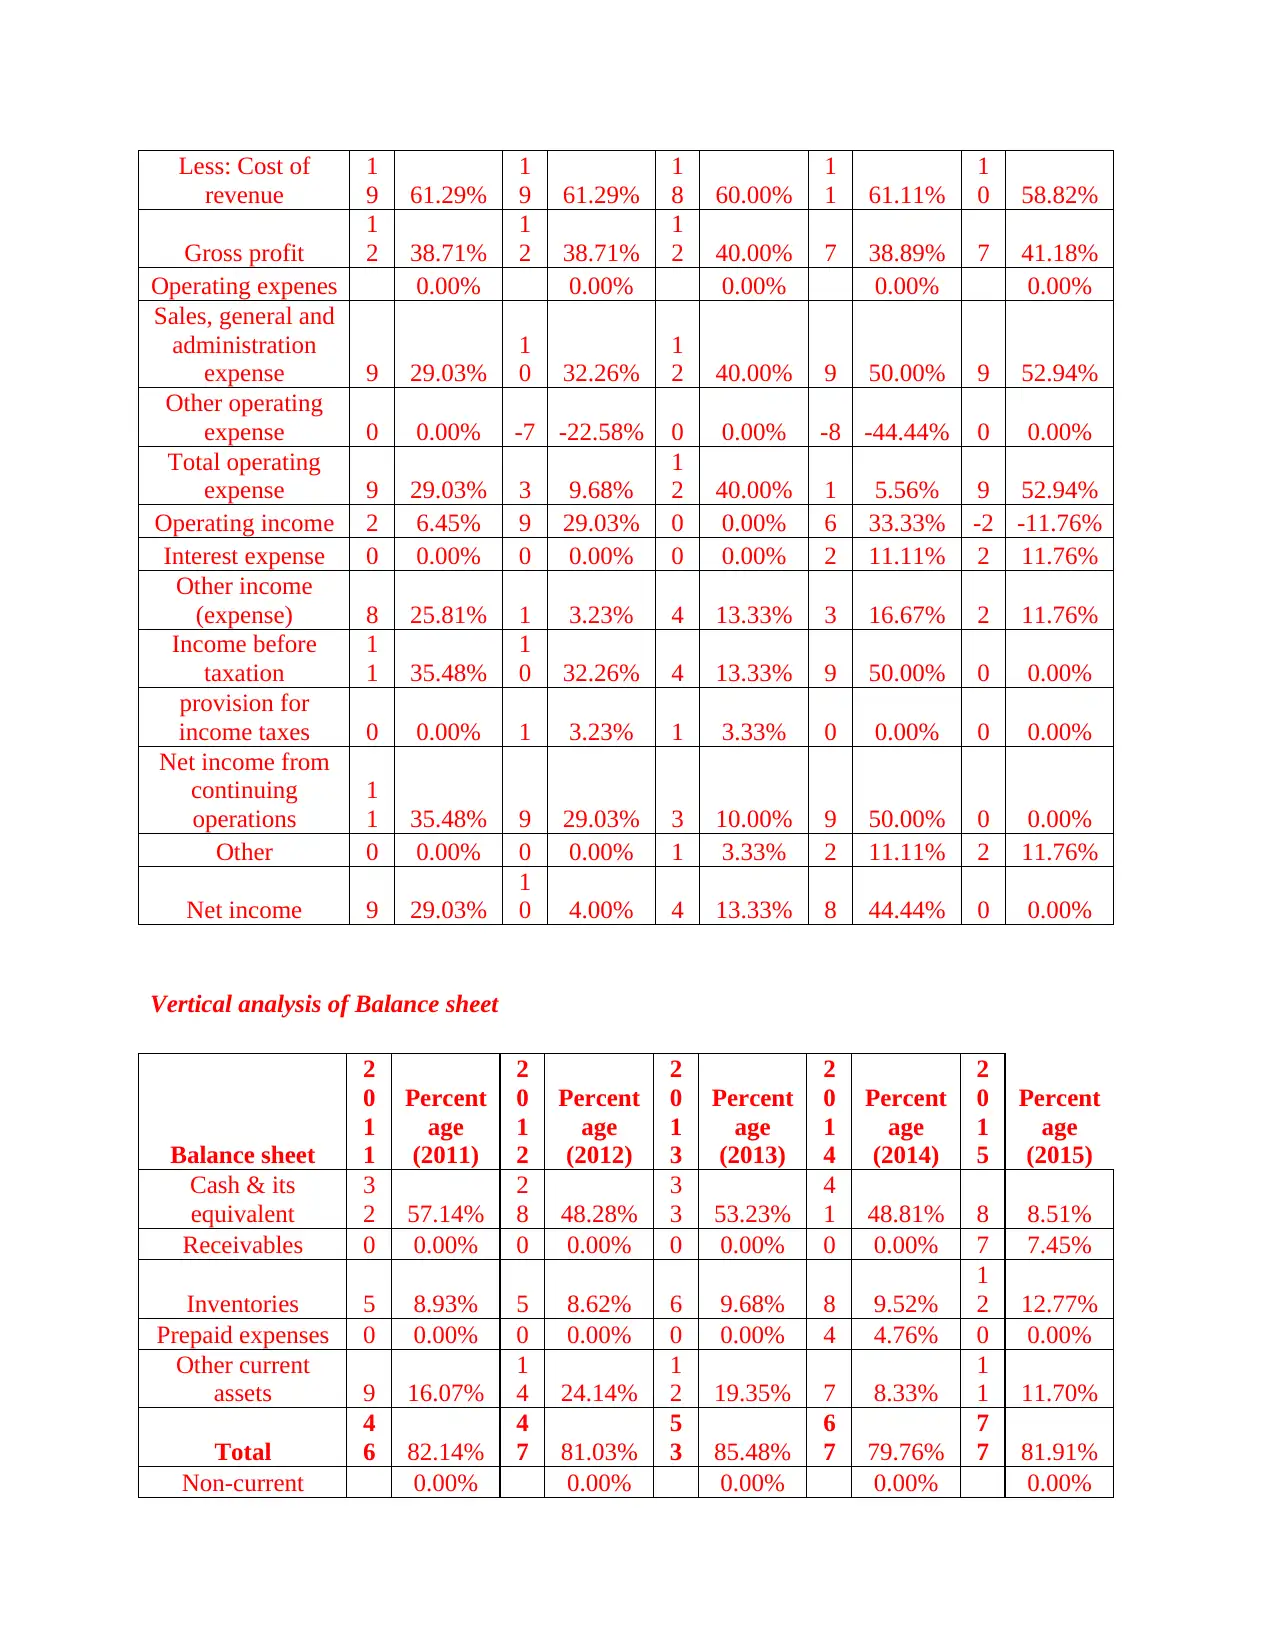
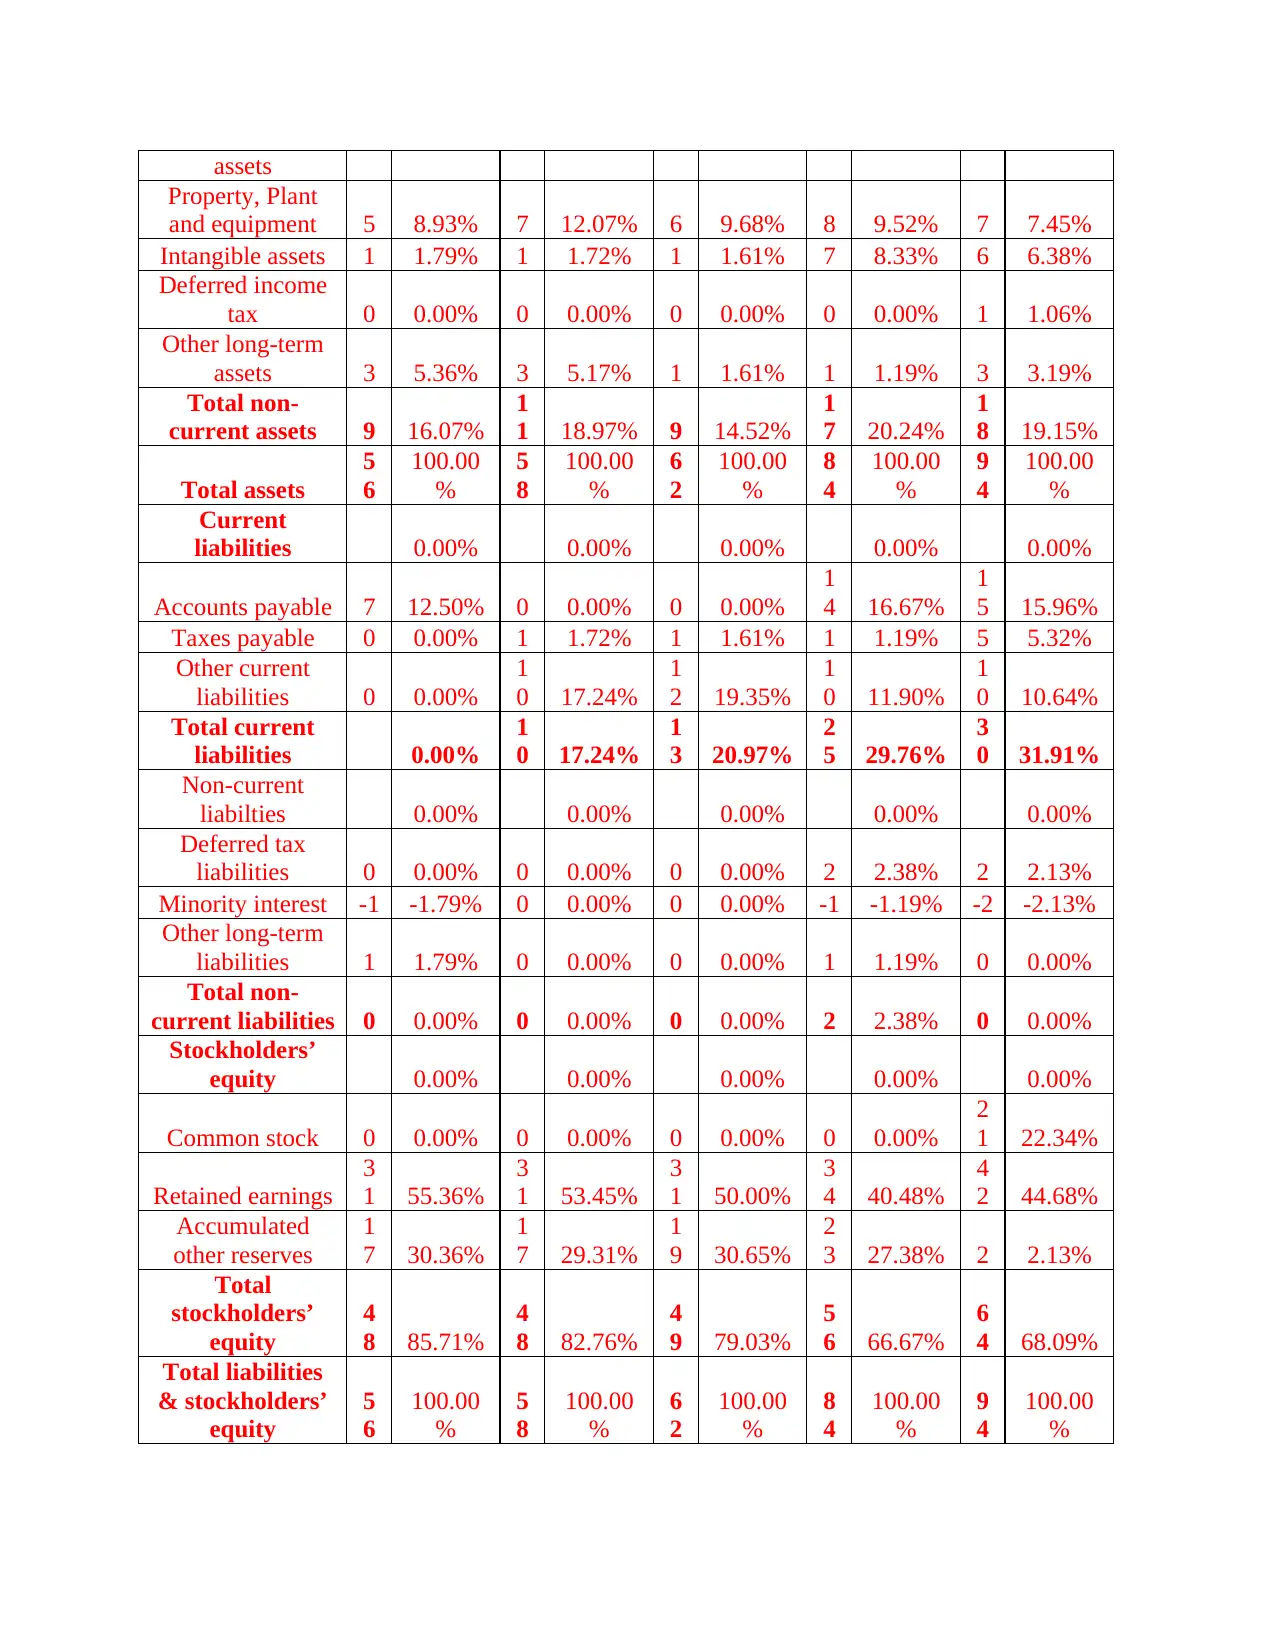
The above presented table shows that sales revenue of firm increased from 14.29% to
36%. On the other side, gross and net profitability aspect of firm is showing fluctuating trend in
the financial performance level. Net income level of firm increased from 2% to 9% at the end of
2015. Hence, by considering such aspects it can be said that Best World International Ltd was
increased significantly during such period. Hence, by taking into consideration such aspect it
can be said that firm is performing its business activities and functions more effectively and
efficiently. Along with this, trend of expenses also increased over the years. On the other side,
cash position of firm is also fluctuating which shows that business unit failed to generate enough
fund during such period. Further, position of total asset also decreased from 35.48% to 11.90%.
Hence, it shows that business unit failed to maintain total assets at the end of 2015 more
effectually. In contrast to this, position of total liabilities also increased from 3.57% to 11.90%.
Thus, business unit needs to frame effectual strategies and policies which in turn help it
improving the financial position and performance.
4. (A) Economic conditions
In the present time, Singapore is recognized as one of the most stable and developed
country of the world. Such country leads in GDP, per capita income as well as high purchasing
power parity. Laws and legislation which are introduced by the legal authority of Singapore is
highly favorable. Employment level of Singapore is every high such as 98% which shows that
economic condition of the country is good. In this, favorable economic condition entails that
spending level of Singapore people is very high. Further, now people are highly conscious in
relation to their beauty aspect and prefer to spend more on skin or beauty care products (Brigham
and Houston, 2012). By considering this, it can be said that economic condition of Singapore
will aid in the profit margin of Best World International Ltd.
B & C. Analysis of profitability performance
Ratio analysis of Best World International Ltd from 2011 to2015 is as follows:
1 2 3 4 5
72.00%
73.00%
74.00%
75.00%
76.00%
77.00%
78.00%
79.00%
GP ratio
GP ratio
72.00%
73.00%
74.00%
75.00%
76.00%
77.00%
78.00%
79.00%
GP ratio
GP ratio
⊘ This is a preview!⊘
Do you want full access?
Subscribe today to unlock all pages.
Trusted by 1+ million students worldwide
1 2 3 4 5
0.00%
2.00%
4.00%
6.00%
8.00%
10.00%
12.00%
NP ratio
NP ratio
1 2 3 4 5
-2
0
2
4
6
8
10
12
14
16
Operating profit margin
Operating profit margin
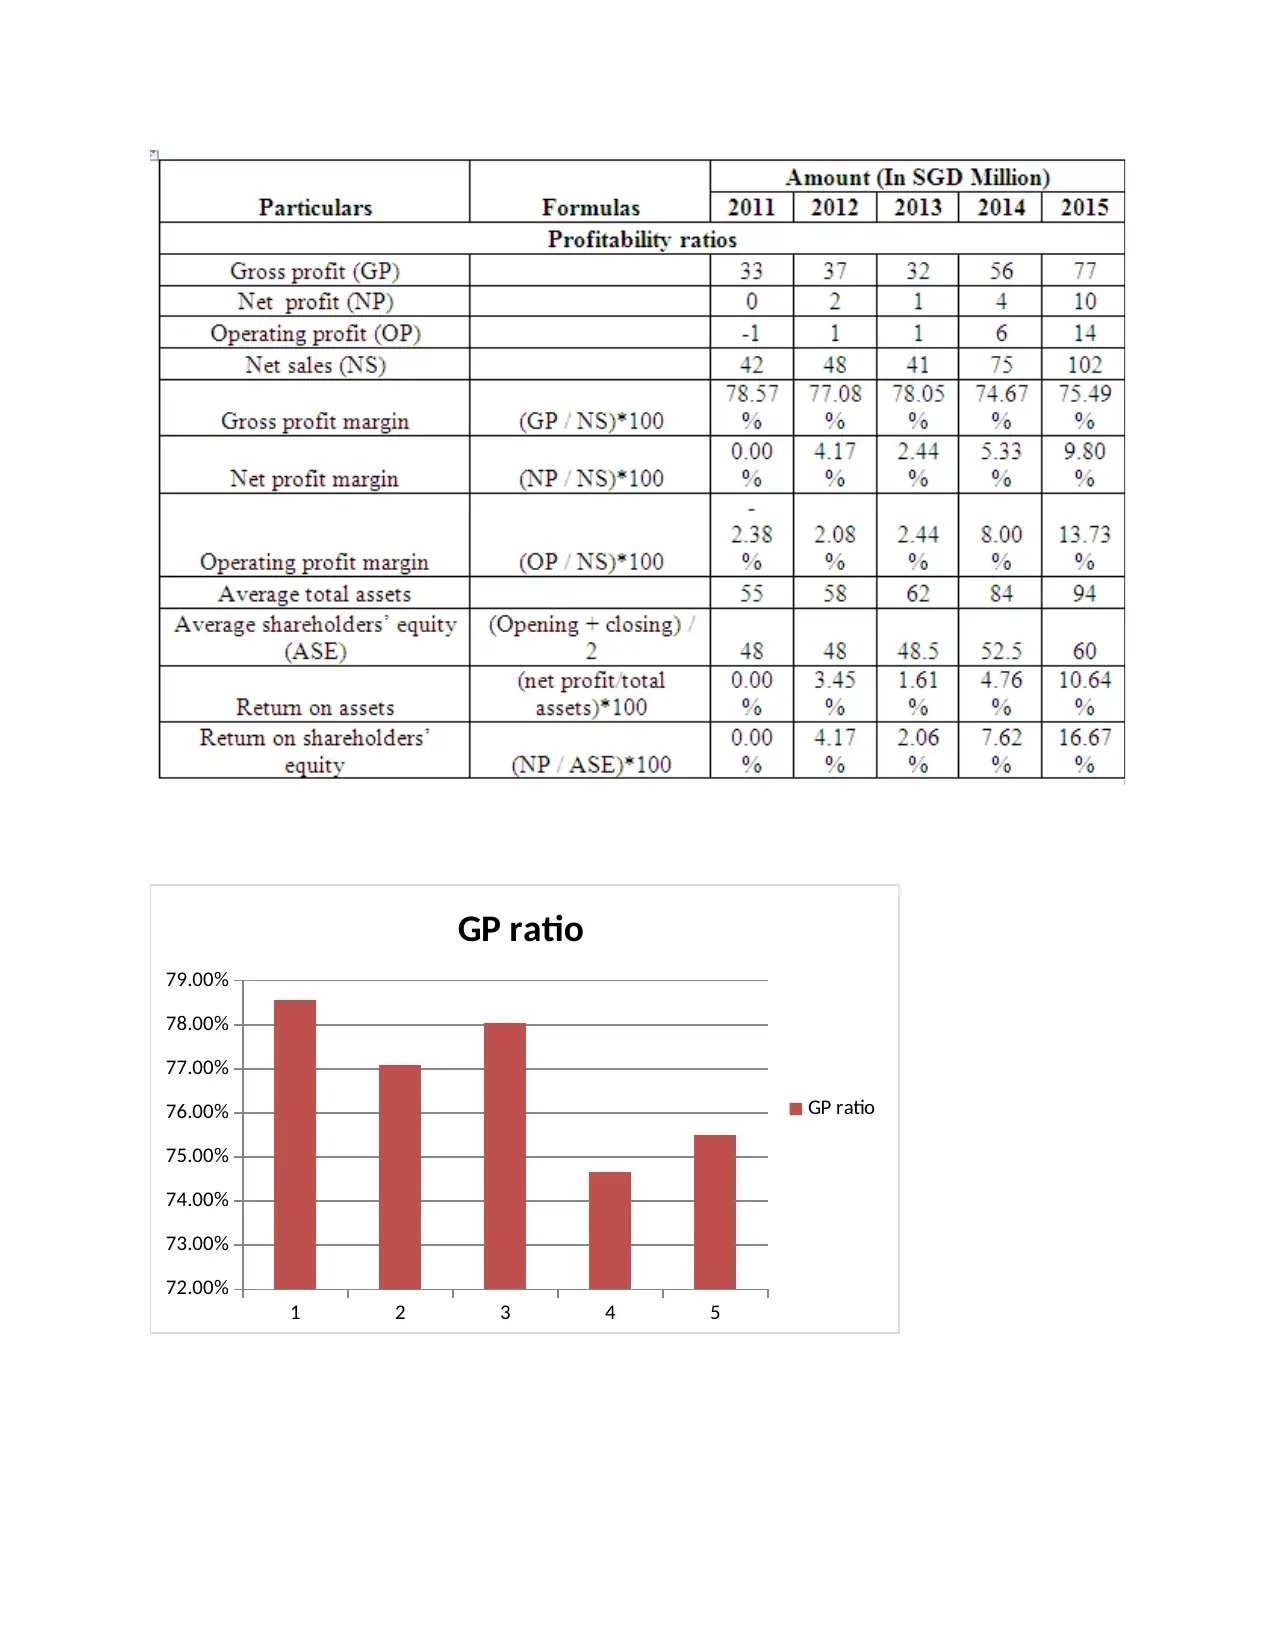
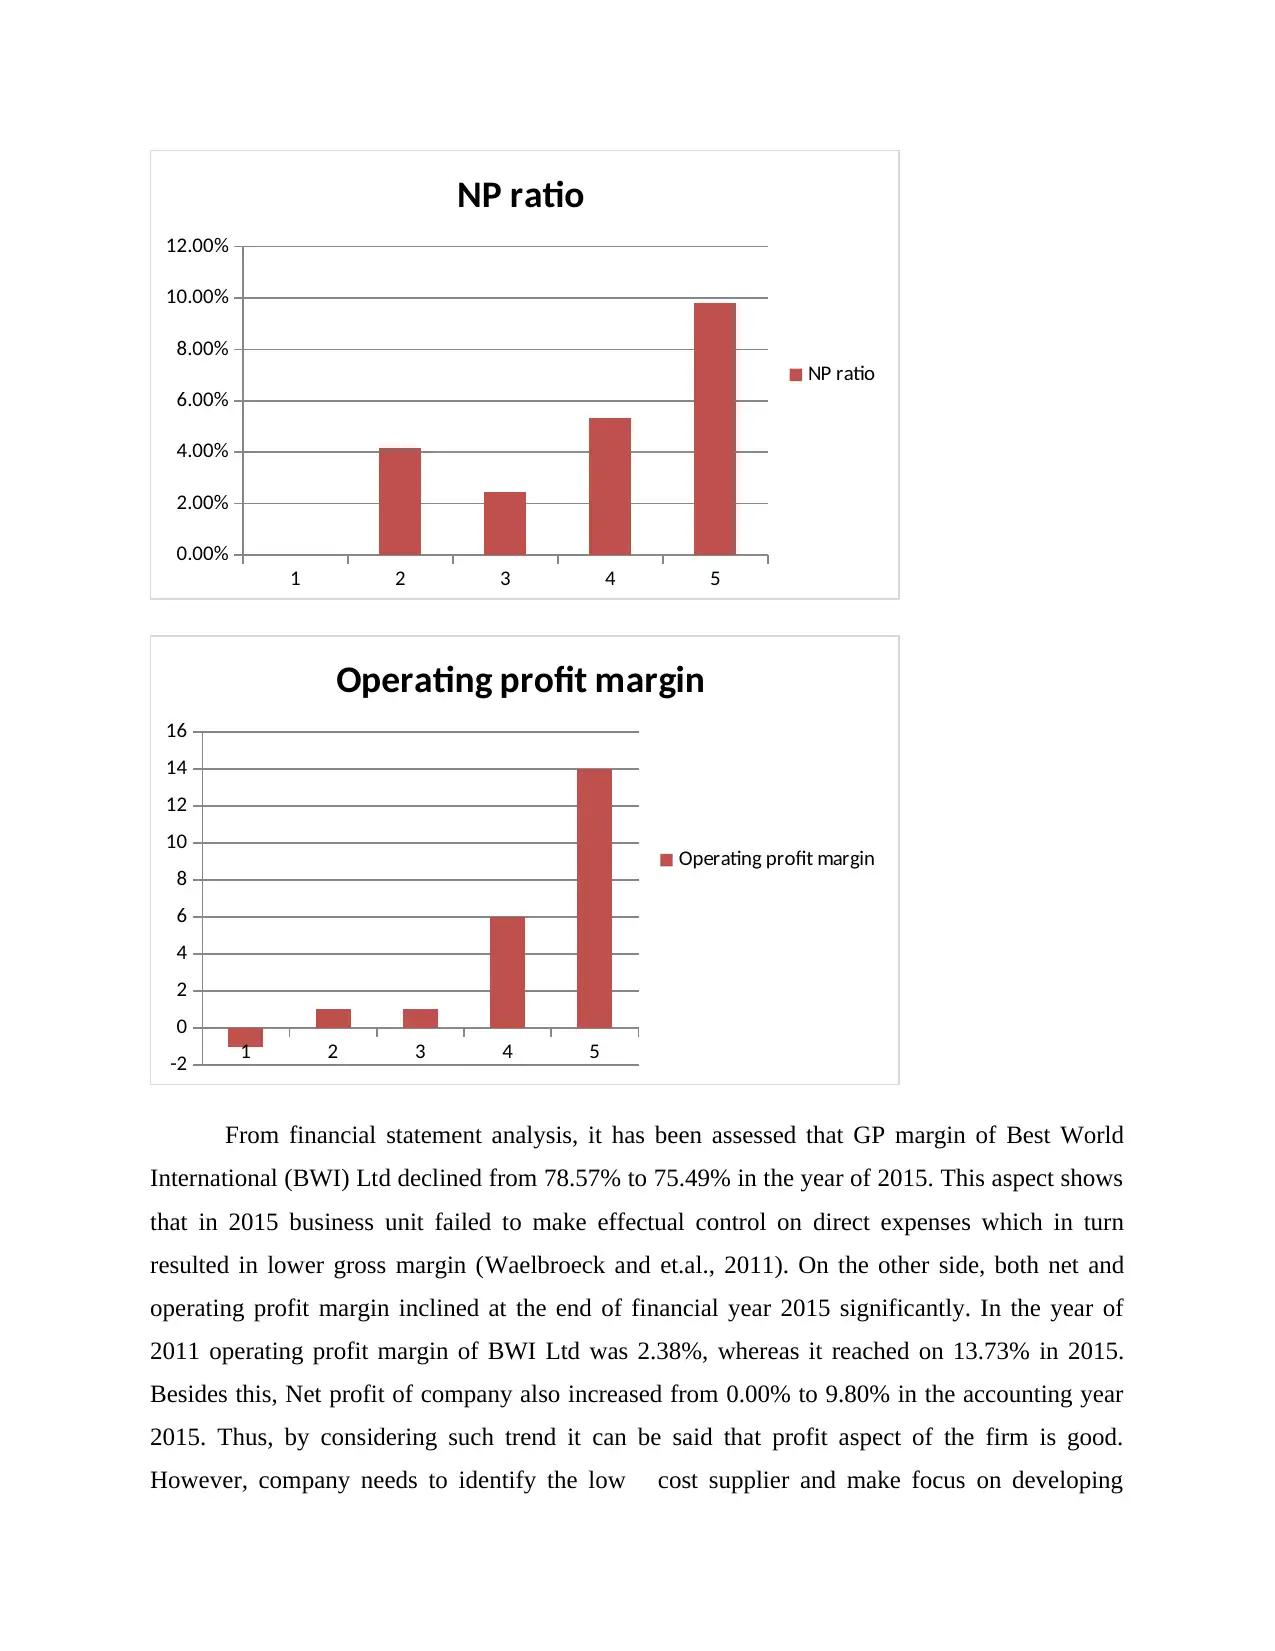
From financial statement analysis, it has been assessed that GP margin of Best World
International (BWI) Ltd declined from 78.57% to 75.49% in the year of 2015. This aspect shows
that in 2015 business unit failed to make effectual control on direct expenses which in turn
resulted in lower gross margin (Waelbroeck and et.al., 2011). On the other side, both net and
operating profit margin inclined at the end of financial year 2015 significantly. In the year of
2011 operating profit margin of BWI Ltd was 2.38%, whereas it reached on 13.73% in 2015.
Besides this, Net profit of company also increased from 0.00% to 9.80% in the accounting year
2015. Thus, by considering such trend it can be said that profit aspect of the firm is good.
However, company needs to identify the low cost supplier and make focus on developing
0.00%
2.00%
4.00%
6.00%
8.00%
10.00%
12.00%
NP ratio
NP ratio
1 2 3 4 5
-2
0
2
4
6
8
10
12
14
16
Operating profit margin
Operating profit margin
From financial statement analysis, it has been assessed that GP margin of Best World
International (BWI) Ltd declined from 78.57% to 75.49% in the year of 2015. This aspect shows
that in 2015 business unit failed to make effectual control on direct expenses which in turn
resulted in lower gross margin (Waelbroeck and et.al., 2011). On the other side, both net and
operating profit margin inclined at the end of financial year 2015 significantly. In the year of
2011 operating profit margin of BWI Ltd was 2.38%, whereas it reached on 13.73% in 2015.
Besides this, Net profit of company also increased from 0.00% to 9.80% in the accounting year
2015. Thus, by considering such trend it can be said that profit aspect of the firm is good.
However, company needs to identify the low cost supplier and make focus on developing
Paraphrase This Document
Need a fresh take? Get an instant paraphrase of this document with our AI Paraphraser
competent framework ((Brigham and Daves, 2012). By this, BWI Ltd can make significant
improvement in gross profit margin.
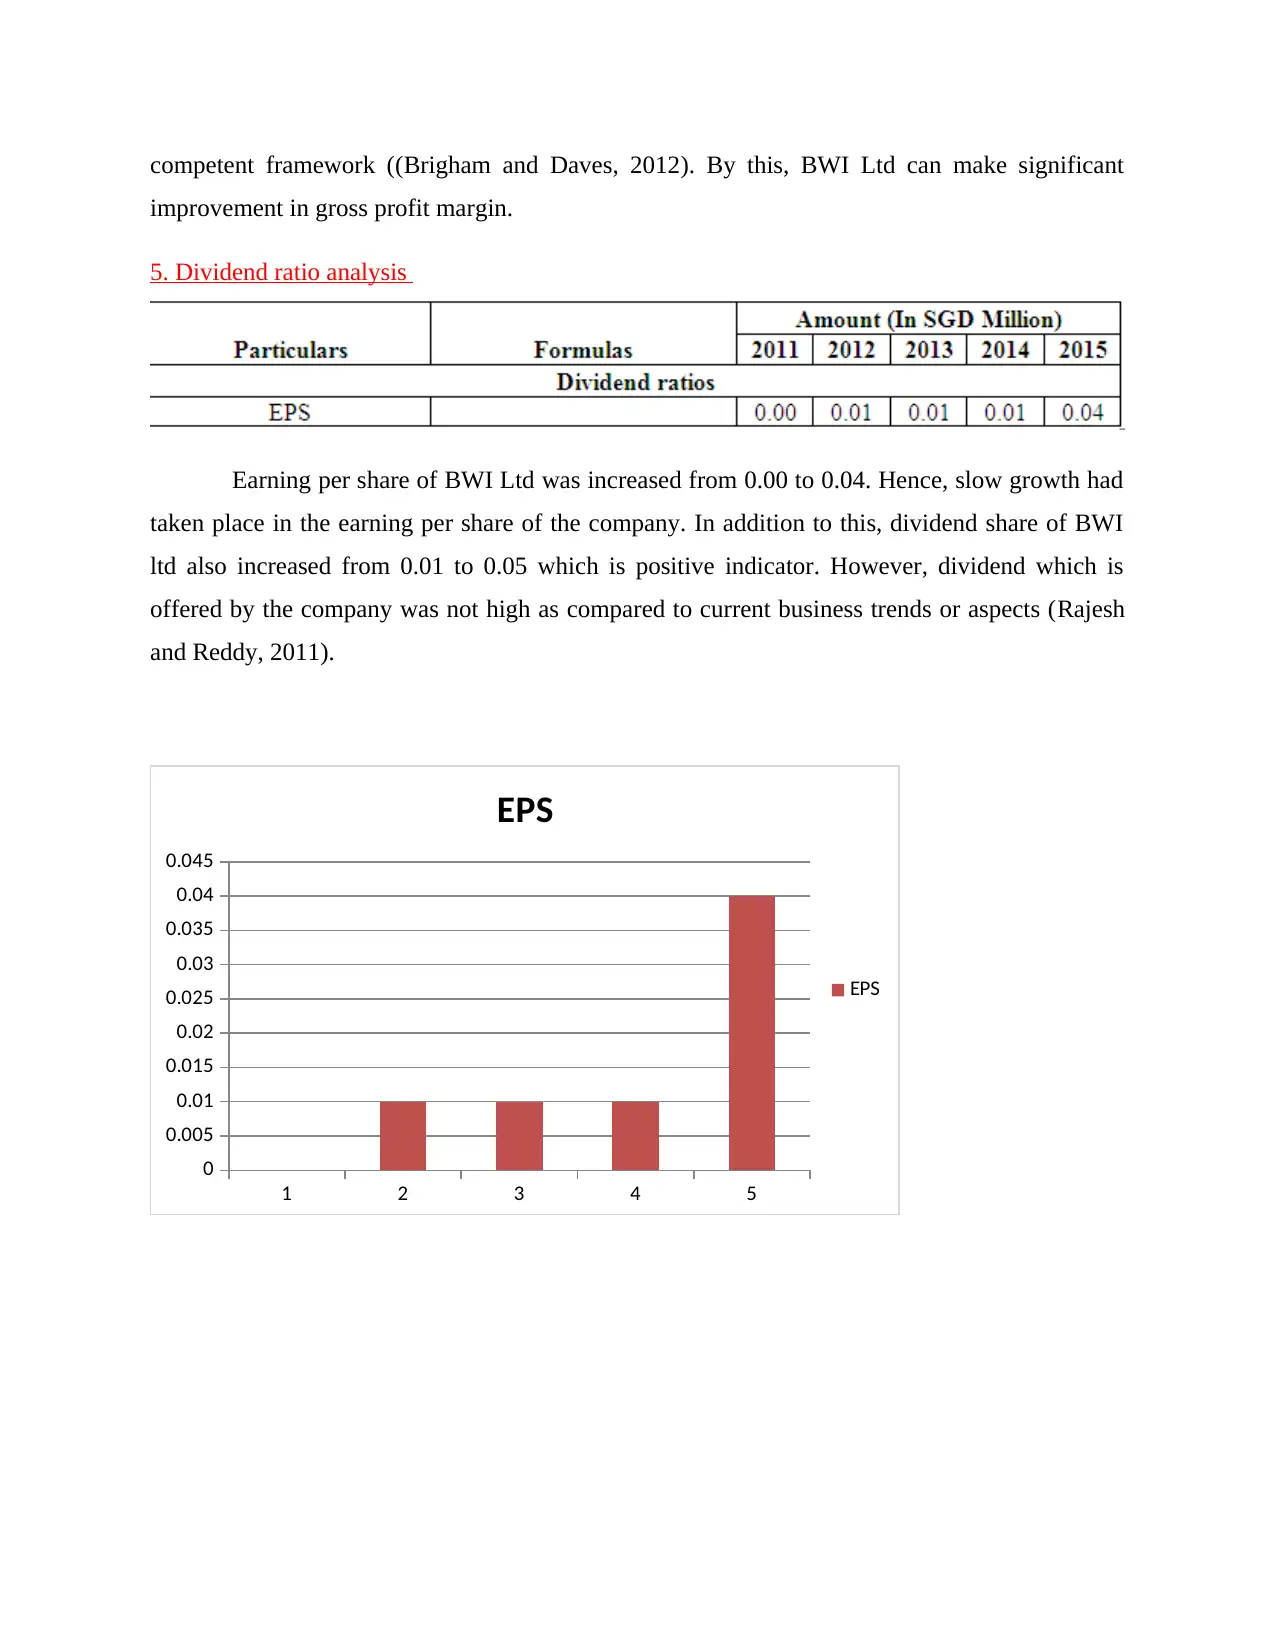
5. Dividend ratio analysis
Earning per share of BWI Ltd was increased from 0.00 to 0.04. Hence, slow growth had
taken place in the earning per share of the company. In addition to this, dividend share of BWI
ltd also increased from 0.01 to 0.05 which is positive indicator. However, dividend which is
offered by the company was not high as compared to current business trends or aspects (Rajesh
and Reddy, 2011).
1 2 3 4 5
0
0.005
0.01
0.015
0.02
0.025
0.03
0.035
0.04
0.045
EPS
EPS
improvement in gross profit margin.
5. Dividend ratio analysis
Earning per share of BWI Ltd was increased from 0.00 to 0.04. Hence, slow growth had
taken place in the earning per share of the company. In addition to this, dividend share of BWI
ltd also increased from 0.01 to 0.05 which is positive indicator. However, dividend which is
offered by the company was not high as compared to current business trends or aspects (Rajesh
and Reddy, 2011).
1 2 3 4 5
0
0.005
0.01
0.015
0.02
0.025
0.03
0.035
0.04
0.045
EPS
EPS
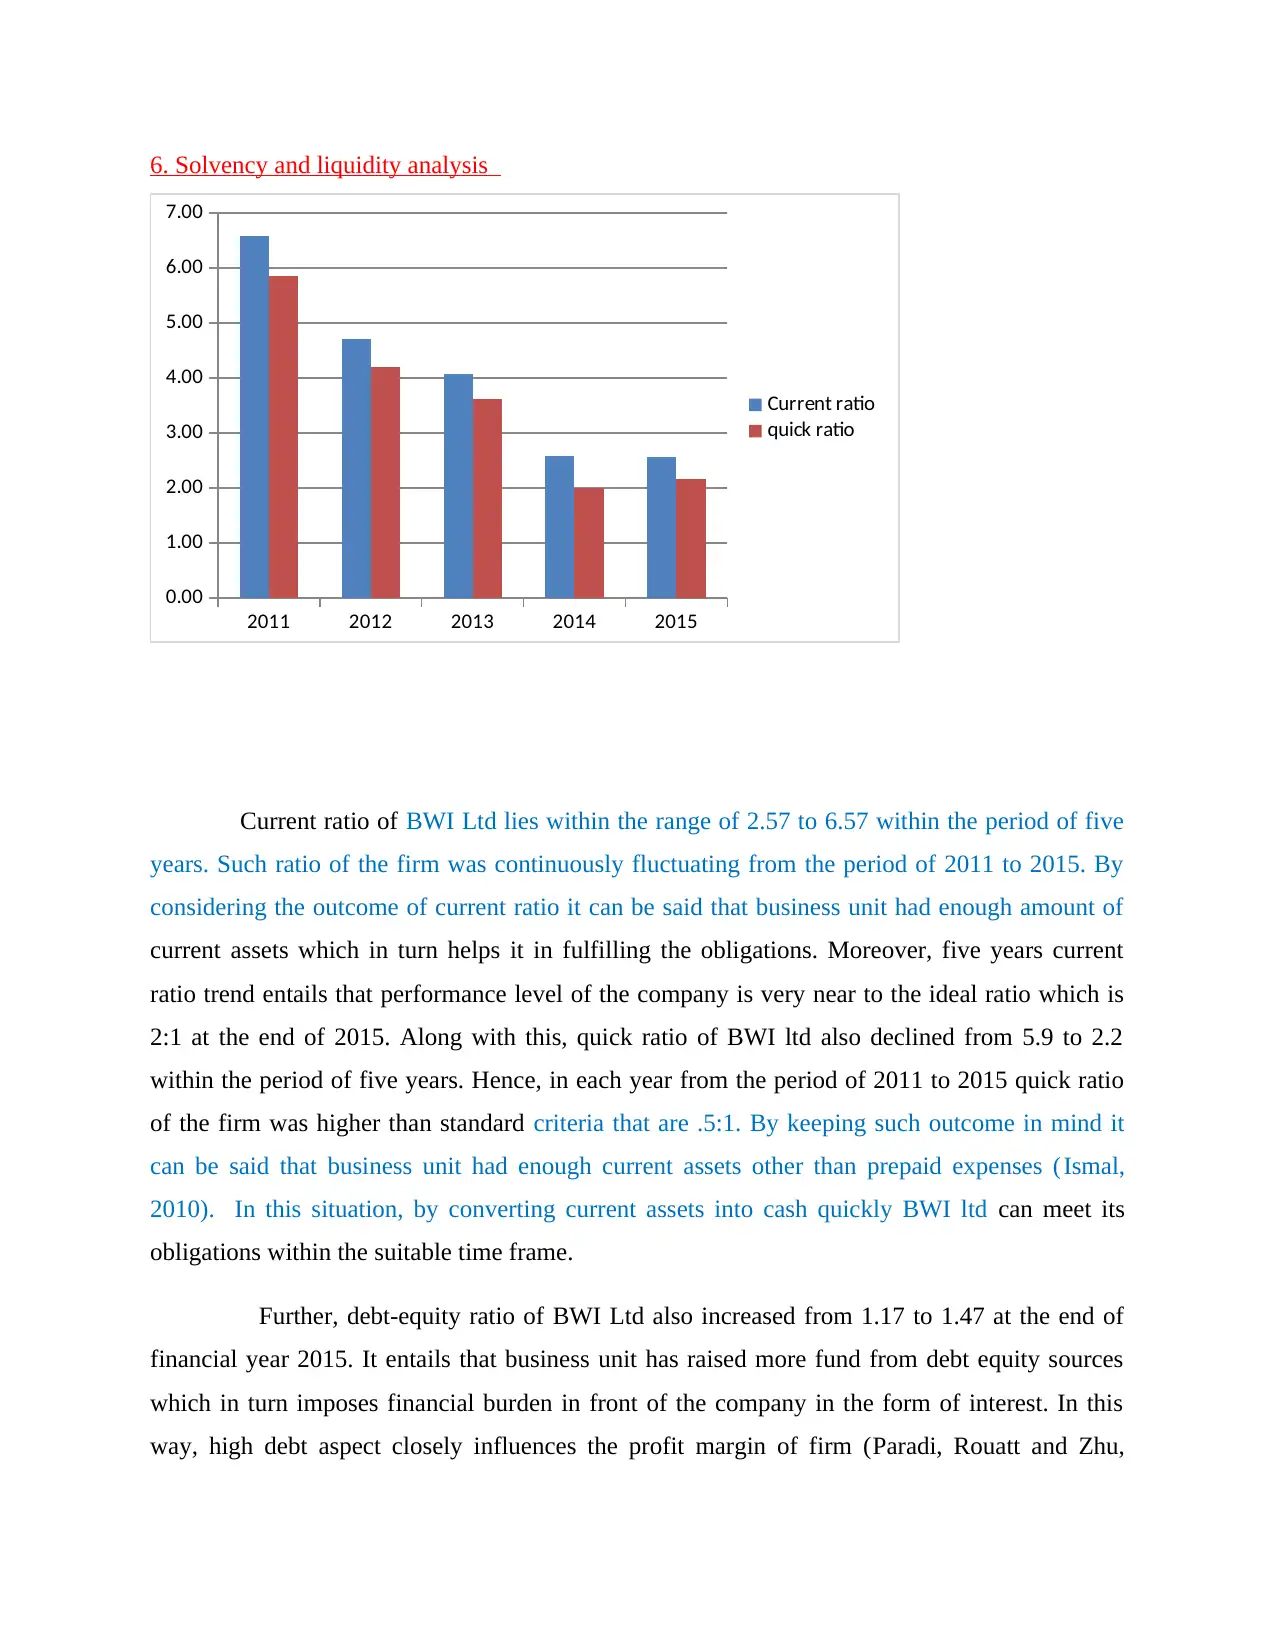
6. Solvency and liquidity analysis
2011 2012 2013 2014 2015
0.00
1.00
2.00
3.00
4.00
5.00
6.00
7.00
Current ratio
quick ratio
Current ratio of BWI Ltd lies within the range of 2.57 to 6.57 within the period of five
years. Such ratio of the firm was continuously fluctuating from the period of 2011 to 2015. By
considering the outcome of current ratio it can be said that business unit had enough amount of
current assets which in turn helps it in fulfilling the obligations. Moreover, five years current
ratio trend entails that performance level of the company is very near to the ideal ratio which is
2:1 at the end of 2015. Along with this, quick ratio of BWI ltd also declined from 5.9 to 2.2
within the period of five years. Hence, in each year from the period of 2011 to 2015 quick ratio
of the firm was higher than standard criteria that are .5:1. By keeping such outcome in mind it
can be said that business unit had enough current assets other than prepaid expenses (Ismal,
2010). In this situation, by converting current assets into cash quickly BWI ltd can meet its
obligations within the suitable time frame.
Further, debt-equity ratio of BWI Ltd also increased from 1.17 to 1.47 at the end of
financial year 2015. It entails that business unit has raised more fund from debt equity sources
which in turn imposes financial burden in front of the company in the form of interest. In this
way, high debt aspect closely influences the profit margin of firm (Paradi, Rouatt and Zhu,
⊘ This is a preview!⊘
Do you want full access?
Subscribe today to unlock all pages.
Trusted by 1+ million students worldwide
1 out of 21
Your All-in-One AI-Powered Toolkit for Academic Success.
+13062052269
info@desklib.com
Available 24*7 on WhatsApp / Email
![[object Object]](/_next/static/media/star-bottom.7253800d.svg)
Unlock your academic potential
Copyright © 2020–2025 A2Z Services. All Rights Reserved. Developed and managed by ZUCOL.