Financial Statement Analysis Capstone
Added on 2020-10-23
26 Pages6862 Words169 Views
FINANCIAL STATEMENT
ANALYSIS CAPSTONE
ANALYSIS CAPSTONE

Table of Contents
INTRODUCTION...........................................................................................................................3
MAIN BODY...................................................................................................................................3
Forecasting.............................................................................................................................3
Sales Growth..........................................................................................................................3
Forecasting ATO ( Asset turnover ).......................................................................................5
Forecasting Profit margin (PM).............................................................................................6
Calculate Free Cash flow (NOPAT- Change in NOA ).........................................................7
Dividend Payout ratio.............................................................................................................7
Calculation of net payment to debt holders............................................................................8
Forecast cost of debt and debt balance...................................................................................9
Calculation of comprehensive income.................................................................................10
Calculation of equity............................................................................................................10
Dividend policy....................................................................................................................11
Net cost of debt after tax......................................................................................................12
CONCLUSION..............................................................................................................................28
REFERENCES..............................................................................................................................29
INTRODUCTION
Financial statement analysis of the company assist in identifying the profitability and the
growth of that company which assist in making various decision by the stakeholders of the
organisation. In this assignment, McPherson will be considered which is an custom manufacturer
of precision optical instrument this organisation is operating in Australia and provide products
relating to health and beauty. This assignment will provide understanding about forecasting,
valuation, sensitivity analysis and consulting advice on the basis of the information provided
through the analysis of the company. The Forecasting will be done on the basis of the 2018 data
on the basis of which the forecasting for the 2019 to 2023 will be made and it will assist in
getting the future growth prospects of the company. With the help of this analysis the company
will be able to identify their future growth prospects.
MAIN BODY
Forecasting
The forecasting is the process in which the company forecast the different variables
which are related to the growth and success of the business. The forecast made by the
organisation depend on the past data and the growth of the organisation on the basis of which the
company estimate its future growth prospects.
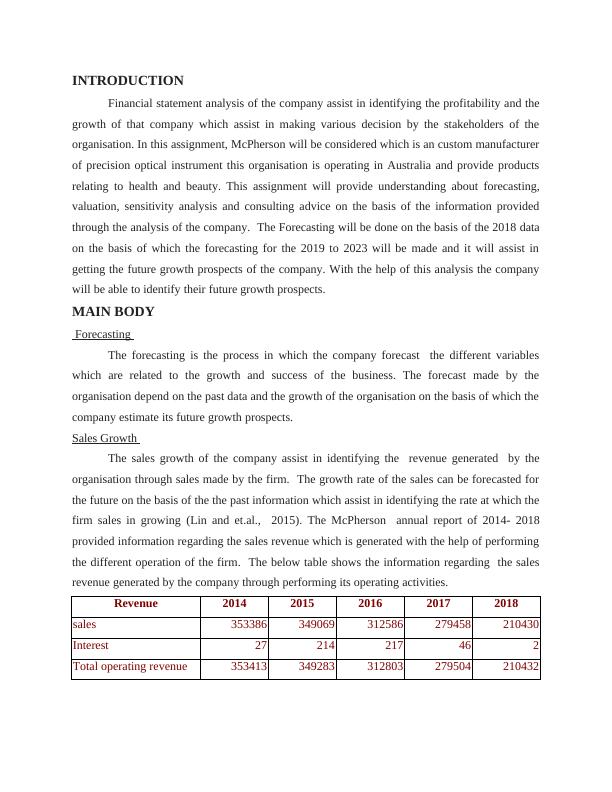
Sales Growth
The sales growth of the company assist in identifying the revenue generated by the
organisation through sales made by the firm. The growth rate of the sales can be forecasted for
the future on the basis of the the past information which assist in identifying the rate at which the
firm sales in growing (Lin and et.al., 2015). The McPherson annual report of 2014- 2018
provided information regarding the sales revenue which is generated with the help of performing
the different operation of the firm. The below table shows the information regarding the sales
revenue generated by the company through performing its operating activities.
Revenue 2014 2015 2016 2017 2018
sales 353386 349069 312586 279458 210430
Interest 27 214 217 46 2
Total operating revenue 353413 349283 312803 279504 210432
Financial statement analysis of the company assist in identifying the profitability and the
growth of that company which assist in making various decision by the stakeholders of the
organisation. In this assignment, McPherson will be considered which is an custom manufacturer
of precision optical instrument this organisation is operating in Australia and provide products
relating to health and beauty. This assignment will provide understanding about forecasting,
valuation, sensitivity analysis and consulting advice on the basis of the information provided
through the analysis of the company. The Forecasting will be done on the basis of the 2018 data
on the basis of which the forecasting for the 2019 to 2023 will be made and it will assist in
getting the future growth prospects of the company. With the help of this analysis the company
will be able to identify their future growth prospects.
MAIN BODY
Forecasting
The forecasting is the process in which the company forecast the different variables
which are related to the growth and success of the business. The forecast made by the
organisation depend on the past data and the growth of the organisation on the basis of which the
company estimate its future growth prospects.
Sales Growth
The sales growth of the company assist in identifying the revenue generated by the
organisation through sales made by the firm. The growth rate of the sales can be forecasted for
the future on the basis of the the past information which assist in identifying the rate at which the
firm sales in growing (Lin and et.al., 2015). The McPherson annual report of 2014- 2018
provided information regarding the sales revenue which is generated with the help of performing
the different operation of the firm. The below table shows the information regarding the sales
revenue generated by the company through performing its operating activities.
Revenue 2014 2015 2016 2017 2018
sales 353386 349069 312586 279458 210430
Interest 27 214 217 46 2
Total operating revenue 353413 349283 312803 279504 210432
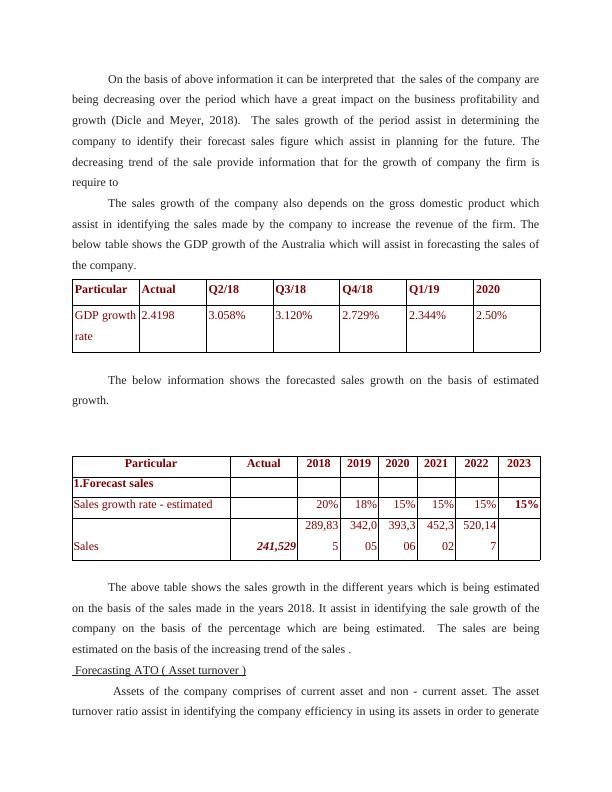
On the basis of above information it can be interpreted that the sales of the company are
being decreasing over the period which have a great impact on the business profitability and
growth (Dicle and Meyer, 2018). The sales growth of the period assist in determining the
company to identify their forecast sales figure which assist in planning for the future. The
decreasing trend of the sale provide information that for the growth of company the firm is
require to
The sales growth of the company also depends on the gross domestic product which
assist in identifying the sales made by the company to increase the revenue of the firm. The
below table shows the GDP growth of the Australia which will assist in forecasting the sales of
the company.
Particular Actual Q2/18 Q3/18 Q4/18 Q1/19 2020
GDP growth
rate
2.4198 3.058% 3.120% 2.729% 2.344% 2.50%
The below information shows the forecasted sales growth on the basis of estimated
growth.
Particular Actual 2018 2019 2020 2021 2022 2023
1.Forecast sales
Sales growth rate - estimated 20% 18% 15% 15% 15% 15%
Sales 241,529
289,83
5
342,0
05
393,3
06
452,3
02
520,14
7
The above table shows the sales growth in the different years which is being estimated
on the basis of the sales made in the years 2018. It assist in identifying the sale growth of the
company on the basis of the percentage which are being estimated. The sales are being
estimated on the basis of the increasing trend of the sales .
Forecasting ATO ( Asset turnover )
Assets of the company comprises of current asset and non - current asset. The asset
turnover ratio assist in identifying the company efficiency in using its assets in order to generate
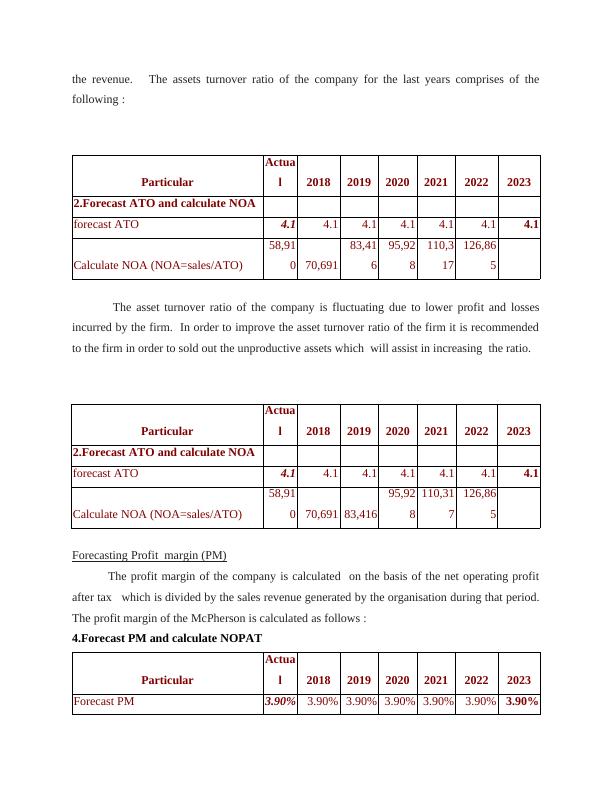
the revenue. The assets turnover ratio of the company for the last years comprises of the
following :
Particular
Actua
l 2018 2019 2020 2021 2022 2023
2.Forecast ATO and calculate NOA
forecast ATO 4.1 4.1 4.1 4.1 4.1 4.1 4.1
Calculate NOA (NOA=sales/ATO)
58,91
0 70,691
83,41
6
95,92
8
110,3
17
126,86
5
The asset turnover ratio of the company is fluctuating due to lower profit and losses
incurred by the firm. In order to improve the asset turnover ratio of the firm it is recommended
to the firm in order to sold out the unproductive assets which will assist in increasing the ratio.
Particular
Actua
l 2018 2019 2020 2021 2022 2023
2.Forecast ATO and calculate NOA
forecast ATO 4.1 4.1 4.1 4.1 4.1 4.1 4.1
Calculate NOA (NOA=sales/ATO)
58,91
0 70,691 83,416
95,92
8
110,31
7
126,86
5
Forecasting Profit margin (PM)
The profit margin of the company is calculated on the basis of the net operating profit
after tax which is divided by the sales revenue generated by the organisation during that period.
The profit margin of the McPherson is calculated as follows :
4.Forecast PM and calculate NOPAT
Particular
Actua
l 2018 2019 2020 2021 2022 2023
Forecast PM 3.90% 3.90% 3.90% 3.90% 3.90% 3.90% 3.90%
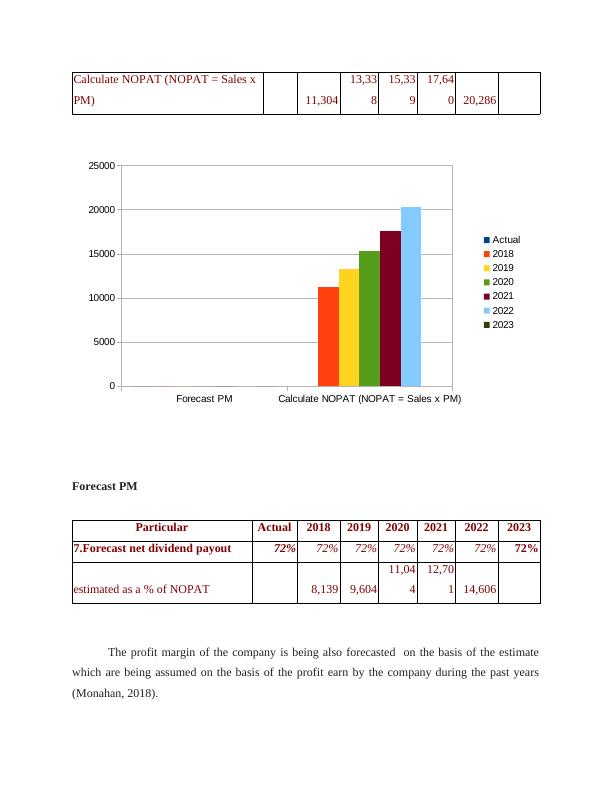
Calculate NOPAT (NOPAT = Sales x
PM) 11,304
13,33
8
15,33
9
17,64
0 20,286
Forecast PM
Particular Actual 2018 2019 2020 2021 2022 2023
7.Forecast net dividend payout 72% 72% 72% 72% 72% 72% 72%
estimated as a % of NOPAT 8,139 9,604
11,04
4
12,70
1 14,606
The profit margin of the company is being also forecasted on the basis of the estimate
which are being assumed on the basis of the profit earn by the company during the past years
(Monahan, 2018).
Forecast PM Calculate NOPAT (NOPAT = Sales x PM)
0
5000
10000
15000
20000
25000
Actual
2018
2019
2020
2021
2022
2023
End of preview
Want to access all the pages? Upload your documents or become a member.
Related Documents
Accounting Financial Analysis: Reportlg...
|27
|4909
|15
Business Valuation and Analysis Project Reportlg...
|25
|7176
|146
Business Valuation and Analysislg...
|22
|5156
|57
Valuation of McPherson's Limited using Gordon Growth Modellg...
|5
|1224
|296
RAMSAY HEALTH CARE LIMITED RHC (doc)lg...
|15
|3066
|28
Advance Corporate Finance - PDFlg...
|14
|2248
|126