Comprehensive Financial Statement Analysis of Amcor Ltd
VerifiedAdded on 2021/05/30
|21
|4417
|23
Report
AI Summary
This report presents a detailed financial statement analysis of Amcor Ltd, examining its performance based on half-yearly reports. It includes an evaluation of changes in strategy and competitive analysis. The report calculates and compares yields, assesses operating, investment, and financial management decomposition, and analyzes the sustainable growth rate and cash flow statements. Furthermore, it provides separate forecasts, discusses forecast strategies, and evaluates share price changes in relation to the half-year report. The analysis also reflects on the knowledge gained from the process, including changes in the perception of financial ratios and their interrelationships. The report utilizes various financial ratios and metrics to provide a comprehensive understanding of Amcor Ltd's financial position and performance.
Running head: FINANCIAL STATEMENT ANALYSIS
Financial Statement Analysis
Name of the Student:
Name of the University:
Authors Note:
Financial Statement Analysis
Name of the Student:
Name of the University:
Authors Note:
Paraphrase This Document
Need a fresh take? Get an instant paraphrase of this document with our AI Paraphraser
FINANCIAL STATEMENT ANALYSIS
1
Table of Contents
Part 1 of Assignment 2:..............................................................................................................3
1.a) Stating any change in strategy analysis based on half-yearly results:................................3
1.b) Stating any change in competitive strategy analysis based on half-yearly results:............3
1.c.i) Calculating yield based on half-yearly report, where shares are purchased on 28 March:
....................................................................................................................................................3
1.c.i) Comparing current half-yearly yield with full year yield:................................................4
Part 2 of Assignment 2:..............................................................................................................5
2.a Assessing and reporting operating Management Decomposition:.......................................5
2.b Evaluating and reporting Investment management decomposition:....................................6
2.c Evaluating and reporting Financial management decomposition:.......................................7
2.d Assessing and reporting sustainable growth rate:................................................................9
2.e Analysing the cash flow statement:....................................................................................10
3.a Providing separate forecast for the company:....................................................................11
3.b Analysing and discussing the appropriate forecast strategy:.............................................12
3.c Providing and discussing cash flow forecast:.....................................................................12
4.a Evaluating the change in share price within 7 days of half-year report release:................14
4.b Evaluating the change in share price within 31- December and half-year report release:.15
4.c Evaluating the change in share price between the half-year report release and 30 April:. 16
Part 3 of Assignment 2: Reflective Thinking...........................................................................17
5.a Providing discussion on each of the three analyses and how the knowledge changed:. 17
5.b Stating how my knowledge improved after receiving feedback from requirement 1:.......17
5.c Stating how the perception altered regarding the purpose of ratios:..................................18
5.d Stating how the perception of interrelationship among financial ratios and company’s
financial position changed:......................................................................................................18
FINANCIAL STATEMENT ANALYSIS
2
Reference and Bibliography:....................................................................................................20
2
Reference and Bibliography:....................................................................................................20
⊘ This is a preview!⊘
Do you want full access?
Subscribe today to unlock all pages.
Trusted by 1+ million students worldwide
FINANCIAL STATEMENT ANALYSIS
3
Part 1 of Assignment 2:
1.a) Stating any change in strategy analysis based on half-yearly results:
From the overall evaluation of the half yearly results the change in strategy analysis is
not needed, as the organizations profitability relatively increased during the half yearly
period. The half yearly result needs to be evaluated on the basis of previous half yearly
records that is provided by the organization. This would eventually help the investors to
identify the adequate Rate of returns which could be provided from investment. Therefore, it
could be stated that the current strategy analysis used for the evaluation needs to be
maintained by the investor (Alin-Eliodor 2014).
1.b) Stating any change in competitive strategy analysis based on half-yearly results:
The changes in competitive strategy should not be conducted by the investors, as
competitive analysis used for deriving the financial viability of Amcor Ltd is needed to
identify the investment viability. The rising profits that is obtained by the organisation during
the half yearly result indicates that no changes in the competitive strategy is needed as of
now.
1.c.i) Calculating yield based on half-yearly report, where shares are purchased on 28
March:
Particulars Value
Share price on 28 March 2018 14.10
Number of shares 1,736.00
Investment Amount 24,477.60
Dividends half yearly (31-12-17) 0.21
Paraphrase This Document
Need a fresh take? Get an instant paraphrase of this document with our AI Paraphraser
FINANCIAL STATEMENT ANALYSIS
4
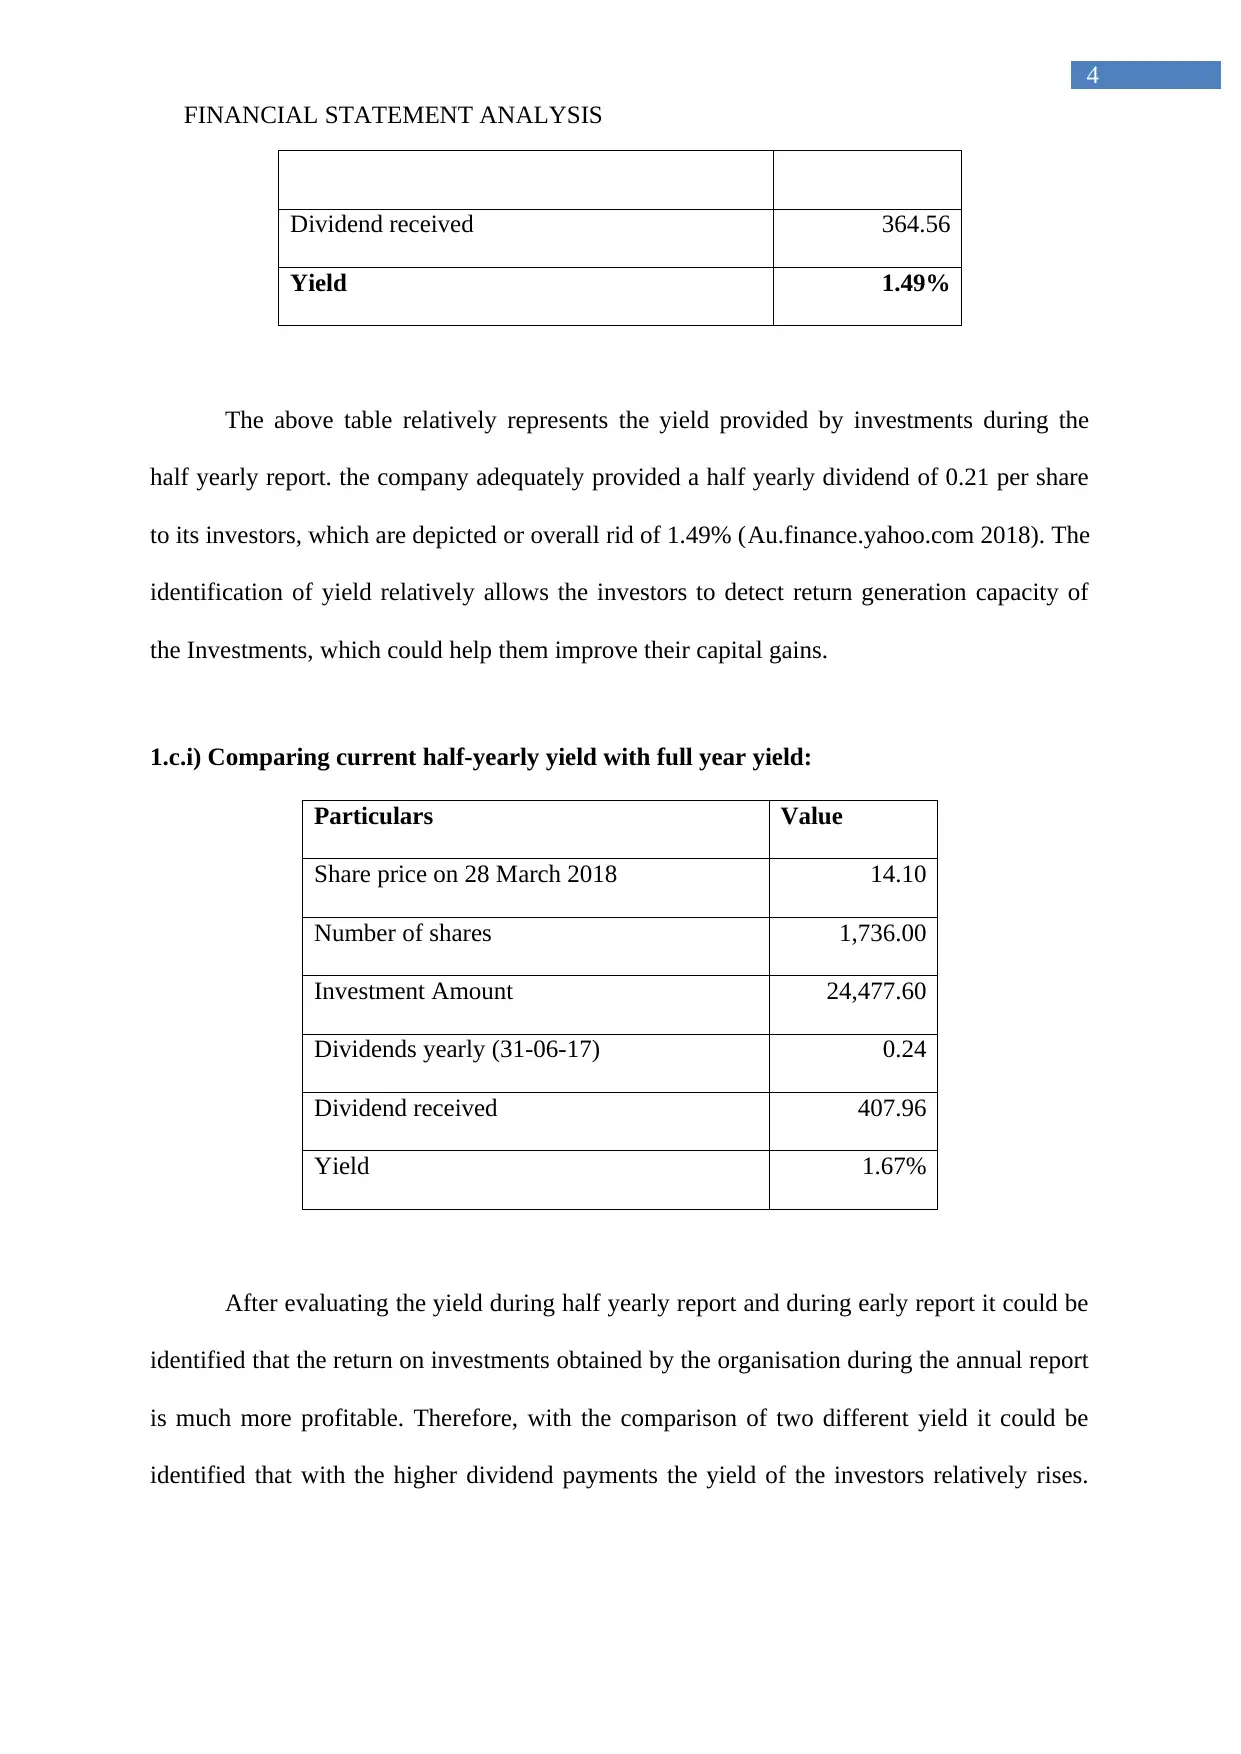
Dividend received 364.56
Yield 1.49%
The above table relatively represents the yield provided by investments during the
half yearly report. the company adequately provided a half yearly dividend of 0.21 per share
to its investors, which are depicted or overall rid of 1.49% (Au.finance.yahoo.com 2018). The
identification of yield relatively allows the investors to detect return generation capacity of
the Investments, which could help them improve their capital gains.
1.c.i) Comparing current half-yearly yield with full year yield:
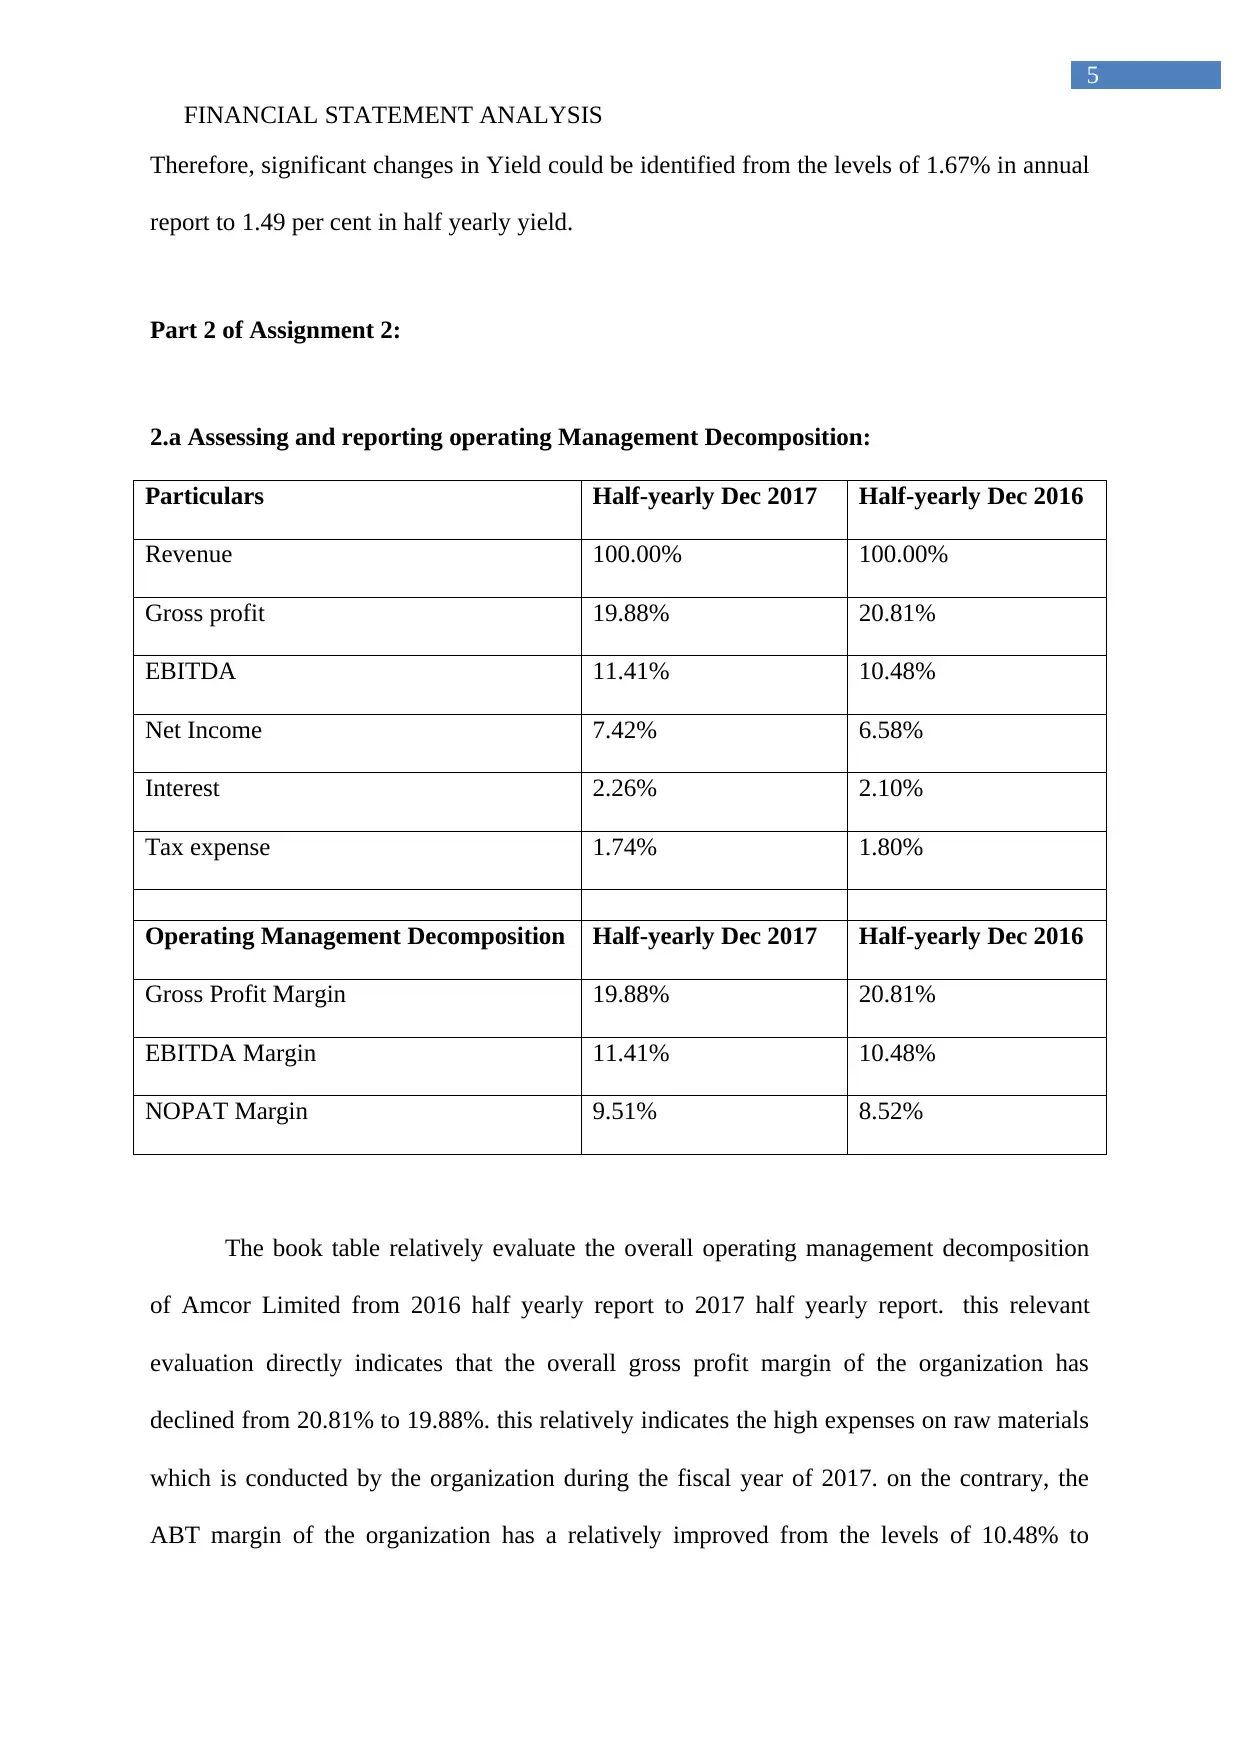
Particulars Value
Share price on 28 March 2018 14.10
Number of shares 1,736.00
Investment Amount 24,477.60
Dividends yearly (31-06-17) 0.24
Dividend received 407.96
Yield 1.67%
After evaluating the yield during half yearly report and during early report it could be
identified that the return on investments obtained by the organisation during the annual report
is much more profitable. Therefore, with the comparison of two different yield it could be
identified that with the higher dividend payments the yield of the investors relatively rises.
4
Dividend received 364.56
Yield 1.49%
The above table relatively represents the yield provided by investments during the
half yearly report. the company adequately provided a half yearly dividend of 0.21 per share
to its investors, which are depicted or overall rid of 1.49% (Au.finance.yahoo.com 2018). The
identification of yield relatively allows the investors to detect return generation capacity of
the Investments, which could help them improve their capital gains.
1.c.i) Comparing current half-yearly yield with full year yield:
Particulars Value
Share price on 28 March 2018 14.10
Number of shares 1,736.00
Investment Amount 24,477.60
Dividends yearly (31-06-17) 0.24
Dividend received 407.96
Yield 1.67%
After evaluating the yield during half yearly report and during early report it could be
identified that the return on investments obtained by the organisation during the annual report
is much more profitable. Therefore, with the comparison of two different yield it could be
identified that with the higher dividend payments the yield of the investors relatively rises.
FINANCIAL STATEMENT ANALYSIS
5
Therefore, significant changes in Yield could be identified from the levels of 1.67% in annual
report to 1.49 per cent in half yearly yield.
Part 2 of Assignment 2:
2.a Assessing and reporting operating Management Decomposition:
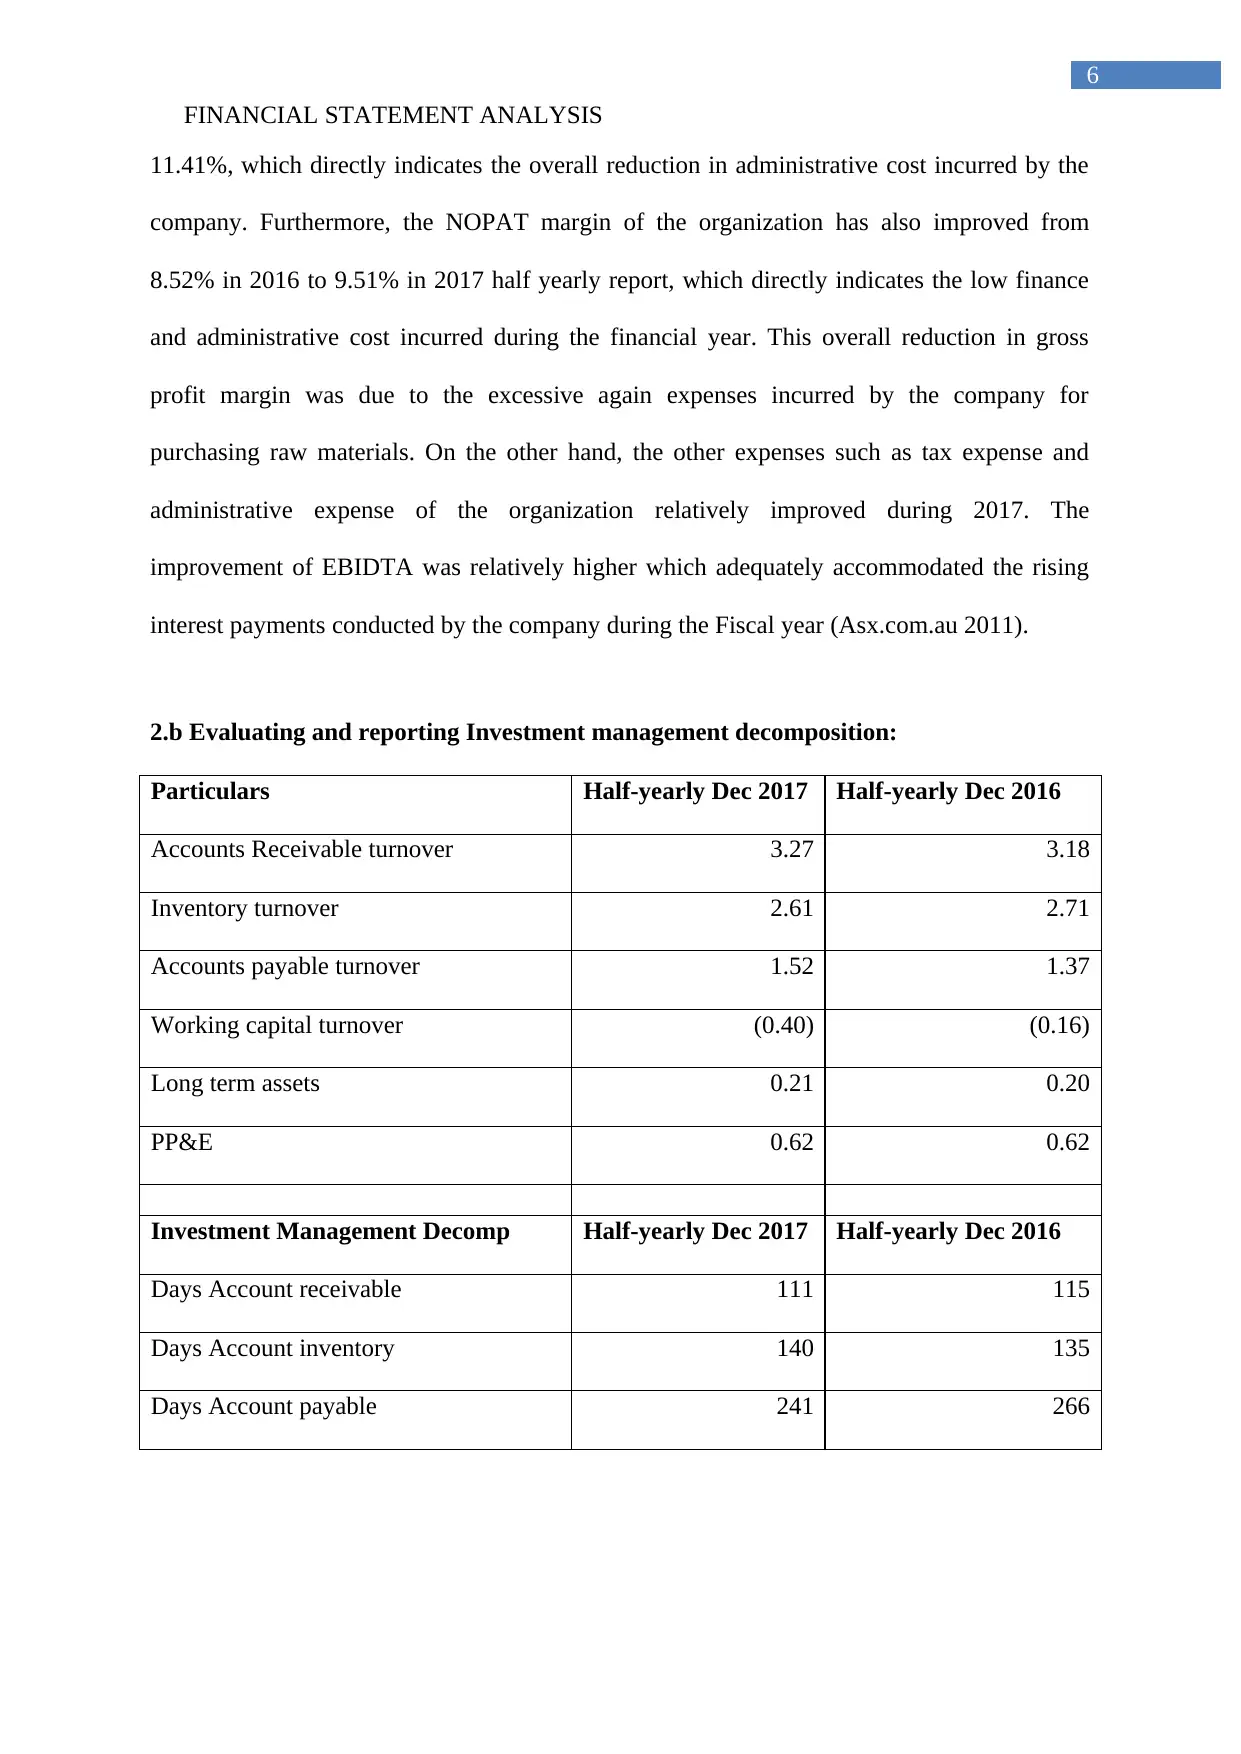
Particulars Half-yearly Dec 2017 Half-yearly Dec 2016
Revenue 100.00% 100.00%
Gross profit 19.88% 20.81%
EBITDA 11.41% 10.48%
Net Income 7.42% 6.58%
Interest 2.26% 2.10%
Tax expense 1.74% 1.80%
Operating Management Decomposition Half-yearly Dec 2017 Half-yearly Dec 2016
Gross Profit Margin 19.88% 20.81%
EBITDA Margin 11.41% 10.48%
NOPAT Margin 9.51% 8.52%
The book table relatively evaluate the overall operating management decomposition
of Amcor Limited from 2016 half yearly report to 2017 half yearly report. this relevant
evaluation directly indicates that the overall gross profit margin of the organization has
declined from 20.81% to 19.88%. this relatively indicates the high expenses on raw materials
which is conducted by the organization during the fiscal year of 2017. on the contrary, the
ABT margin of the organization has a relatively improved from the levels of 10.48% to
5
Therefore, significant changes in Yield could be identified from the levels of 1.67% in annual
report to 1.49 per cent in half yearly yield.
Part 2 of Assignment 2:
2.a Assessing and reporting operating Management Decomposition:
Particulars Half-yearly Dec 2017 Half-yearly Dec 2016
Revenue 100.00% 100.00%
Gross profit 19.88% 20.81%
EBITDA 11.41% 10.48%
Net Income 7.42% 6.58%
Interest 2.26% 2.10%
Tax expense 1.74% 1.80%
Operating Management Decomposition Half-yearly Dec 2017 Half-yearly Dec 2016
Gross Profit Margin 19.88% 20.81%
EBITDA Margin 11.41% 10.48%
NOPAT Margin 9.51% 8.52%
The book table relatively evaluate the overall operating management decomposition
of Amcor Limited from 2016 half yearly report to 2017 half yearly report. this relevant
evaluation directly indicates that the overall gross profit margin of the organization has
declined from 20.81% to 19.88%. this relatively indicates the high expenses on raw materials
which is conducted by the organization during the fiscal year of 2017. on the contrary, the
ABT margin of the organization has a relatively improved from the levels of 10.48% to
⊘ This is a preview!⊘
Do you want full access?
Subscribe today to unlock all pages.
Trusted by 1+ million students worldwide
FINANCIAL STATEMENT ANALYSIS
6
11.41%, which directly indicates the overall reduction in administrative cost incurred by the
company. Furthermore, the NOPAT margin of the organization has also improved from
8.52% in 2016 to 9.51% in 2017 half yearly report, which directly indicates the low finance
and administrative cost incurred during the financial year. This overall reduction in gross
profit margin was due to the excessive again expenses incurred by the company for
purchasing raw materials. On the other hand, the other expenses such as tax expense and
administrative expense of the organization relatively improved during 2017. The
improvement of EBIDTA was relatively higher which adequately accommodated the rising
interest payments conducted by the company during the Fiscal year (Asx.com.au 2011).
2.b Evaluating and reporting Investment management decomposition:
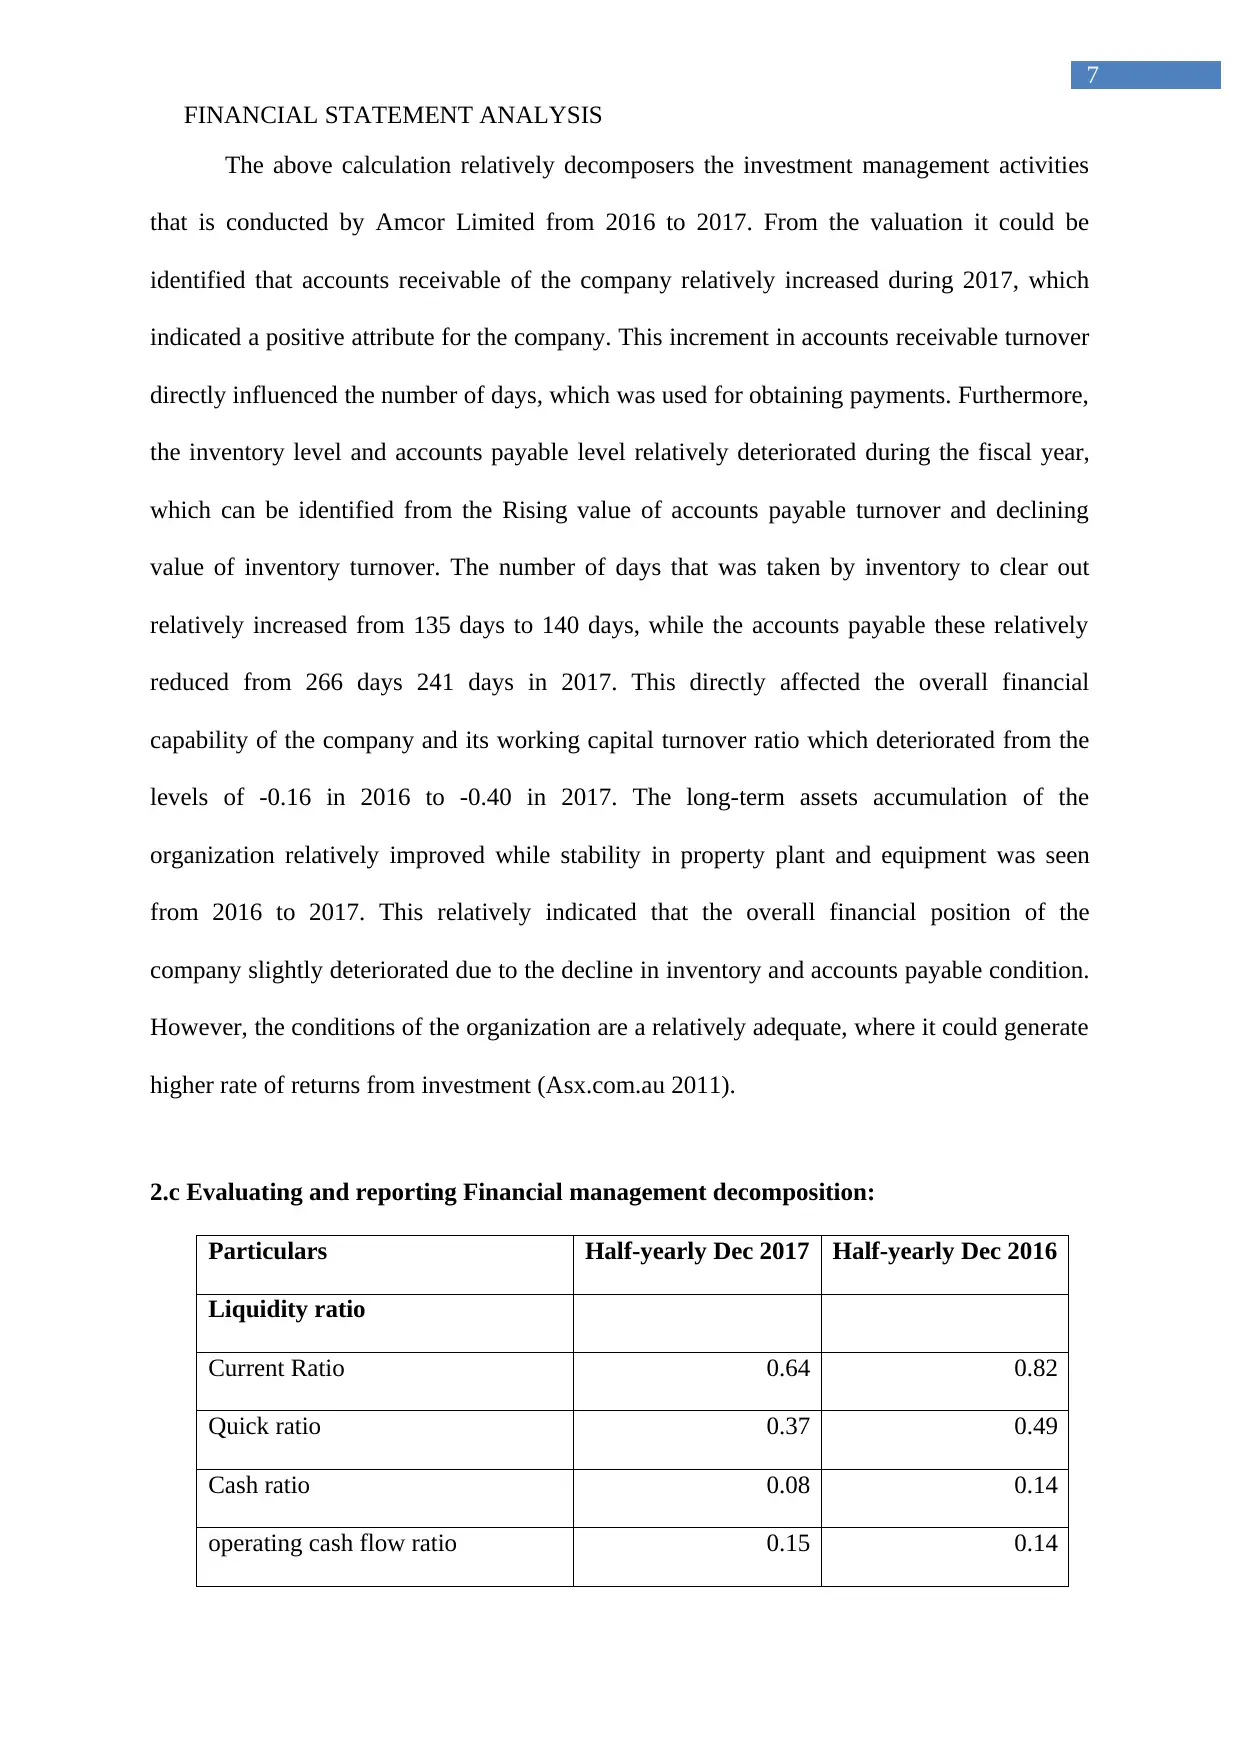
Particulars Half-yearly Dec 2017 Half-yearly Dec 2016
Accounts Receivable turnover 3.27 3.18
Inventory turnover 2.61 2.71
Accounts payable turnover 1.52 1.37
Working capital turnover (0.40) (0.16)
Long term assets 0.21 0.20
PP&E 0.62 0.62
Investment Management Decomp Half-yearly Dec 2017 Half-yearly Dec 2016
Days Account receivable 111 115
Days Account inventory 140 135
Days Account payable 241 266
6
11.41%, which directly indicates the overall reduction in administrative cost incurred by the
company. Furthermore, the NOPAT margin of the organization has also improved from
8.52% in 2016 to 9.51% in 2017 half yearly report, which directly indicates the low finance
and administrative cost incurred during the financial year. This overall reduction in gross
profit margin was due to the excessive again expenses incurred by the company for
purchasing raw materials. On the other hand, the other expenses such as tax expense and
administrative expense of the organization relatively improved during 2017. The
improvement of EBIDTA was relatively higher which adequately accommodated the rising
interest payments conducted by the company during the Fiscal year (Asx.com.au 2011).
2.b Evaluating and reporting Investment management decomposition:
Particulars Half-yearly Dec 2017 Half-yearly Dec 2016
Accounts Receivable turnover 3.27 3.18
Inventory turnover 2.61 2.71
Accounts payable turnover 1.52 1.37
Working capital turnover (0.40) (0.16)
Long term assets 0.21 0.20
PP&E 0.62 0.62
Investment Management Decomp Half-yearly Dec 2017 Half-yearly Dec 2016
Days Account receivable 111 115
Days Account inventory 140 135
Days Account payable 241 266
Paraphrase This Document
Need a fresh take? Get an instant paraphrase of this document with our AI Paraphraser
FINANCIAL STATEMENT ANALYSIS
7
The above calculation relatively decomposers the investment management activities
that is conducted by Amcor Limited from 2016 to 2017. From the valuation it could be
identified that accounts receivable of the company relatively increased during 2017, which
indicated a positive attribute for the company. This increment in accounts receivable turnover
directly influenced the number of days, which was used for obtaining payments. Furthermore,
the inventory level and accounts payable level relatively deteriorated during the fiscal year,
which can be identified from the Rising value of accounts payable turnover and declining
value of inventory turnover. The number of days that was taken by inventory to clear out
relatively increased from 135 days to 140 days, while the accounts payable these relatively
reduced from 266 days 241 days in 2017. This directly affected the overall financial
capability of the company and its working capital turnover ratio which deteriorated from the
levels of -0.16 in 2016 to -0.40 in 2017. The long-term assets accumulation of the
organization relatively improved while stability in property plant and equipment was seen
from 2016 to 2017. This relatively indicated that the overall financial position of the
company slightly deteriorated due to the decline in inventory and accounts payable condition.
However, the conditions of the organization are a relatively adequate, where it could generate
higher rate of returns from investment (Asx.com.au 2011).
2.c Evaluating and reporting Financial management decomposition:
Particulars Half-yearly Dec 2017 Half-yearly Dec 2016
Liquidity ratio
Current Ratio 0.64 0.82
Quick ratio 0.37 0.49
Cash ratio 0.08 0.14
operating cash flow ratio 0.15 0.14
FINANCIAL STATEMENT ANALYSIS
8
Debt and Coverage Ratio
Liabilities to equity 8.46 9.19
Debt to equity 4.98 5.17
Net debt to equity 4.54 4.54
Debt to capital 0.83 0.84
Net Debt to capital 0.82 0.82
Interest coverage (earnings based) 5.05 4.99
Interest coverage (cash flow based) 5.90 7.85
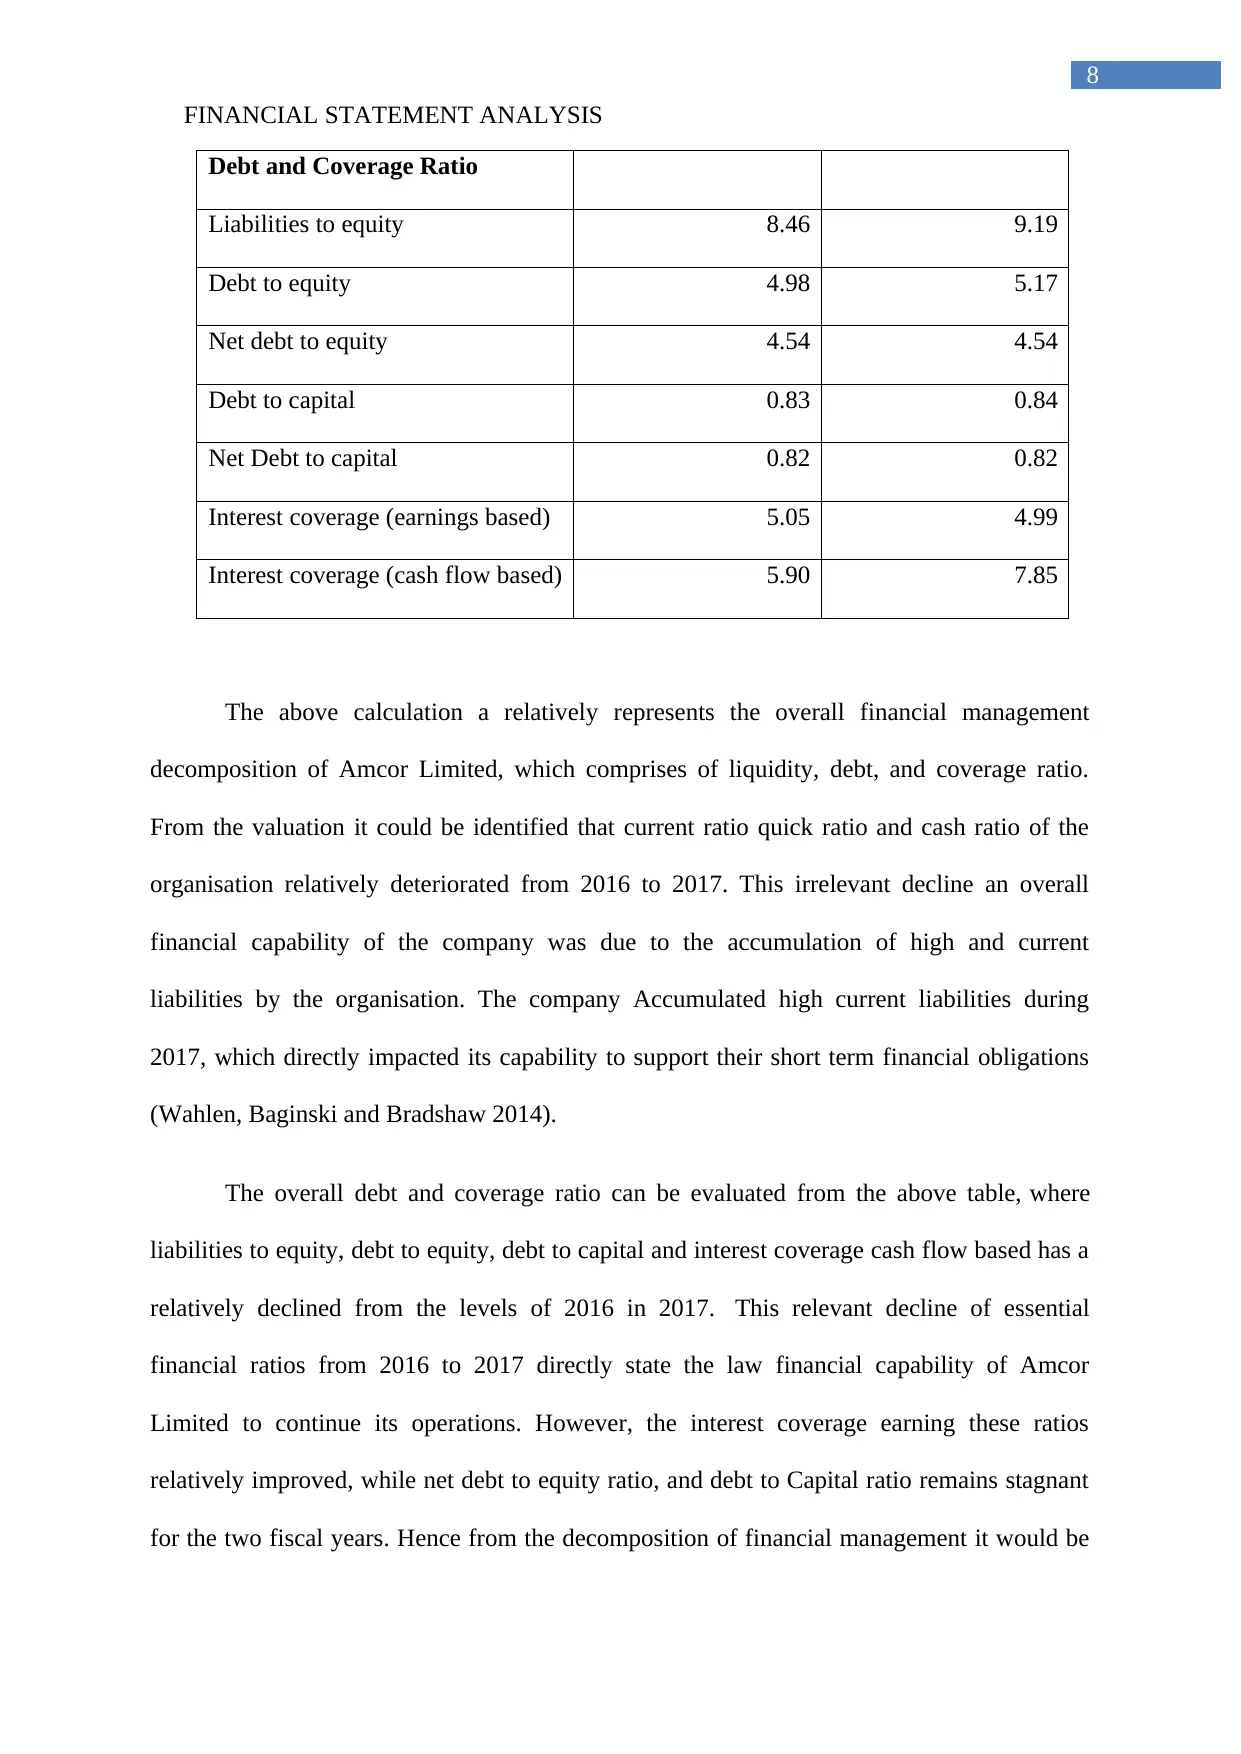
The above calculation a relatively represents the overall financial management
decomposition of Amcor Limited, which comprises of liquidity, debt, and coverage ratio.
From the valuation it could be identified that current ratio quick ratio and cash ratio of the
organisation relatively deteriorated from 2016 to 2017. This irrelevant decline an overall
financial capability of the company was due to the accumulation of high and current
liabilities by the organisation. The company Accumulated high current liabilities during
2017, which directly impacted its capability to support their short term financial obligations
(Wahlen, Baginski and Bradshaw 2014).
The overall debt and coverage ratio can be evaluated from the above table, where
liabilities to equity, debt to equity, debt to capital and interest coverage cash flow based has a
relatively declined from the levels of 2016 in 2017. This relevant decline of essential
financial ratios from 2016 to 2017 directly state the law financial capability of Amcor
Limited to continue its operations. However, the interest coverage earning these ratios
relatively improved, while net debt to equity ratio, and debt to Capital ratio remains stagnant
for the two fiscal years. Hence from the decomposition of financial management it would be
8
Debt and Coverage Ratio
Liabilities to equity 8.46 9.19
Debt to equity 4.98 5.17
Net debt to equity 4.54 4.54
Debt to capital 0.83 0.84
Net Debt to capital 0.82 0.82
Interest coverage (earnings based) 5.05 4.99
Interest coverage (cash flow based) 5.90 7.85
The above calculation a relatively represents the overall financial management
decomposition of Amcor Limited, which comprises of liquidity, debt, and coverage ratio.
From the valuation it could be identified that current ratio quick ratio and cash ratio of the
organisation relatively deteriorated from 2016 to 2017. This irrelevant decline an overall
financial capability of the company was due to the accumulation of high and current
liabilities by the organisation. The company Accumulated high current liabilities during
2017, which directly impacted its capability to support their short term financial obligations
(Wahlen, Baginski and Bradshaw 2014).
The overall debt and coverage ratio can be evaluated from the above table, where
liabilities to equity, debt to equity, debt to capital and interest coverage cash flow based has a
relatively declined from the levels of 2016 in 2017. This relevant decline of essential
financial ratios from 2016 to 2017 directly state the law financial capability of Amcor
Limited to continue its operations. However, the interest coverage earning these ratios
relatively improved, while net debt to equity ratio, and debt to Capital ratio remains stagnant
for the two fiscal years. Hence from the decomposition of financial management it would be
⊘ This is a preview!⊘
Do you want full access?
Subscribe today to unlock all pages.
Trusted by 1+ million students worldwide
FINANCIAL STATEMENT ANALYSIS
9
identified that the performance of the company has deteriorated from 2016 to 2017, while
adequate measures needs to be implemented by the organization to improve its financial
position (Asx.com.au 2011).
2.d Assessing and reporting sustainable growth rate:
Particulars Half-yearly Dec 2017 Half-yearly Dec 2016
Return on Equity 34.86% 32.97%
Dividend pay-out ratio 81.61% 86.73%
Sustainable growth rate 6.41% 4.37%
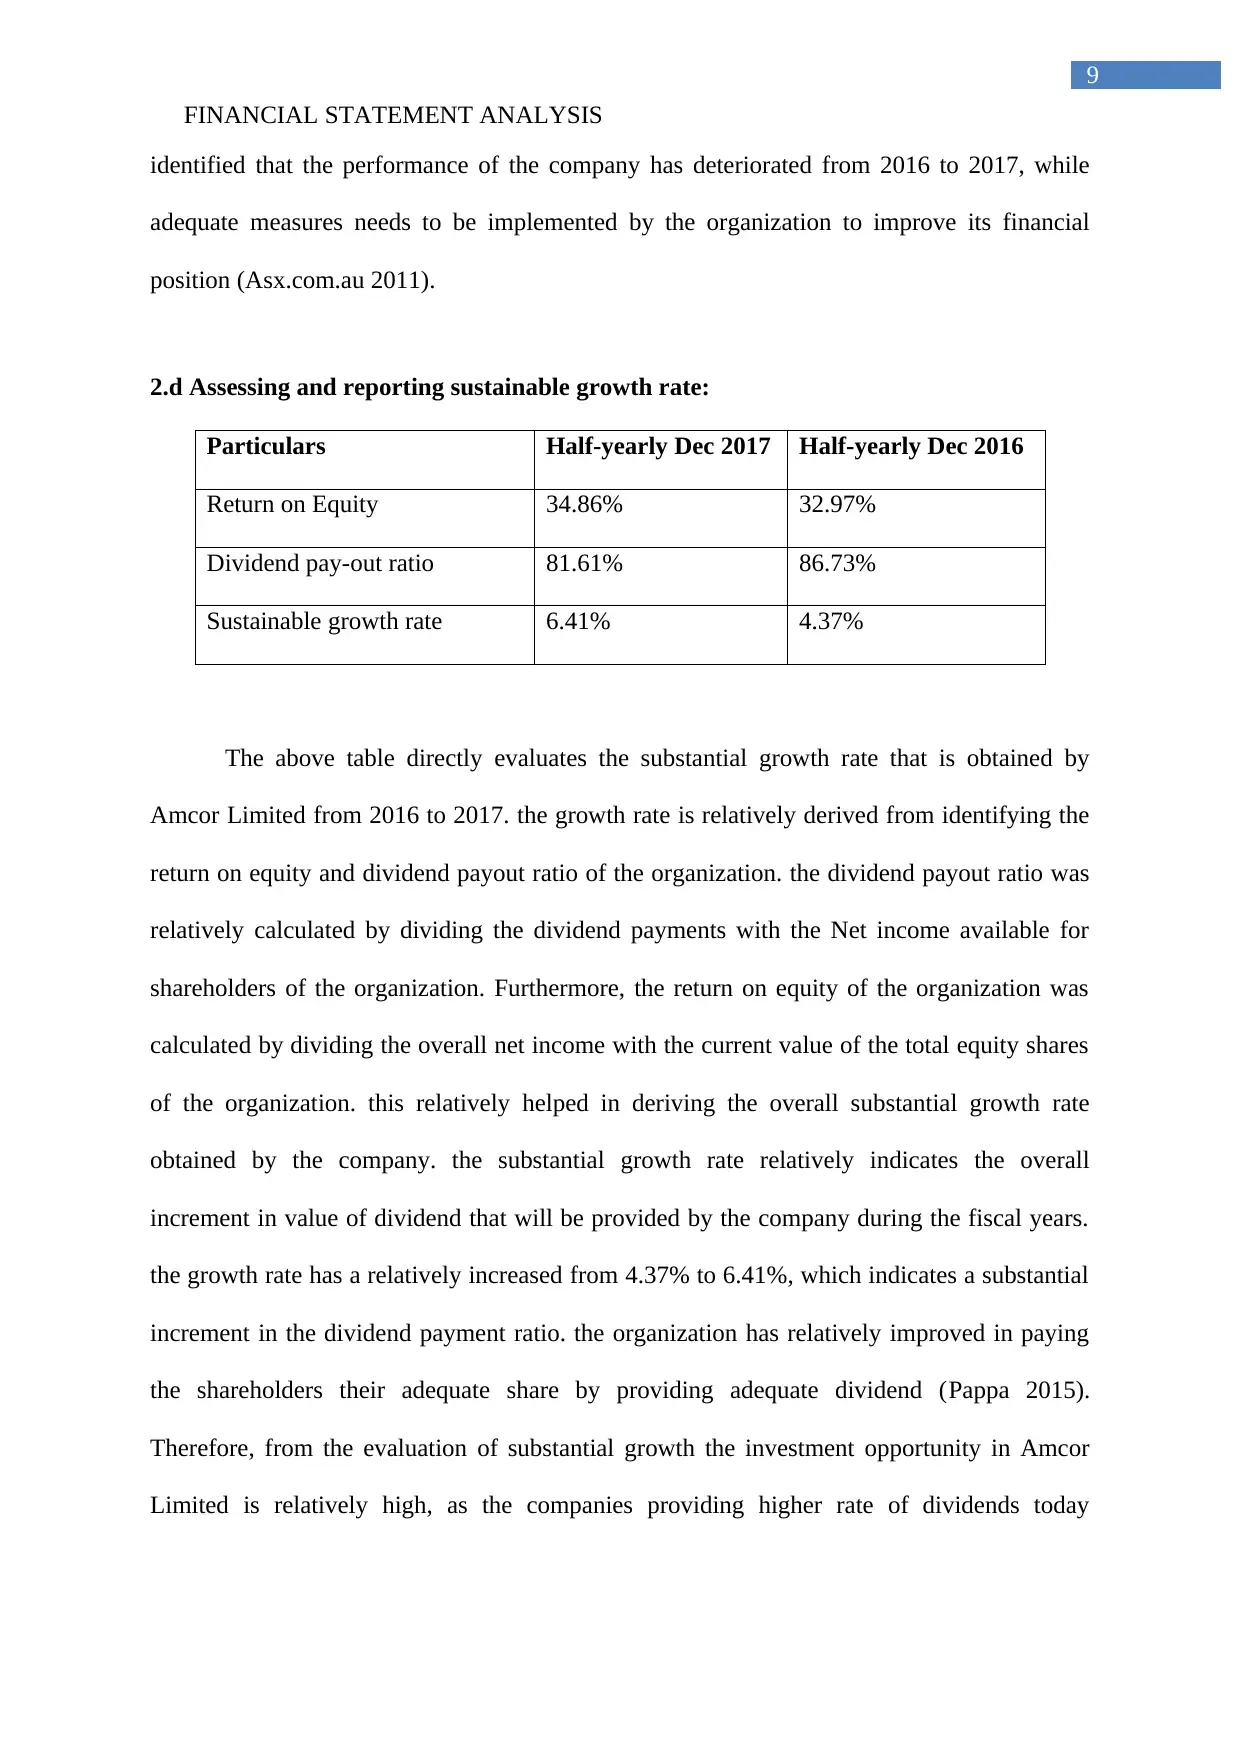
The above table directly evaluates the substantial growth rate that is obtained by
Amcor Limited from 2016 to 2017. the growth rate is relatively derived from identifying the
return on equity and dividend payout ratio of the organization. the dividend payout ratio was
relatively calculated by dividing the dividend payments with the Net income available for
shareholders of the organization. Furthermore, the return on equity of the organization was
calculated by dividing the overall net income with the current value of the total equity shares
of the organization. this relatively helped in deriving the overall substantial growth rate
obtained by the company. the substantial growth rate relatively indicates the overall
increment in value of dividend that will be provided by the company during the fiscal years.
the growth rate has a relatively increased from 4.37% to 6.41%, which indicates a substantial
increment in the dividend payment ratio. the organization has relatively improved in paying
the shareholders their adequate share by providing adequate dividend (Pappa 2015).
Therefore, from the evaluation of substantial growth the investment opportunity in Amcor
Limited is relatively high, as the companies providing higher rate of dividends today
9
identified that the performance of the company has deteriorated from 2016 to 2017, while
adequate measures needs to be implemented by the organization to improve its financial
position (Asx.com.au 2011).
2.d Assessing and reporting sustainable growth rate:
Particulars Half-yearly Dec 2017 Half-yearly Dec 2016
Return on Equity 34.86% 32.97%
Dividend pay-out ratio 81.61% 86.73%
Sustainable growth rate 6.41% 4.37%
The above table directly evaluates the substantial growth rate that is obtained by
Amcor Limited from 2016 to 2017. the growth rate is relatively derived from identifying the
return on equity and dividend payout ratio of the organization. the dividend payout ratio was
relatively calculated by dividing the dividend payments with the Net income available for
shareholders of the organization. Furthermore, the return on equity of the organization was
calculated by dividing the overall net income with the current value of the total equity shares
of the organization. this relatively helped in deriving the overall substantial growth rate
obtained by the company. the substantial growth rate relatively indicates the overall
increment in value of dividend that will be provided by the company during the fiscal years.
the growth rate has a relatively increased from 4.37% to 6.41%, which indicates a substantial
increment in the dividend payment ratio. the organization has relatively improved in paying
the shareholders their adequate share by providing adequate dividend (Pappa 2015).
Therefore, from the evaluation of substantial growth the investment opportunity in Amcor
Limited is relatively high, as the companies providing higher rate of dividends today
Paraphrase This Document
Need a fresh take? Get an instant paraphrase of this document with our AI Paraphraser
FINANCIAL STATEMENT ANALYSIS
10
investors. This increment in substantial growth rate was relatively obtained by the rising level
of returns on equity, Obtained by the organization during 2017.
2.e Analysing the cash flow statement:
10
investors. This increment in substantial growth rate was relatively obtained by the rising level
of returns on equity, Obtained by the organization during 2017.
2.e Analysing the cash flow statement:
FINANCIAL STATEMENT ANALYSIS
11
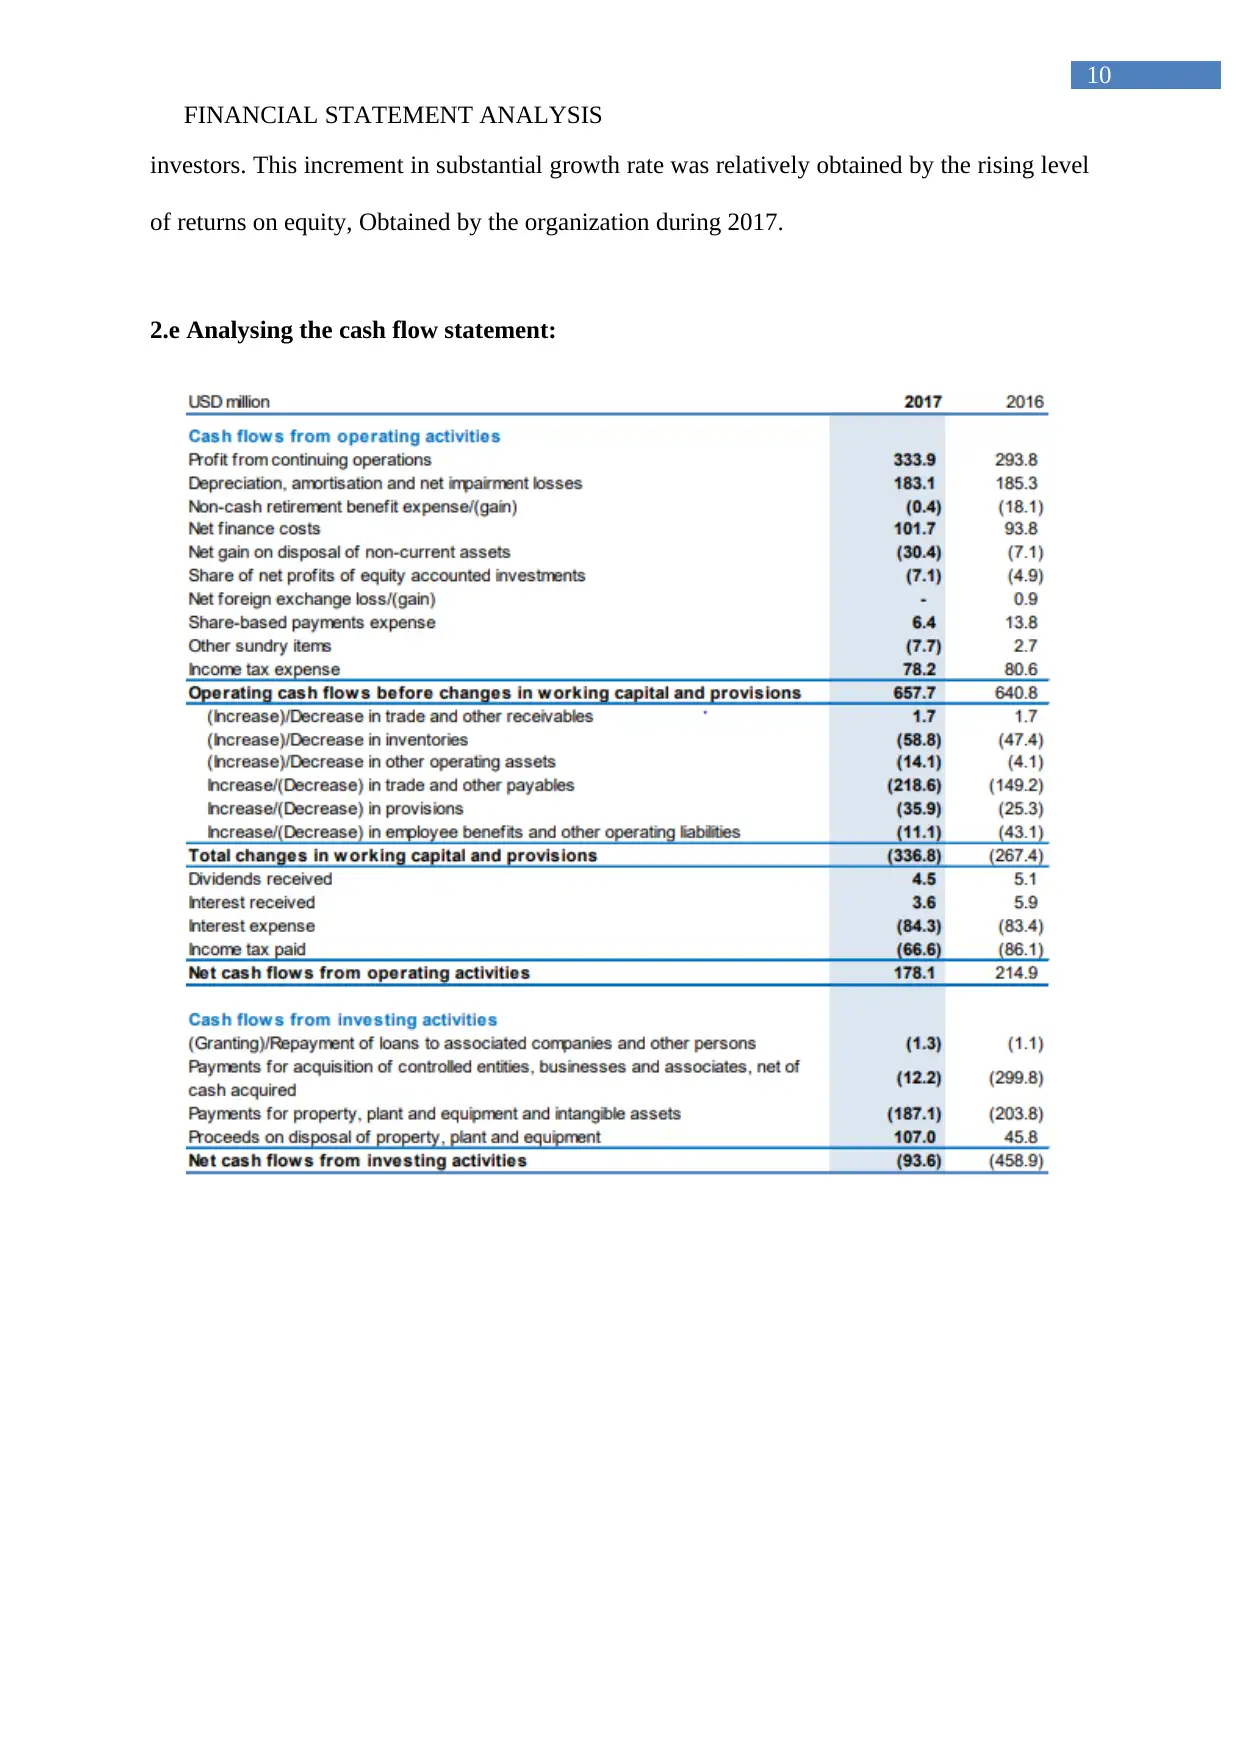
The evaluation of above cash flow statement relatively indicates that the overall
position of Amcor Limited as a relatively declined from 2016 to 2017 half yearly report. The
other operations of the organization relatively declined due to the low cash and cash
equivalents at the end of the financial period for the company. The net cash flow from
operating activities of the company relatively reduced from 214.9 million in 2016 to 178.1
million in 2017. The reduction was conducted in trade and other peoples of the organization,
which were relatively reduced the overall net operating activities of the organization. The
cash flow from investing activities are relatively improved where the reduction in
investments of the organization helped in reducing the cash outflow. inside the company
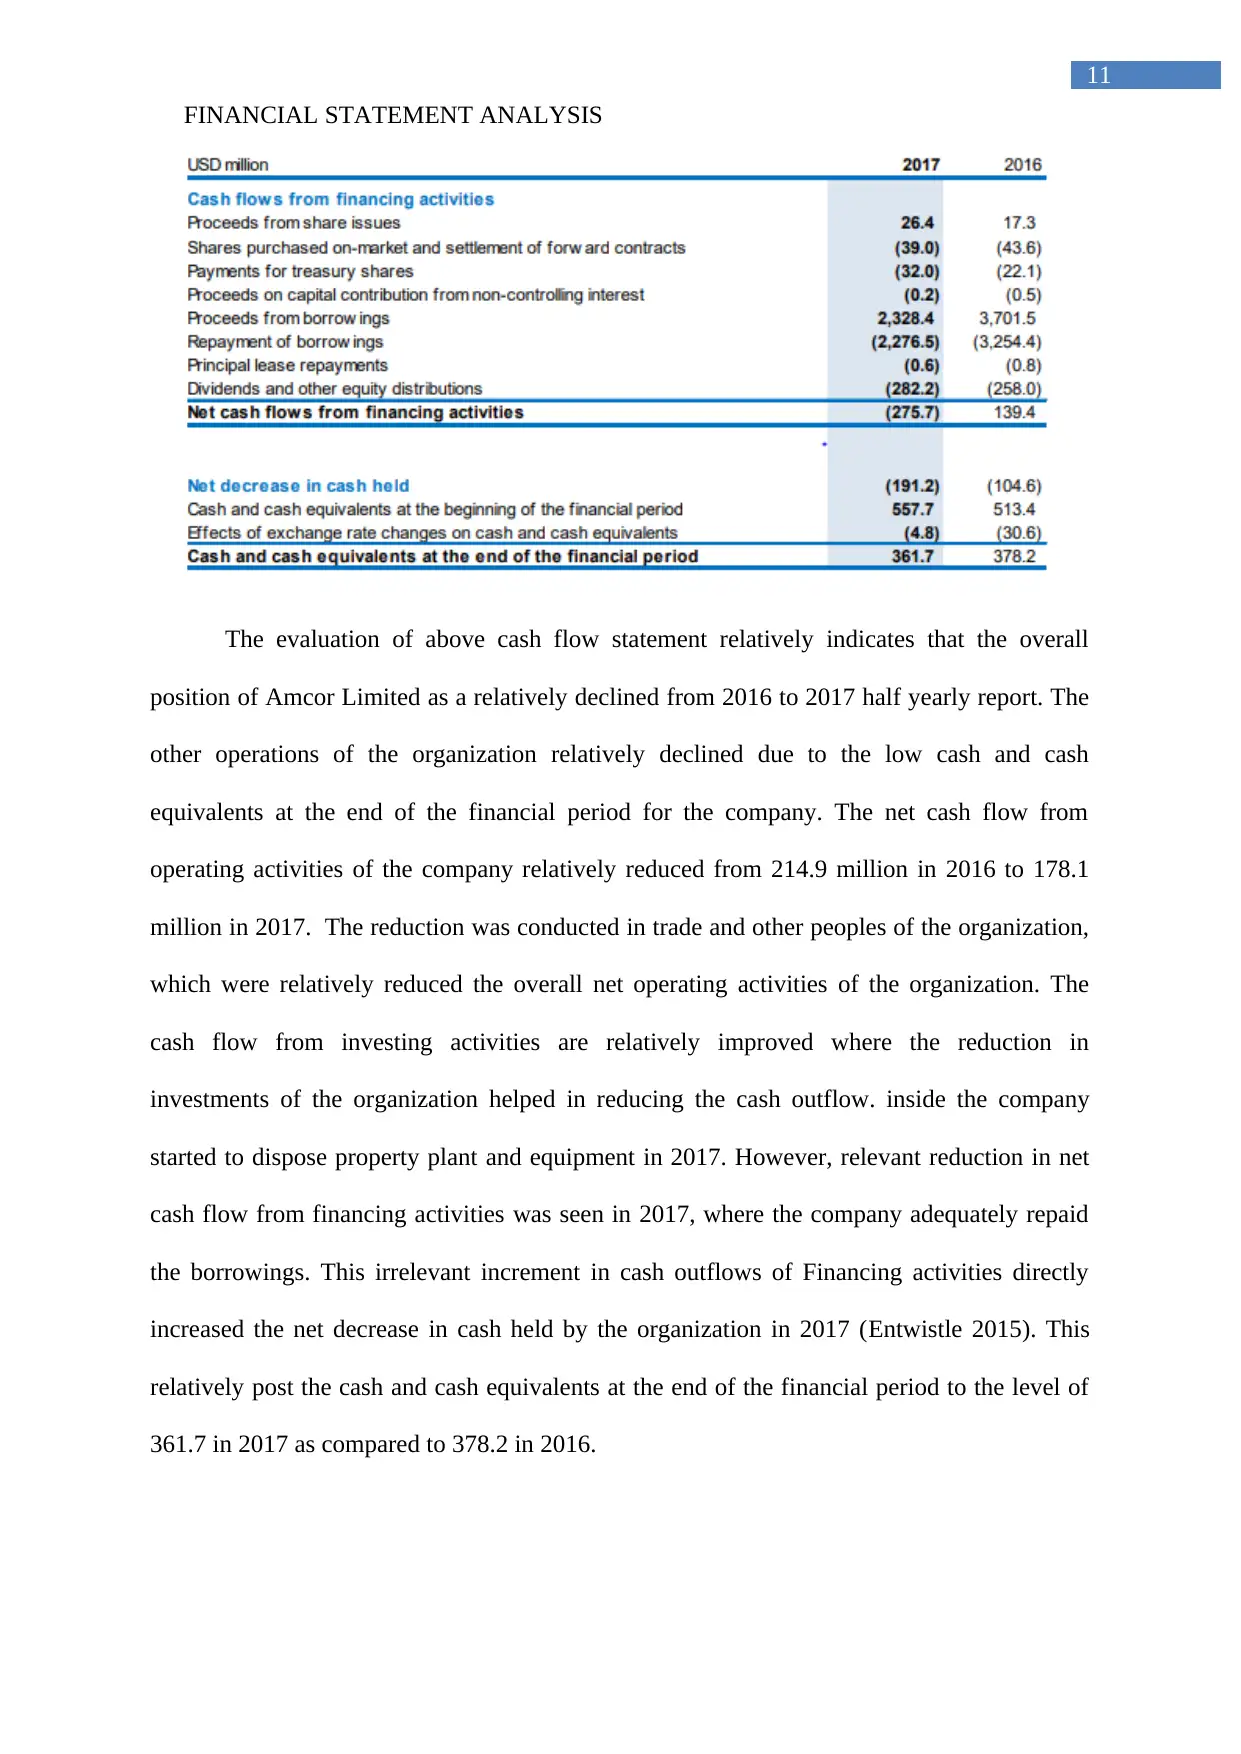
started to dispose property plant and equipment in 2017. However, relevant reduction in net
cash flow from financing activities was seen in 2017, where the company adequately repaid
the borrowings. This irrelevant increment in cash outflows of Financing activities directly
increased the net decrease in cash held by the organization in 2017 (Entwistle 2015). This
relatively post the cash and cash equivalents at the end of the financial period to the level of
361.7 in 2017 as compared to 378.2 in 2016.
11
The evaluation of above cash flow statement relatively indicates that the overall
position of Amcor Limited as a relatively declined from 2016 to 2017 half yearly report. The
other operations of the organization relatively declined due to the low cash and cash
equivalents at the end of the financial period for the company. The net cash flow from
operating activities of the company relatively reduced from 214.9 million in 2016 to 178.1
million in 2017. The reduction was conducted in trade and other peoples of the organization,
which were relatively reduced the overall net operating activities of the organization. The
cash flow from investing activities are relatively improved where the reduction in
investments of the organization helped in reducing the cash outflow. inside the company
started to dispose property plant and equipment in 2017. However, relevant reduction in net
cash flow from financing activities was seen in 2017, where the company adequately repaid
the borrowings. This irrelevant increment in cash outflows of Financing activities directly
increased the net decrease in cash held by the organization in 2017 (Entwistle 2015). This
relatively post the cash and cash equivalents at the end of the financial period to the level of
361.7 in 2017 as compared to 378.2 in 2016.
⊘ This is a preview!⊘
Do you want full access?
Subscribe today to unlock all pages.
Trusted by 1+ million students worldwide
1 out of 21
Related Documents


Your All-in-One AI-Powered Toolkit for Academic Success.
+13062052269
info@desklib.com
Available 24*7 on WhatsApp / Email
![[object Object]](/_next/static/media/star-bottom.7253800d.svg)
Unlock your academic potential
Copyright © 2020–2025 A2Z Services. All Rights Reserved. Developed and managed by ZUCOL.