Financial Statement Analysis Report: E&A Limited Performance Review
VerifiedAdded on 2020/04/07
|8
|1350
|42
Report
AI Summary
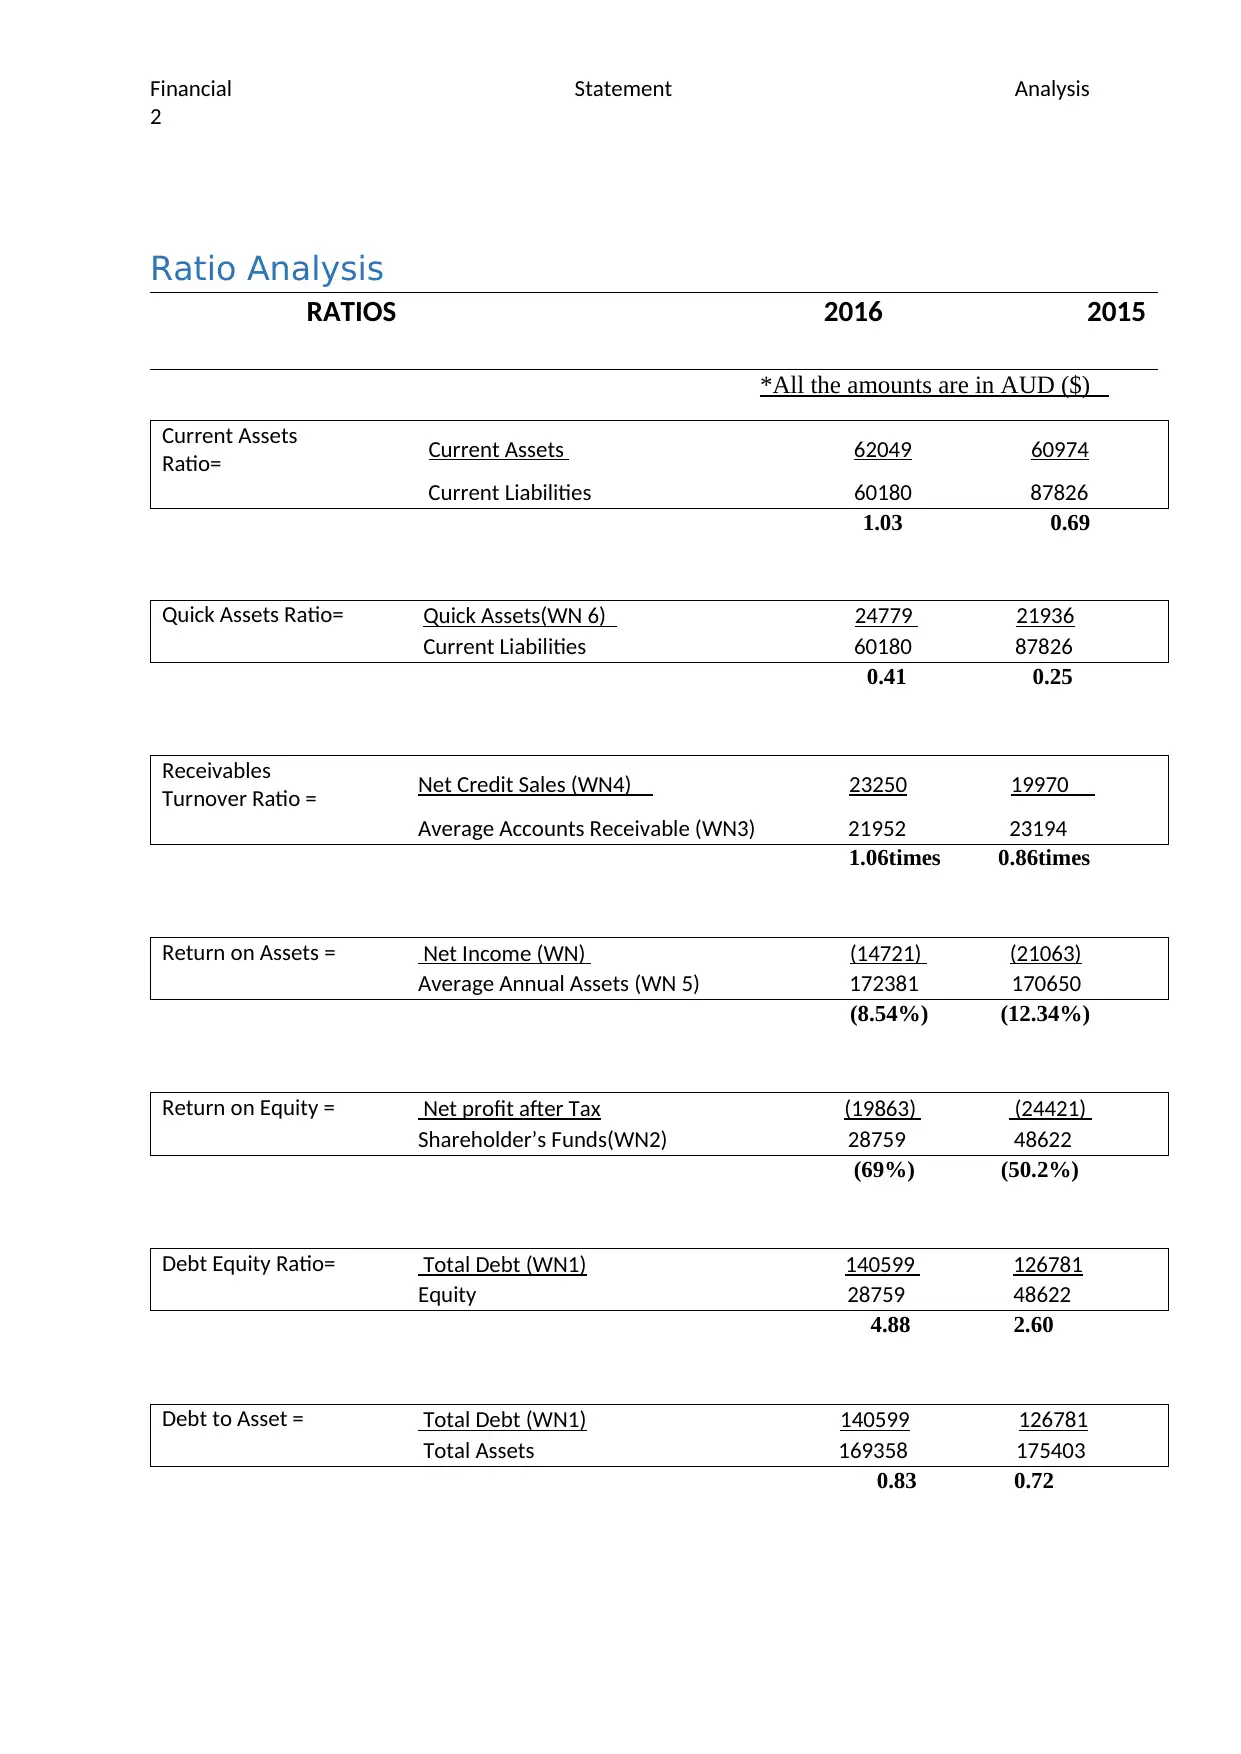
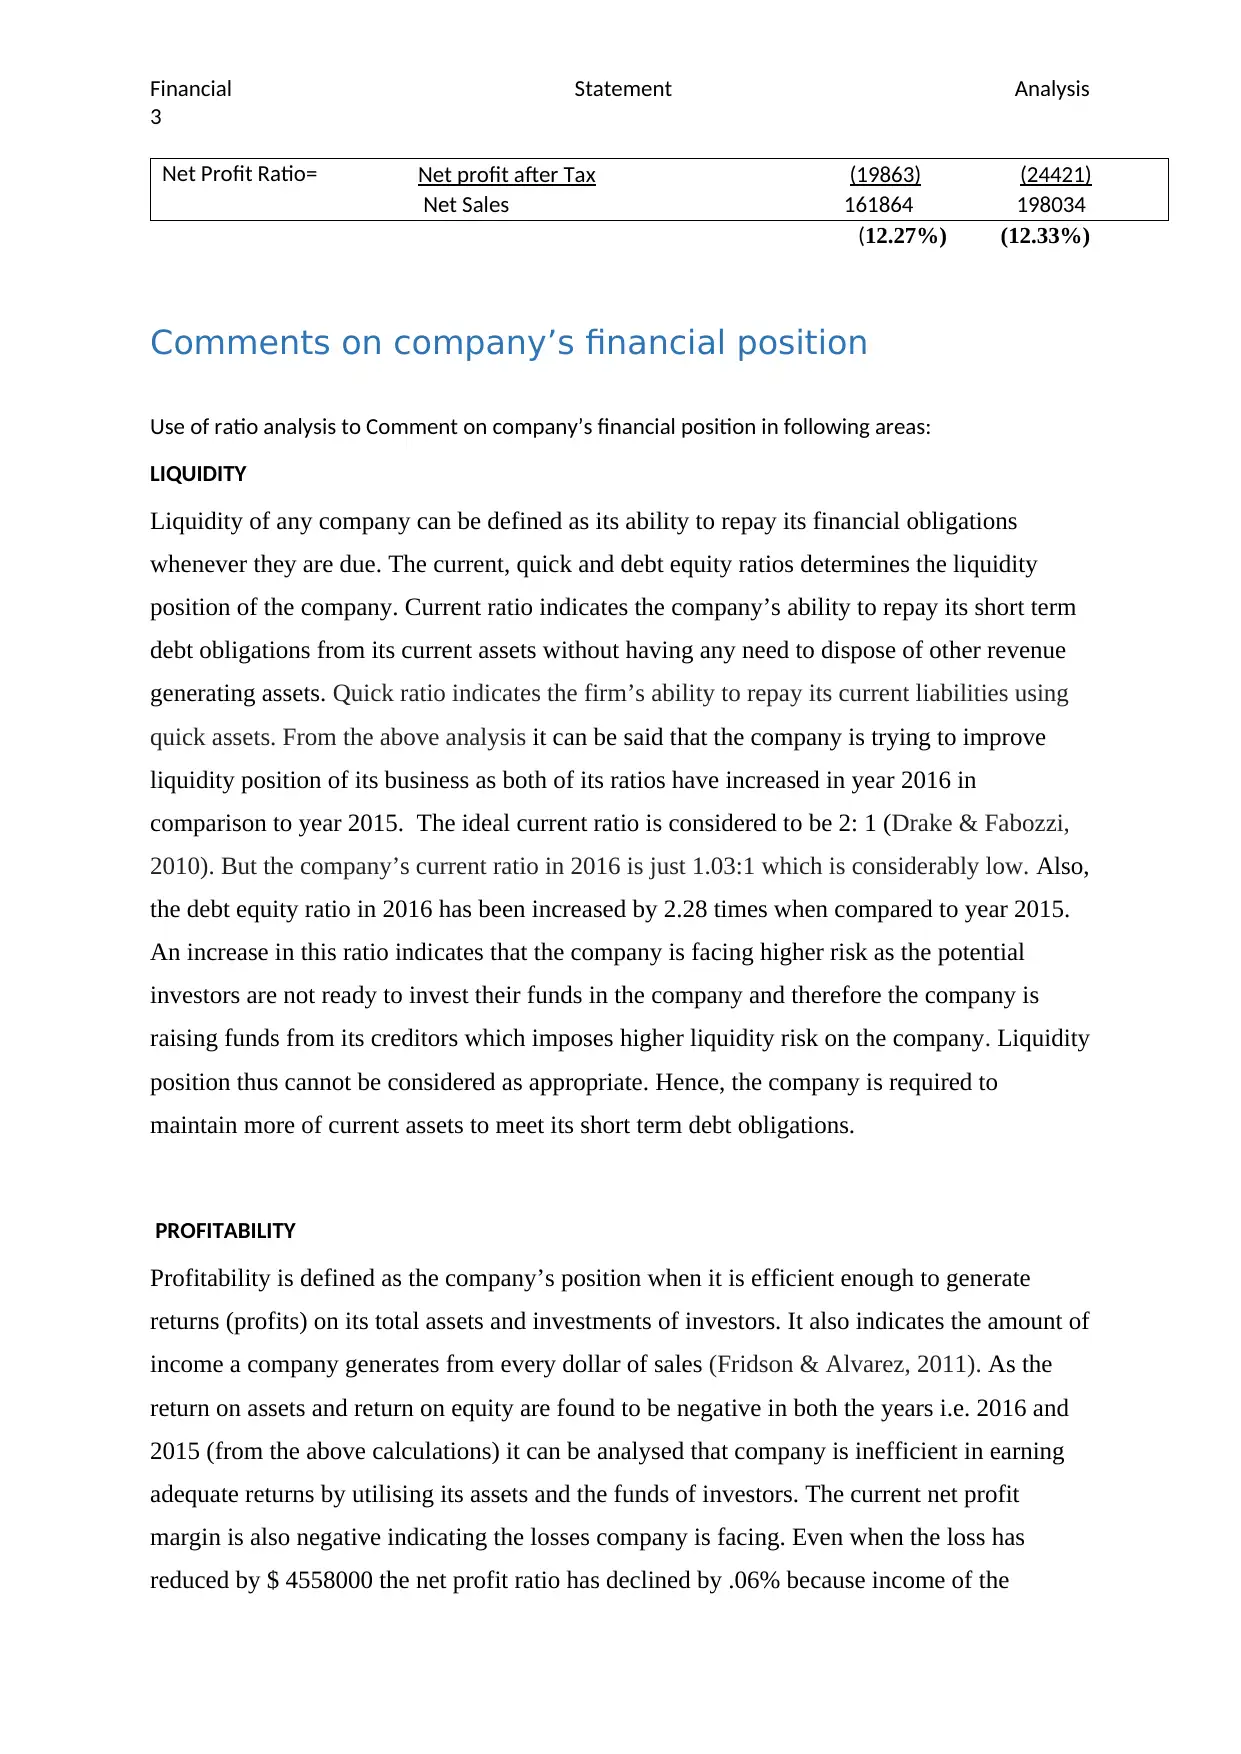
This report presents a comprehensive financial statement analysis of E&A Limited, focusing on the years 2015 and 2016. It utilizes various financial ratios, including current, quick, debt-equity, return on assets, return on equity, and net profit ratios, to assess the company's liquidity, profitability, solvency, and activity. The analysis reveals that E&A Limited experienced challenges in maintaining adequate liquidity, with a low current ratio and increasing debt-equity ratio, which is an indicator of high financial risk. The report also indicates poor profitability, with negative returns on assets and equity, as well as a negative net profit margin, suggesting that the company is inefficient in generating profits from its assets and investor funds. Furthermore, the solvency analysis highlights an increased reliance on creditors, which elevates the company's financial risk. The activity ratio analysis shows an improvement in the receivable turnover ratio, indicating better efficiency in converting credit sales into cash. The report concludes by discussing the impact of ratio analysis on the audit process, emphasizing its role in helping auditors understand financial performance and identify key areas for decision-making.
1 out of 8
Related Documents


Your All-in-One AI-Powered Toolkit for Academic Success.
+13062052269
info@desklib.com
Available 24*7 on WhatsApp / Email
![[object Object]](/_next/static/media/star-bottom.7253800d.svg)
Copyright © 2020–2026 A2Z Services. All Rights Reserved. Developed and managed by ZUCOL.