Financial Performance Evaluation: Sainsbury and M&S Comparison Report
VerifiedAdded on 2020/06/05
|19
|2331
|27
Report
AI Summary
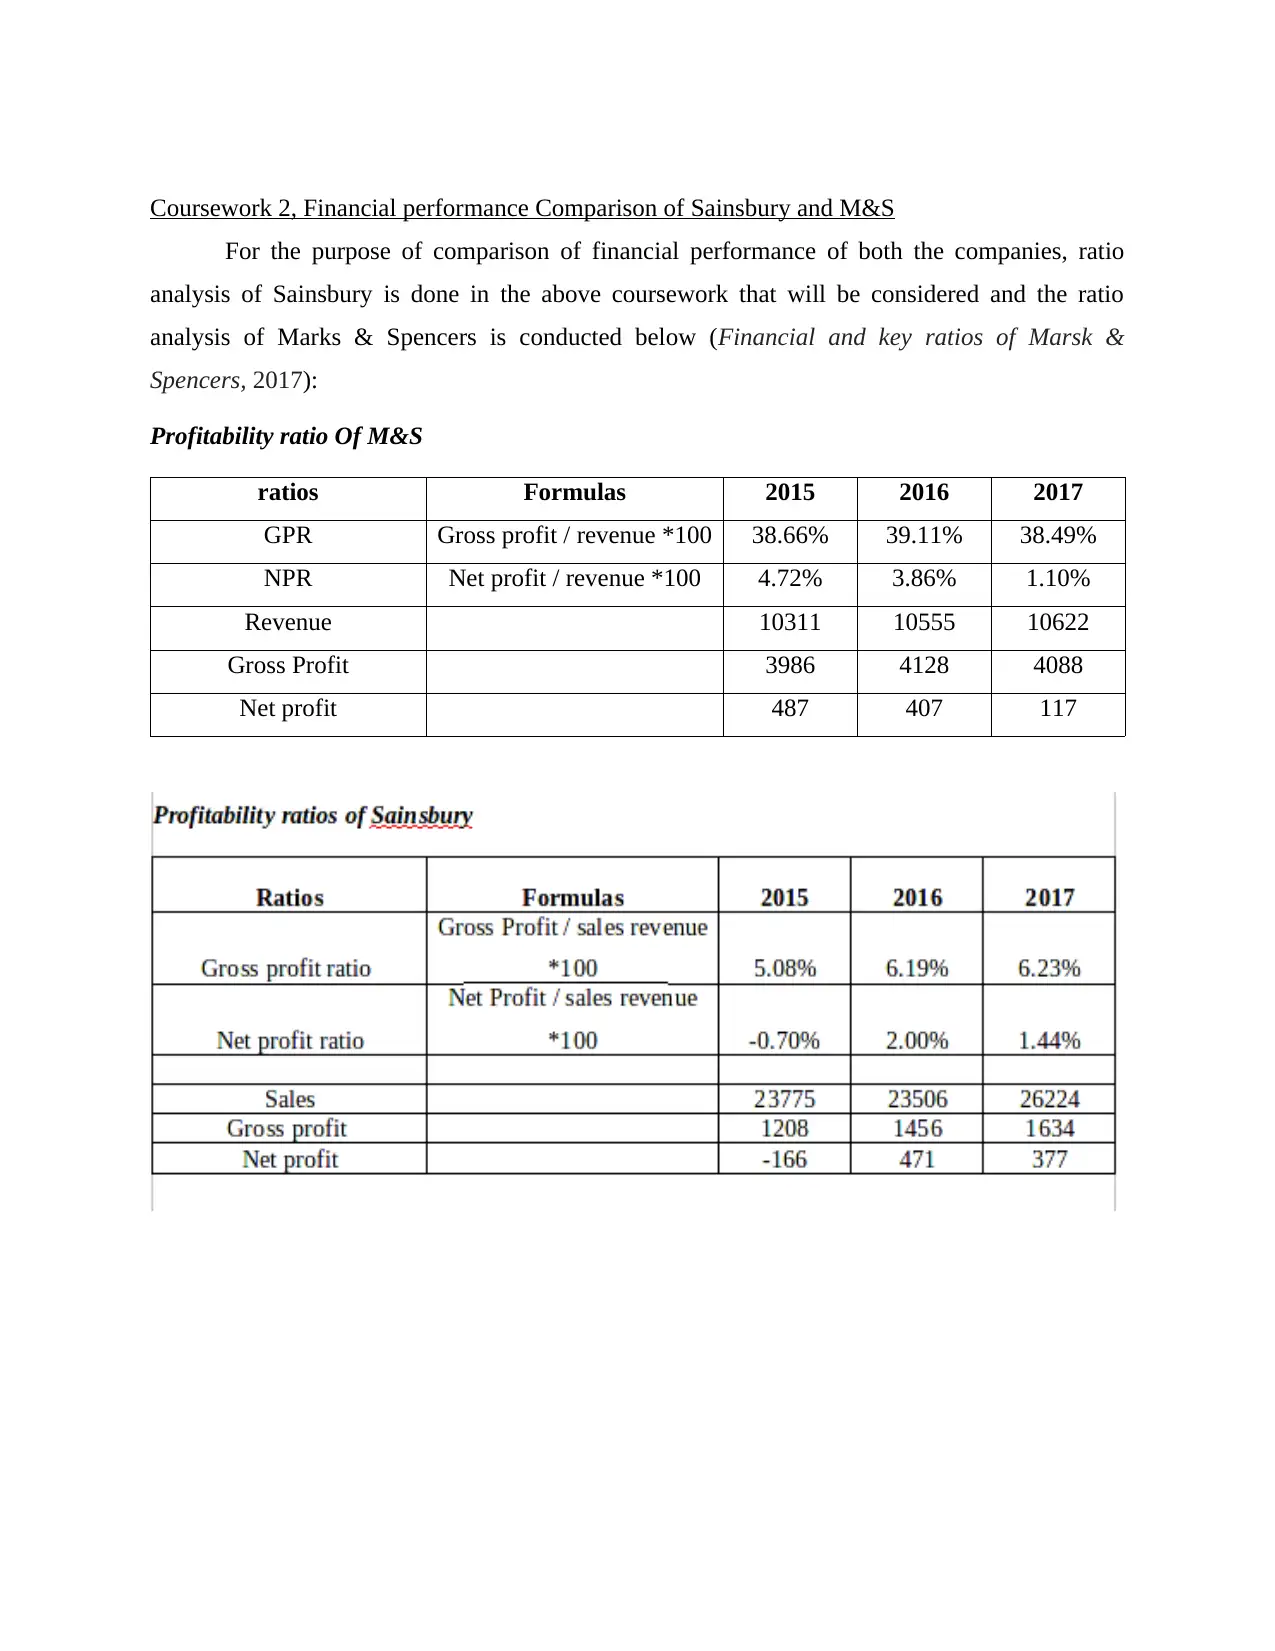
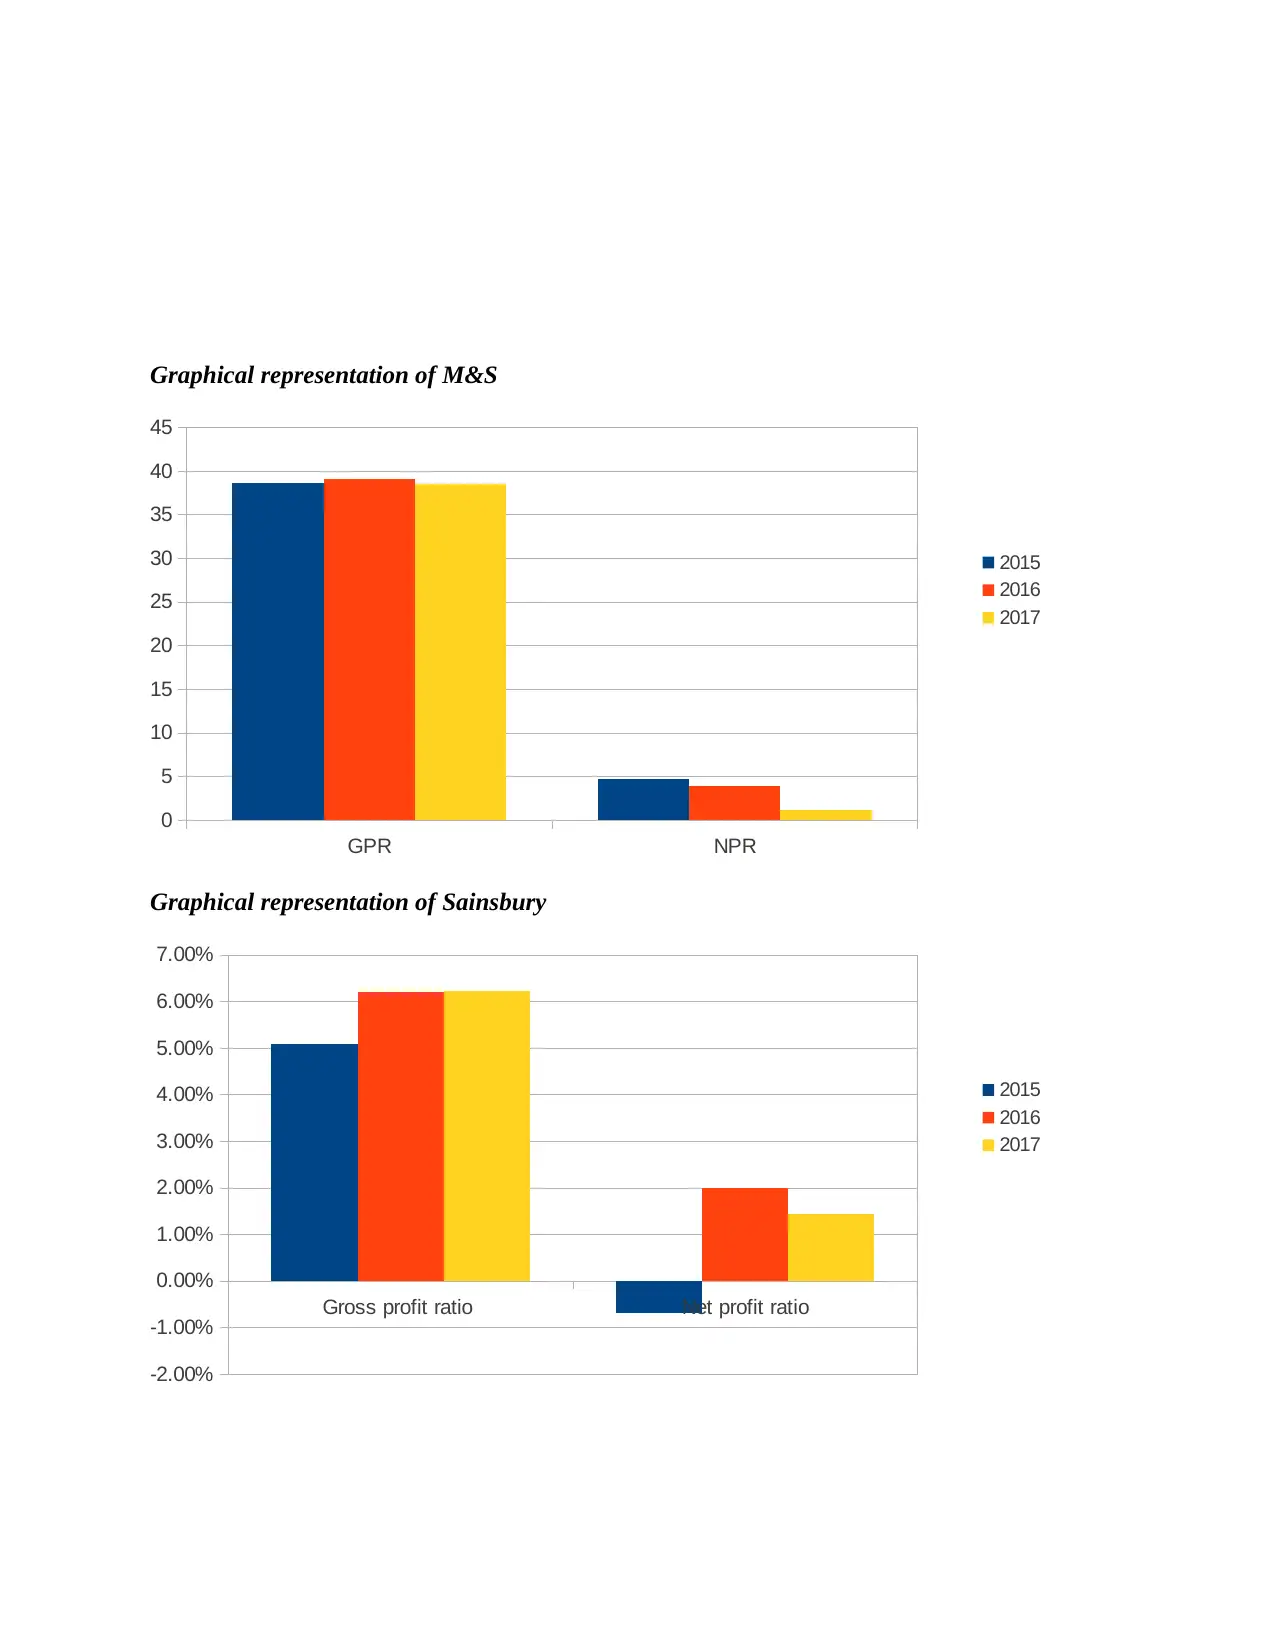
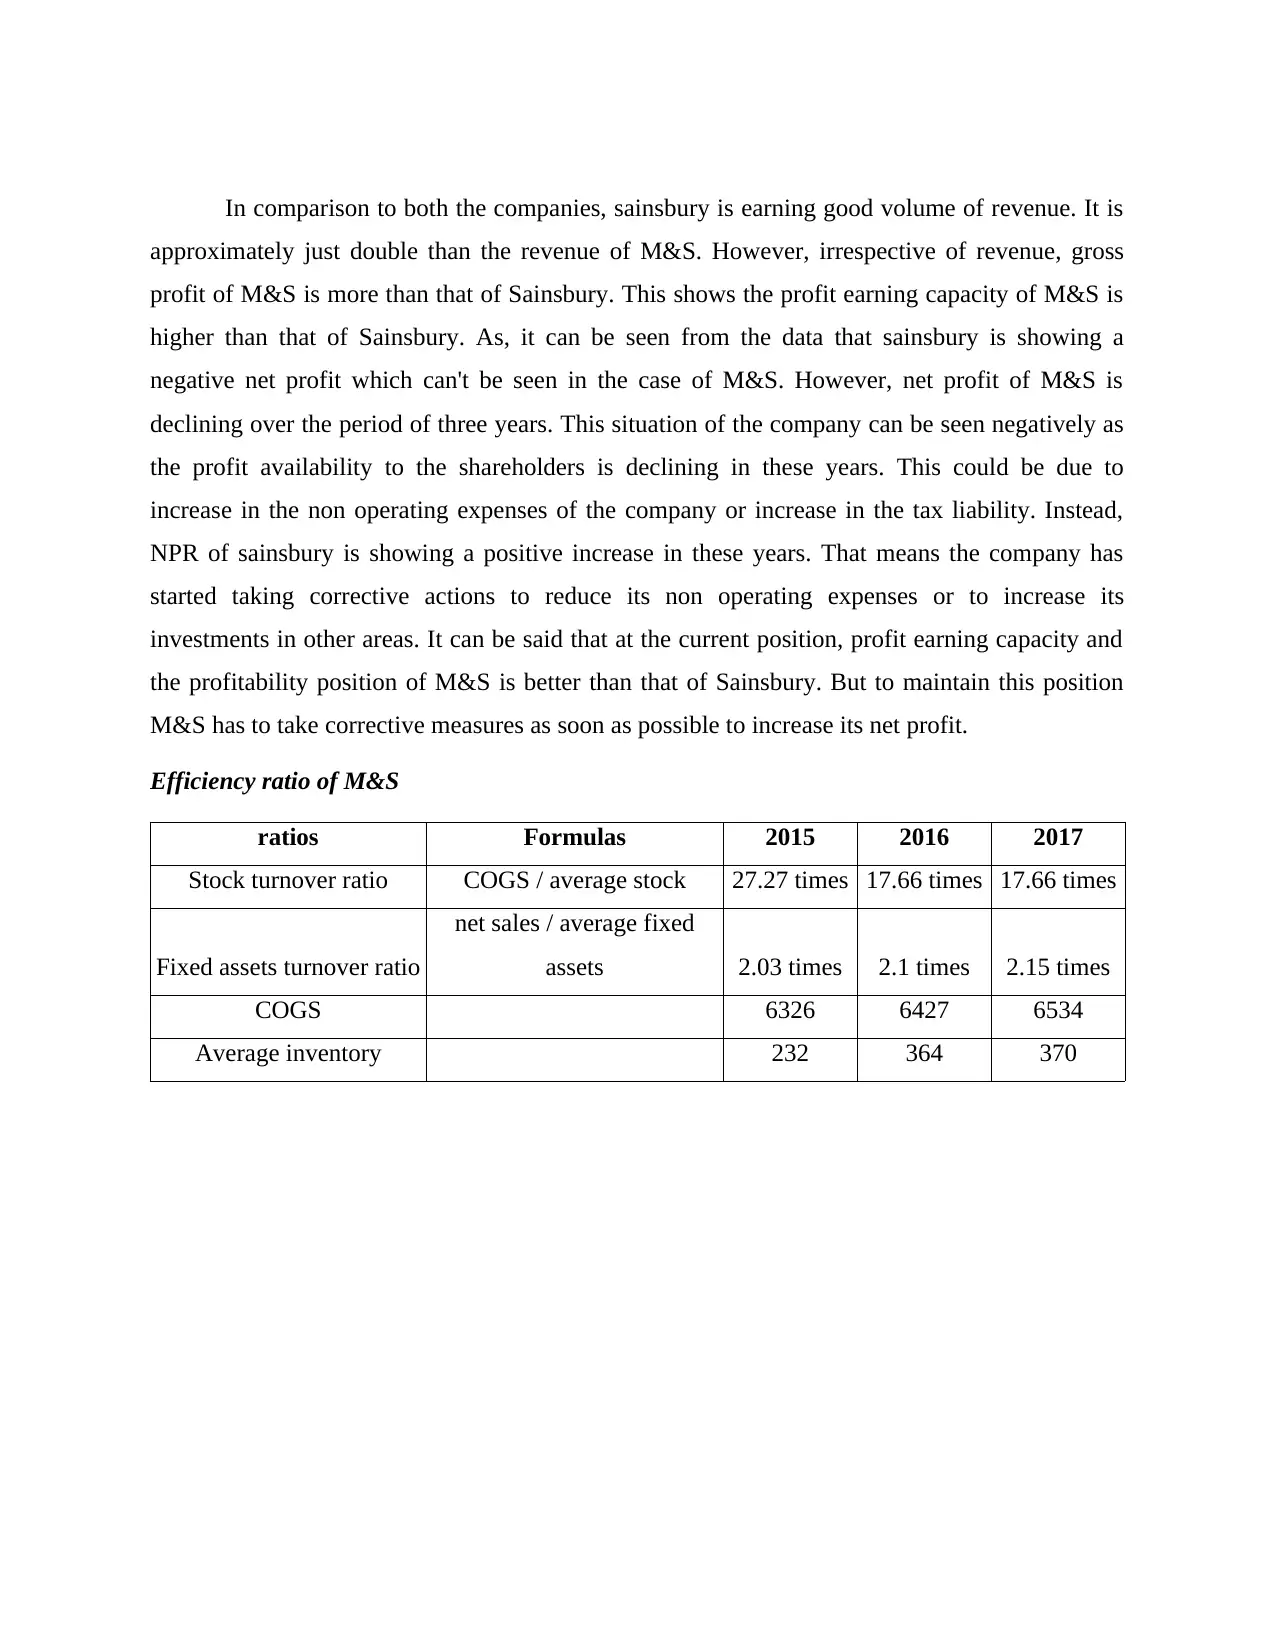
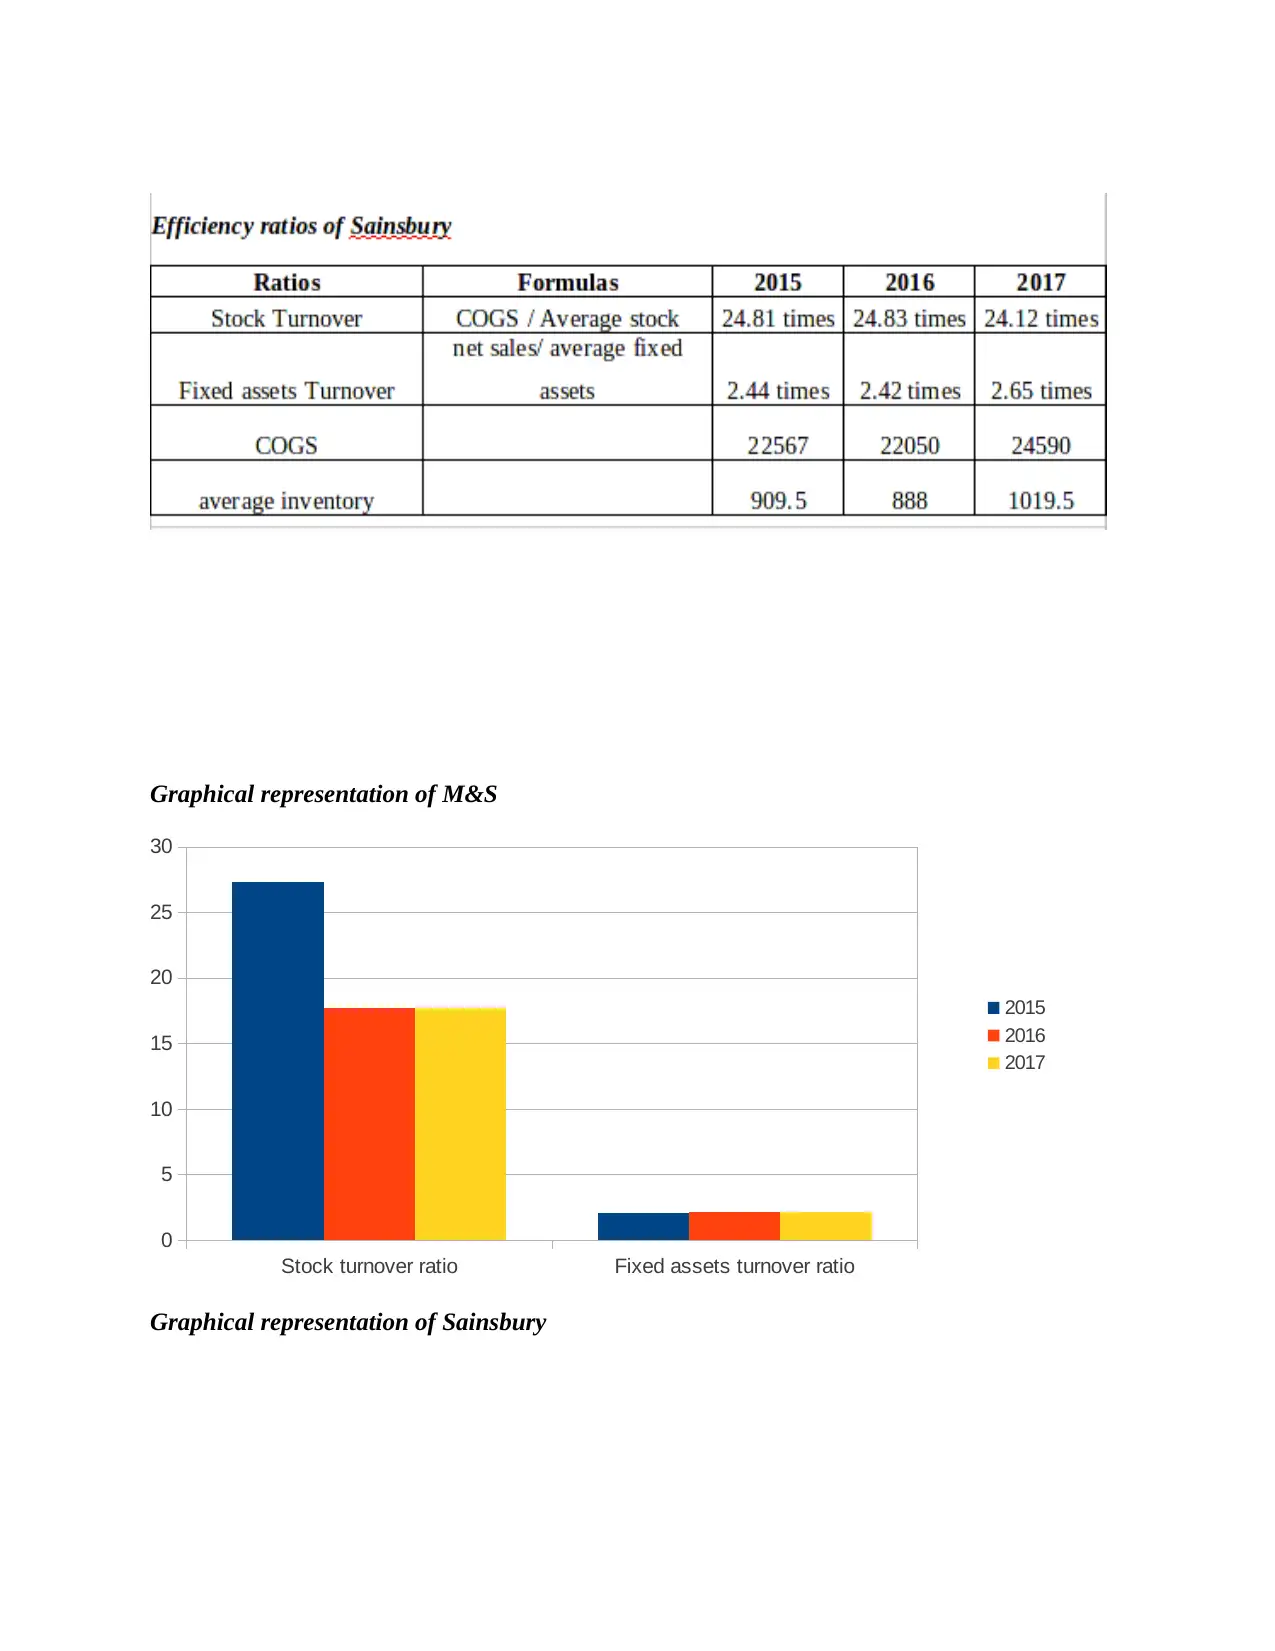
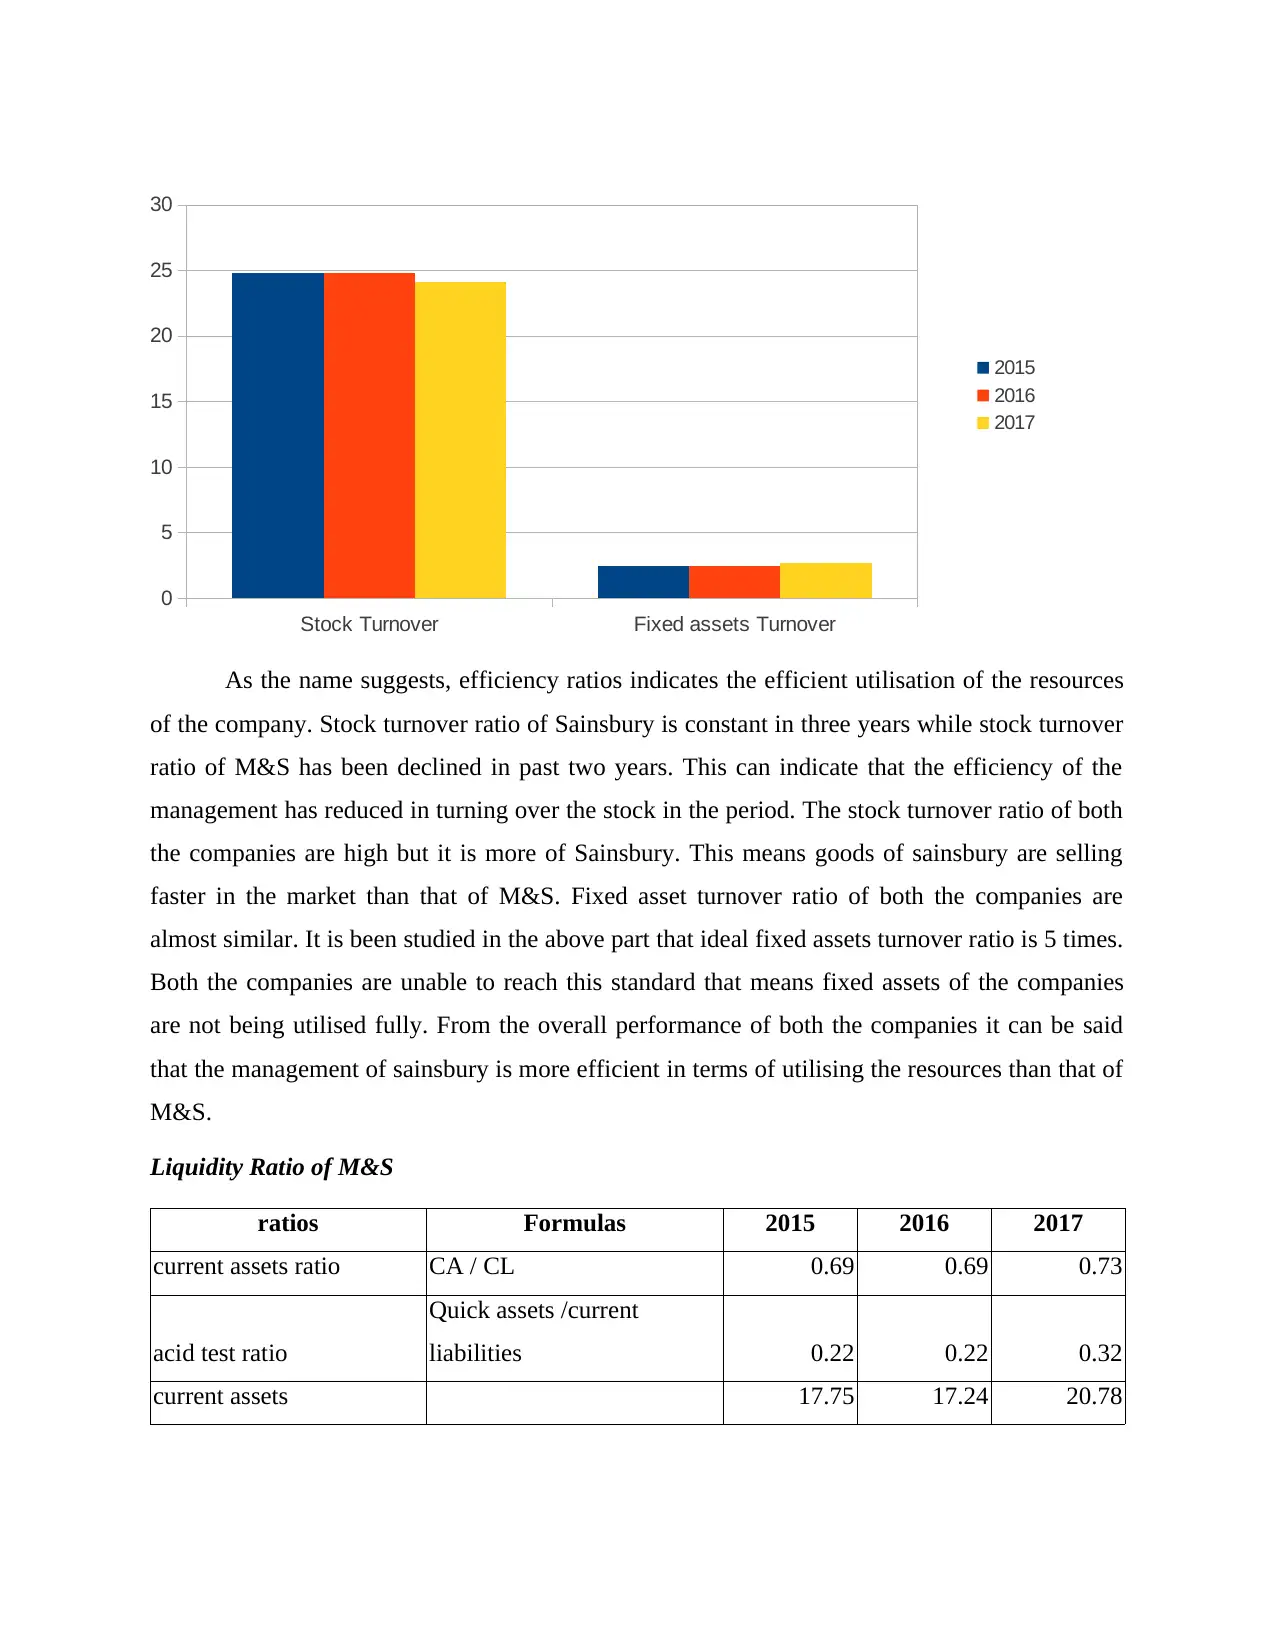
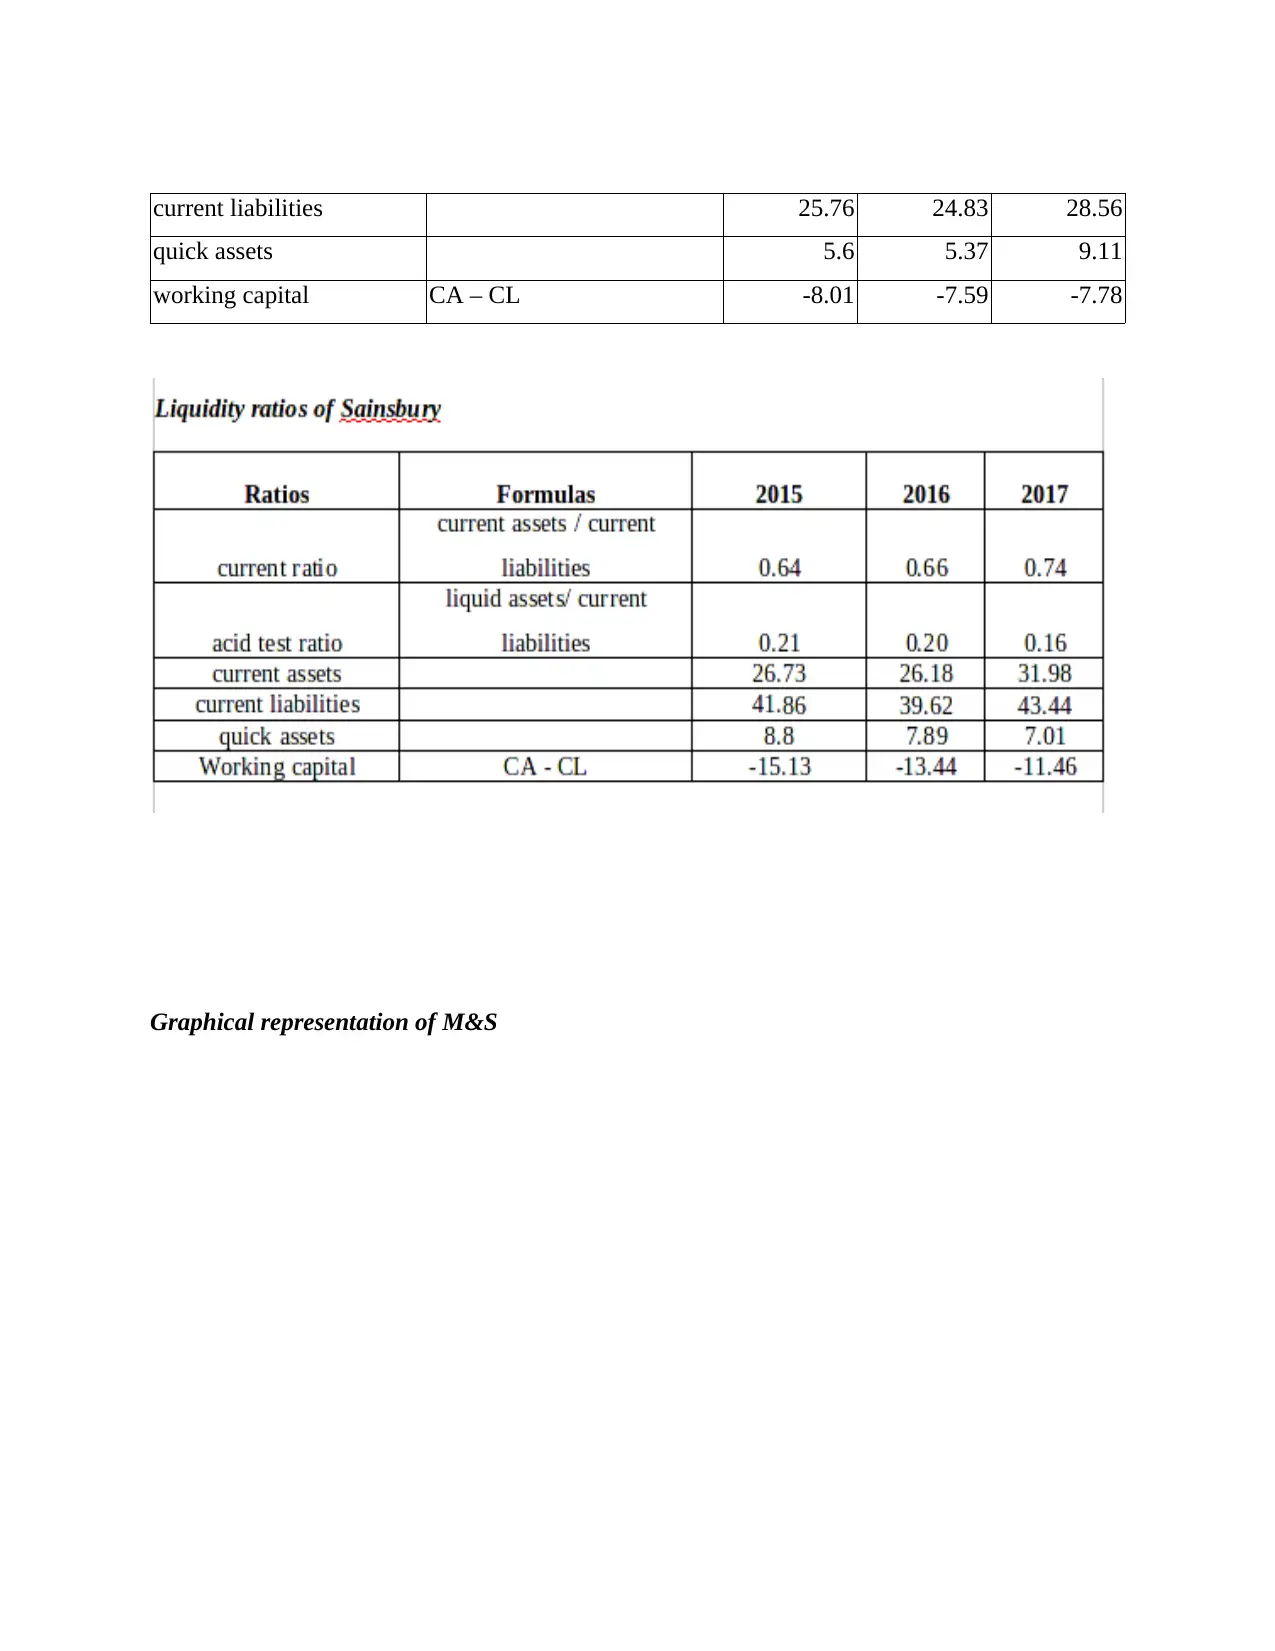
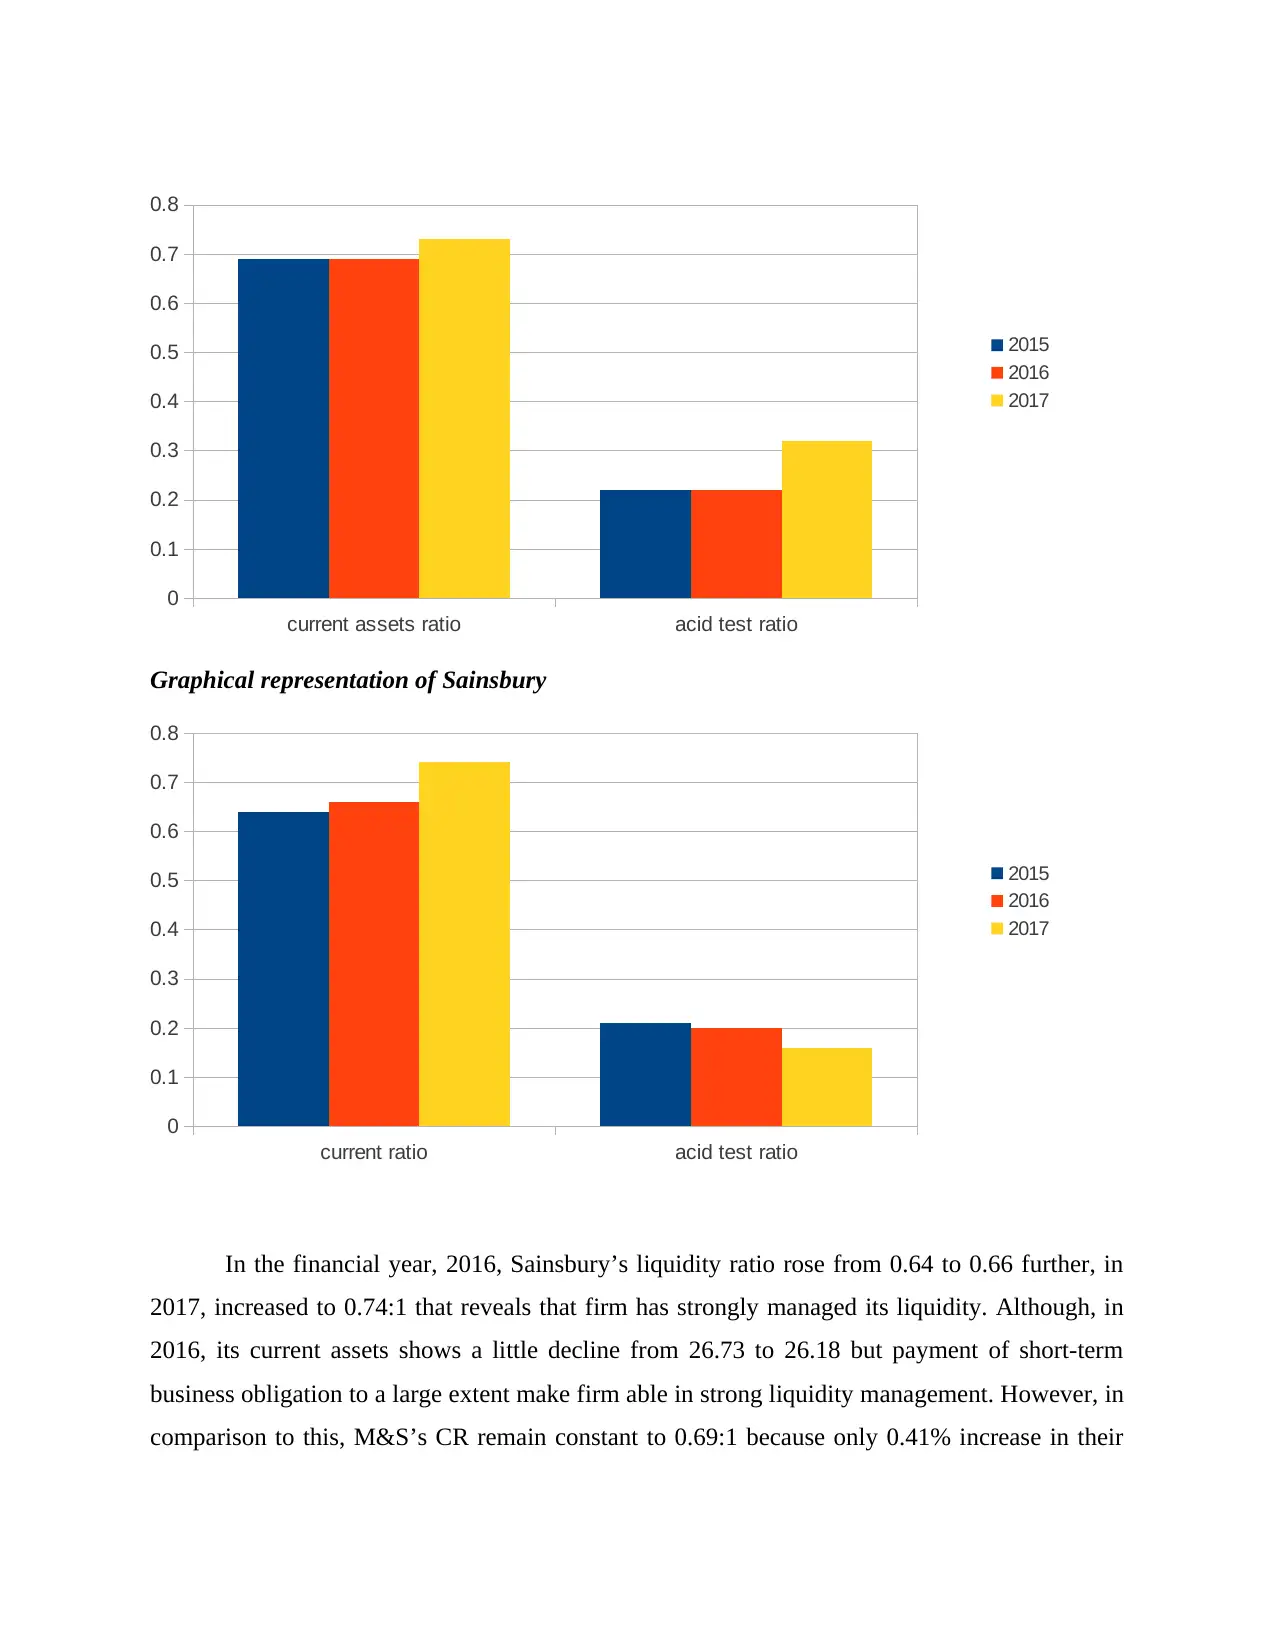
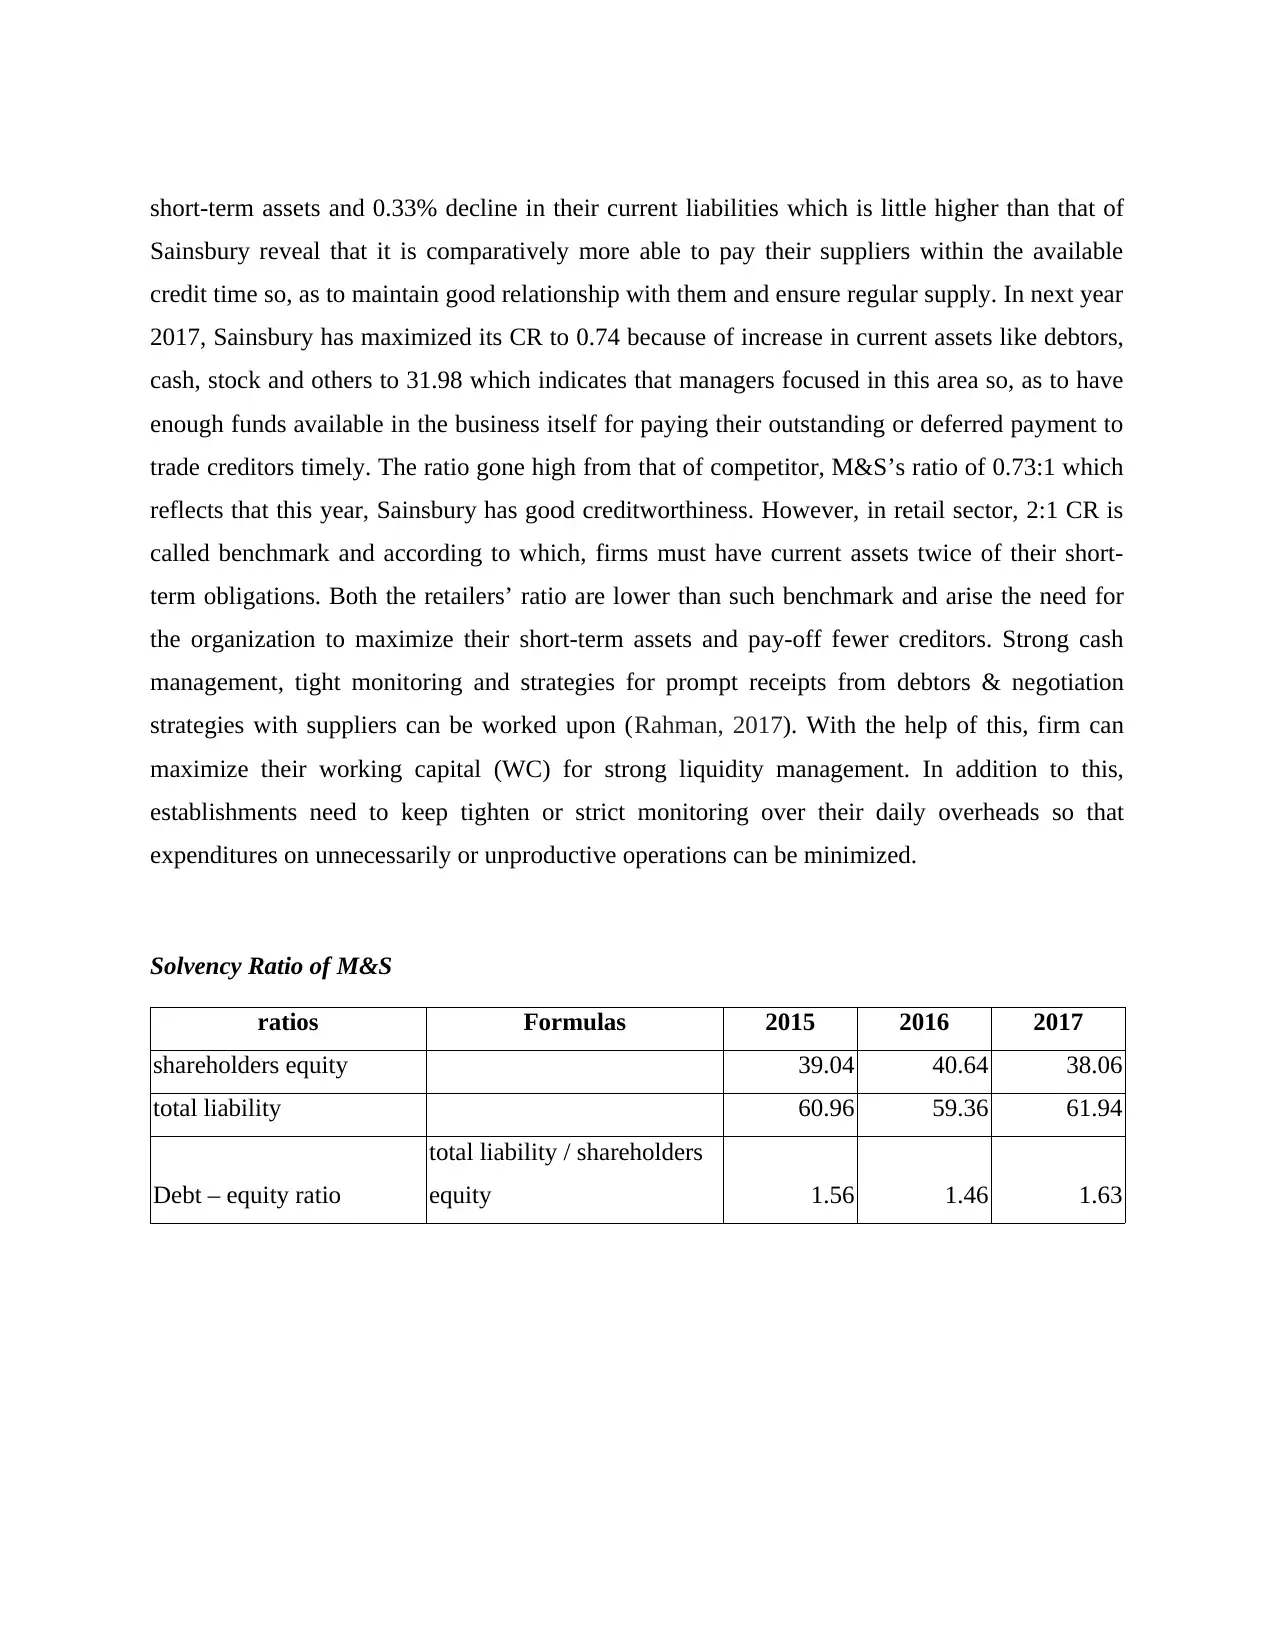
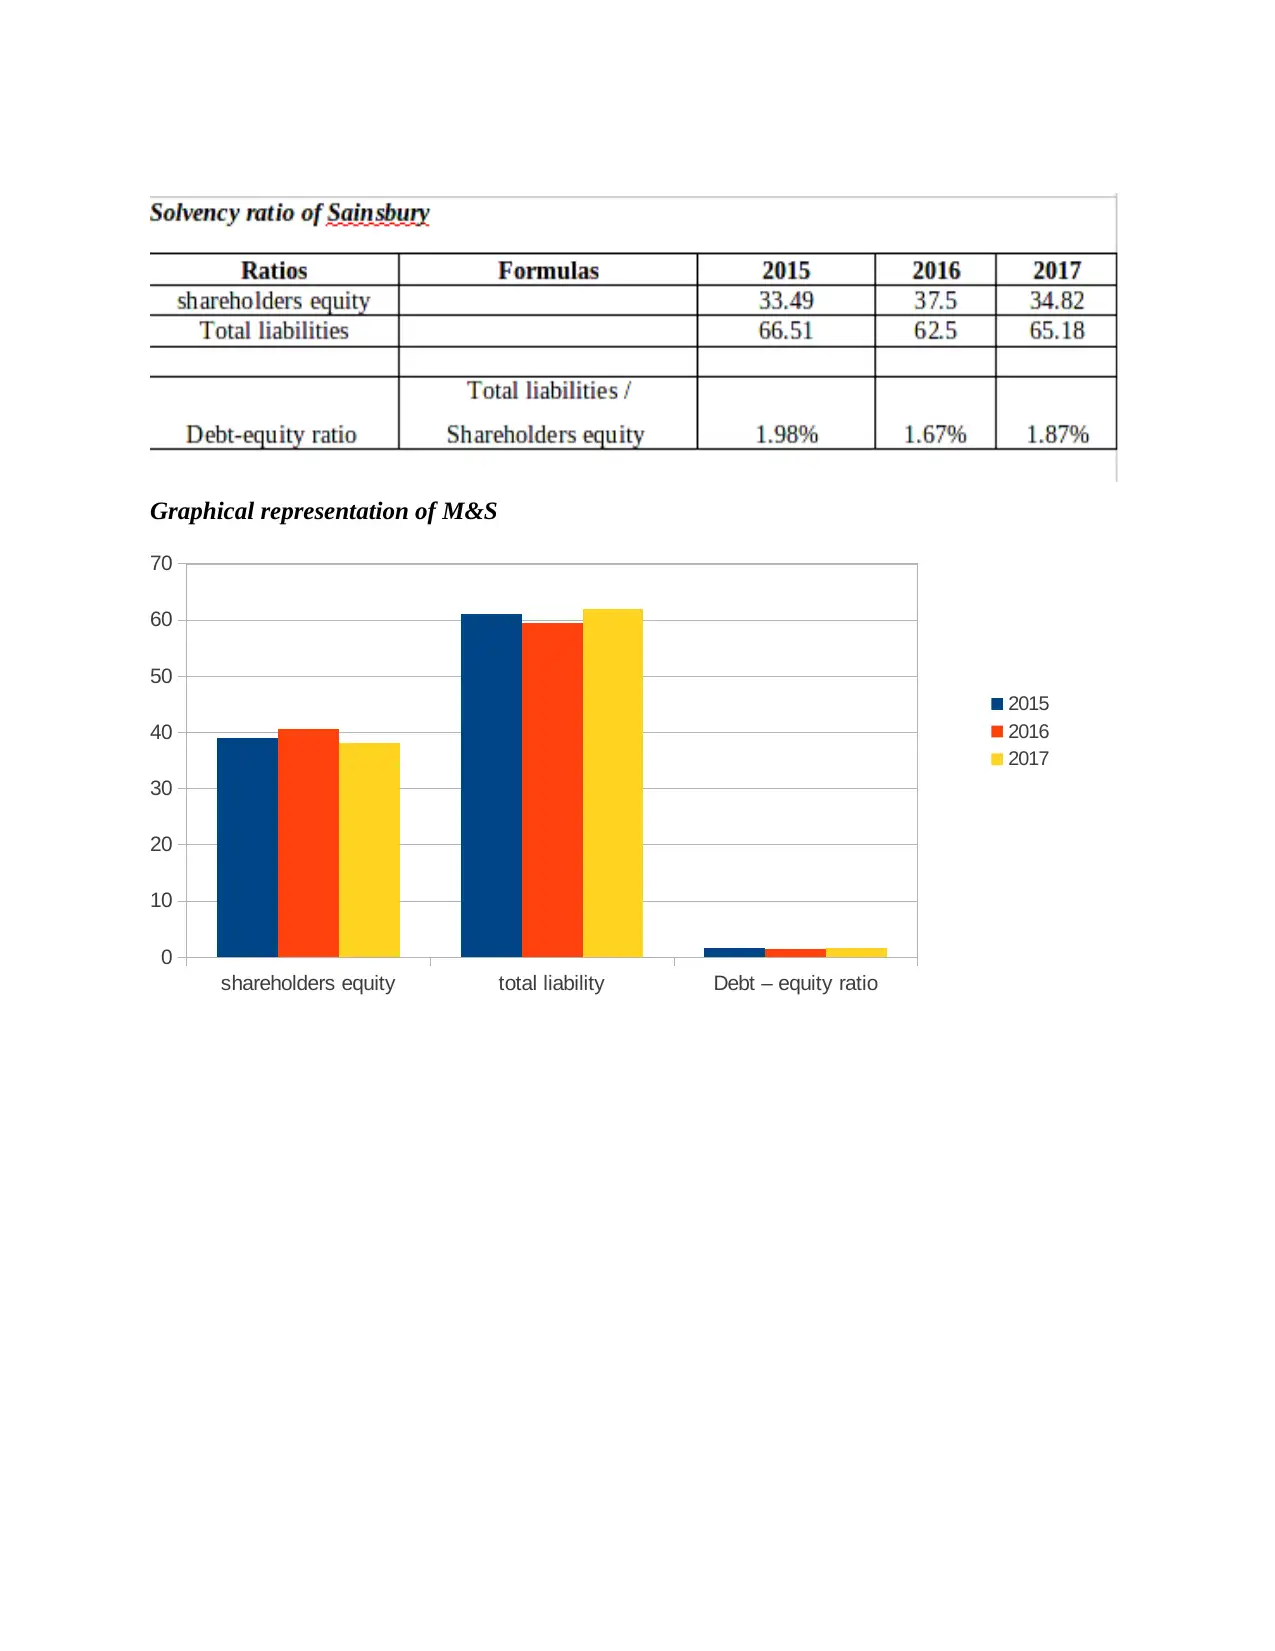
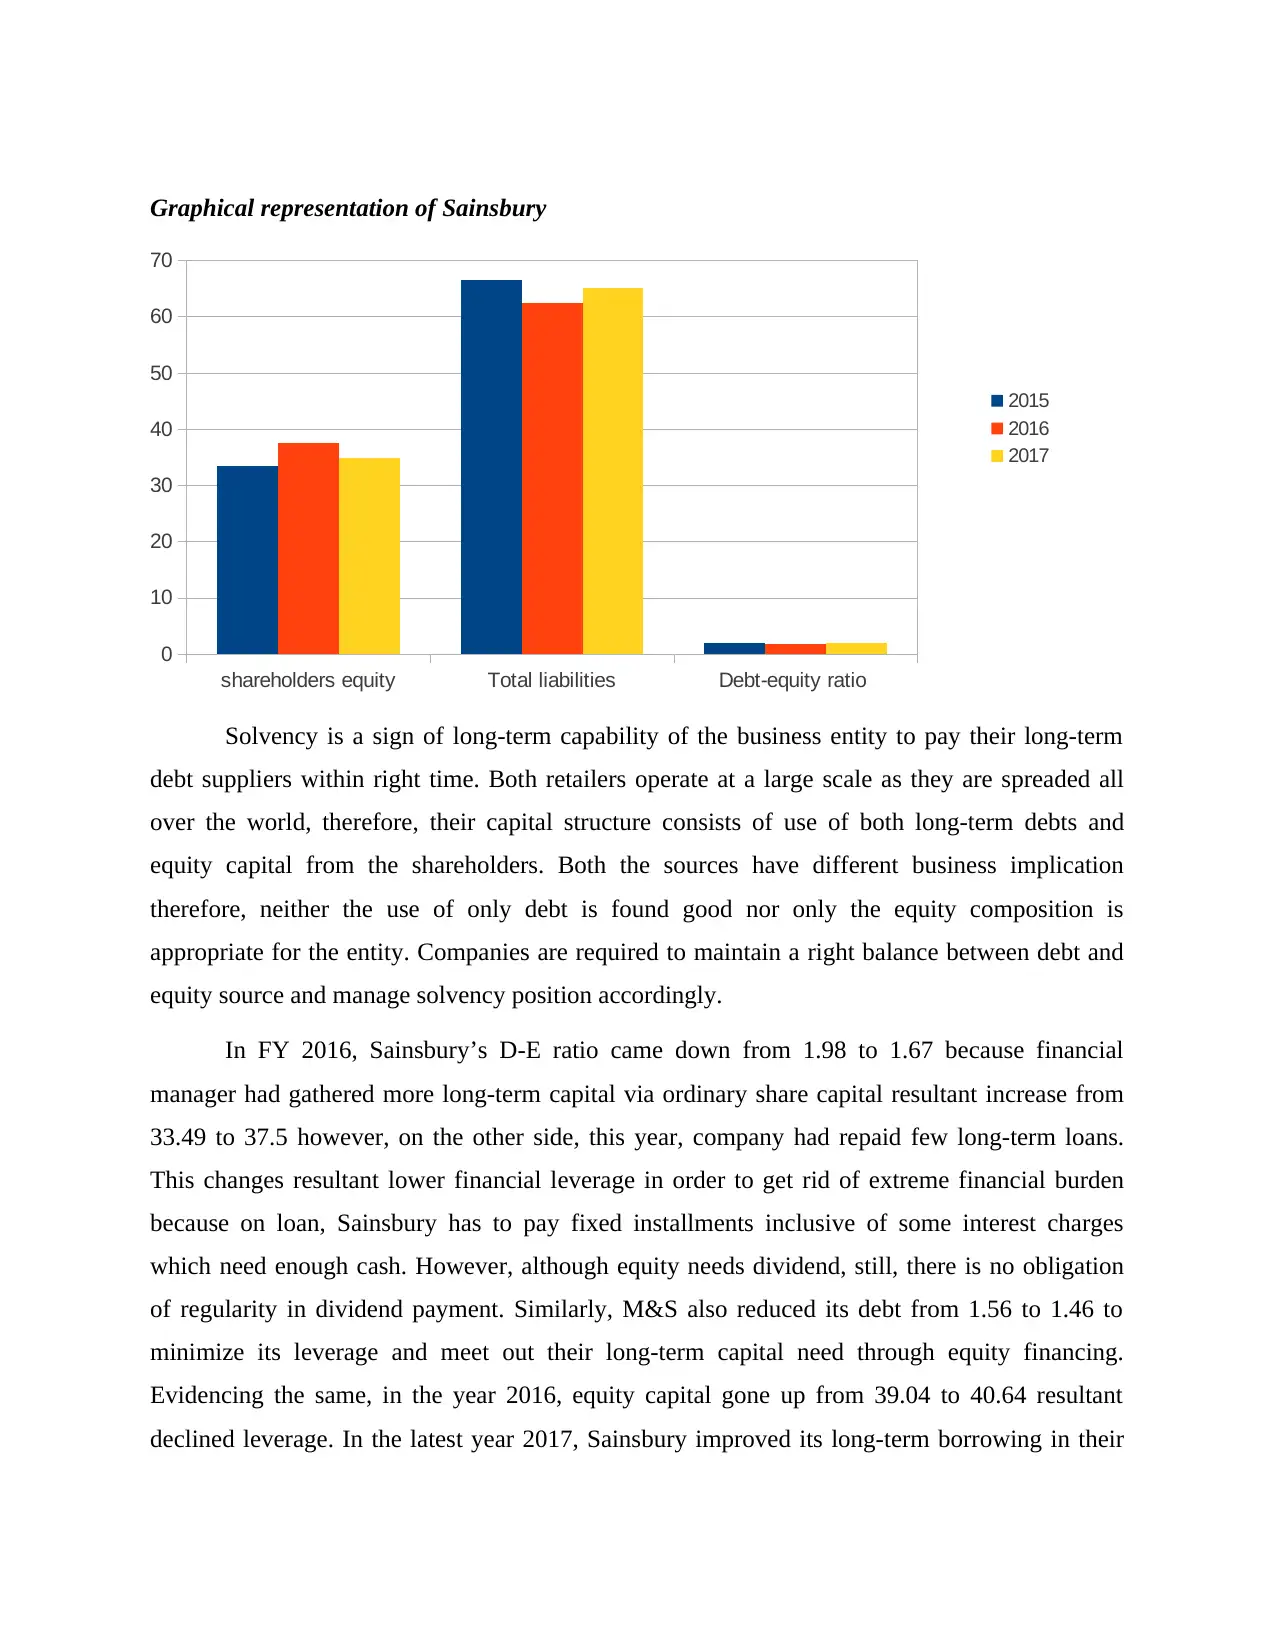
This coursework provides a comparative financial performance analysis of Sainsbury and Marks & Spencer (M&S). The analysis utilizes ratio analysis, including profitability, efficiency, liquidity, and solvency ratios, to evaluate the financial health of both companies. The report examines key financial metrics from 2015 to 2017, such as gross profit margin, net profit margin, stock turnover ratio, fixed asset turnover ratio, current ratio, acid test ratio, debt-equity ratio, return on capital employed, and return on assets. Graphical representations are used to illustrate the trends of these ratios. The analysis reveals that while Sainsbury generates a higher volume of revenue, M&S demonstrates superior gross profit and, in certain years, net profit. The report also discusses the efficiency of resource utilization, highlighting Sainsbury's stronger performance in stock turnover. Liquidity and solvency positions are assessed, with both companies needing to improve their current asset management and debt-equity ratios. The conclusion emphasizes the importance of financial statement analysis for effective business operations, future decision-making, and identifying areas for improvement. The report concludes that while both companies are financially sound, Sainsbury exhibits a stronger financial position compared to M&S, particularly in the later years examined.
1 out of 19
Related Documents


Your All-in-One AI-Powered Toolkit for Academic Success.
+13062052269
info@desklib.com
Available 24*7 on WhatsApp / Email
![[object Object]](/_next/static/media/star-bottom.7253800d.svg)
Copyright © 2020–2026 A2Z Services. All Rights Reserved. Developed and managed by ZUCOL.