L'Oréal S.A. Financial Statement Analysis: Ratios, Valuation Model
VerifiedAdded on 2023/06/14
|26
|4604
|483
Report
AI Summary
This report provides a comprehensive financial statement analysis of L’Oréal S.A., including an analyst’s tear sheet with stock recommendations. It covers industry analysis using PEST, competitor analysis using Porter’s Five Forces, and an overview of L’Oréal’s business model and corporate strategy. The report examines key corporate events, such as the acquisition of a vegan skincare brand, and summarizes L’Oréal’s financial performance from 2016 to 2020. It includes a detailed financial ratio analysis comparing L’Oréal to Revlon, along with company valuation using both multiples and discounted cash flow models, ultimately providing insights into the financial health and investment potential of L’Oréal.
FINANCIAL STATEMENT
ANALYSIS - COMPONENT
B
ANALYSIS - COMPONENT
B
Paraphrase This Document
Need a fresh take? Get an instant paraphrase of this document with our AI Paraphraser
Table of Contents
INTRODUCTION...........................................................................................................................3
Analyst’s tear sheet......................................................................................................................3
Company Profile..........................................................................................................................5
Industry Analysis.........................................................................................................................5
Competitors analysis....................................................................................................................6
L’Oréal Business model and corporate strategy..........................................................................7
Analysis of L’Oréal key corporate events and activities.............................................................7
Summary Analysis of L’Oréal Financial statement.....................................................................8
Financial ratio calculation of L’Oréal and Revlon along its interpretation and comparison.......8
Company Valuation using multiples model..............................................................................11
Cash Flow Model.......................................................................................................................12
CONCLUSION..............................................................................................................................13
REFERENCES................................................................................................................................1
Appendix..........................................................................................................................................3
Discounted cash flow value per share.........................................................................................3
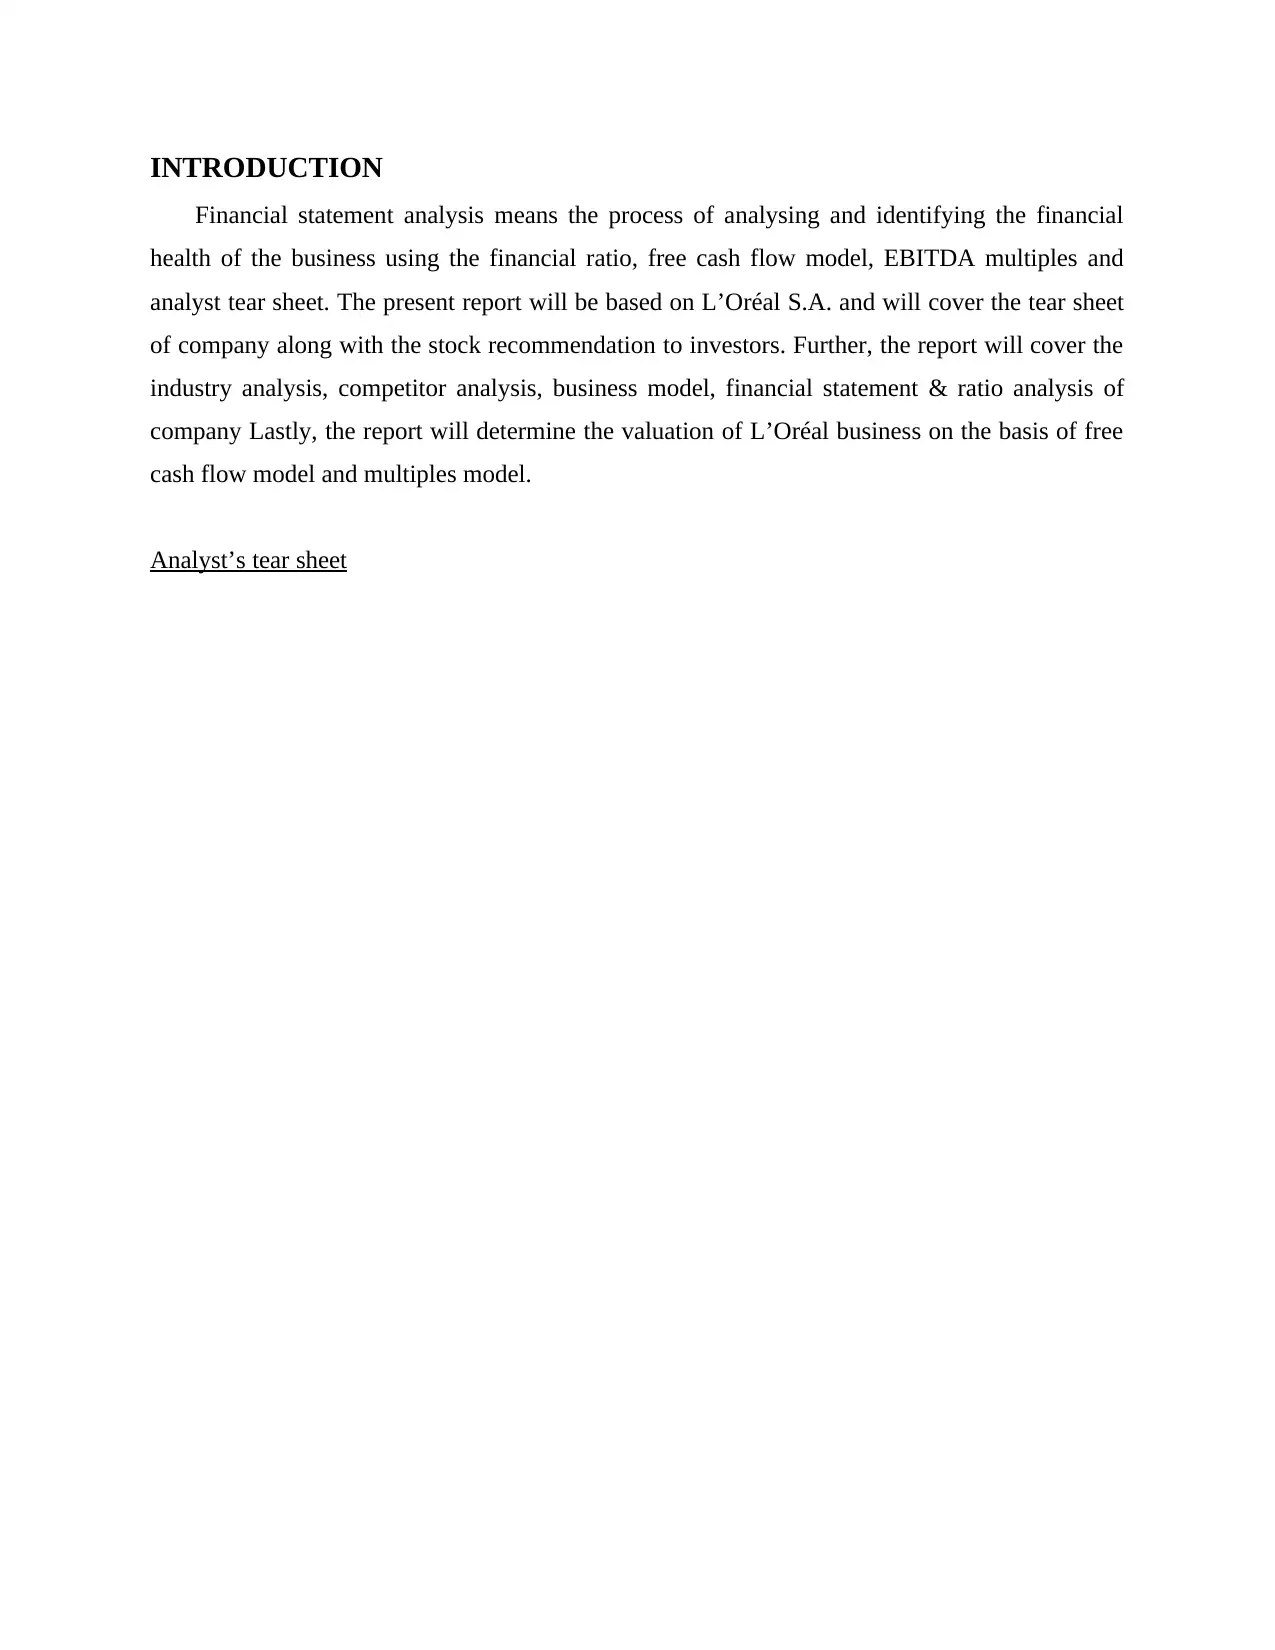
INTRODUCTION
Financial statement analysis means the process of analysing and identifying the financial
health of the business using the financial ratio, free cash flow model, EBITDA multiples and
analyst tear sheet. The present report will be based on L’Oréal S.A. and will cover the tear sheet
of company along with the stock recommendation to investors. Further, the report will cover the
industry analysis, competitor analysis, business model, financial statement & ratio analysis of
company Lastly, the report will determine the valuation of L’Oréal business on the basis of free
cash flow model and multiples model.
Analyst’s tear sheet
⊘ This is a preview!⊘
Do you want full access?
Subscribe today to unlock all pages.
Trusted by 1+ million students worldwide
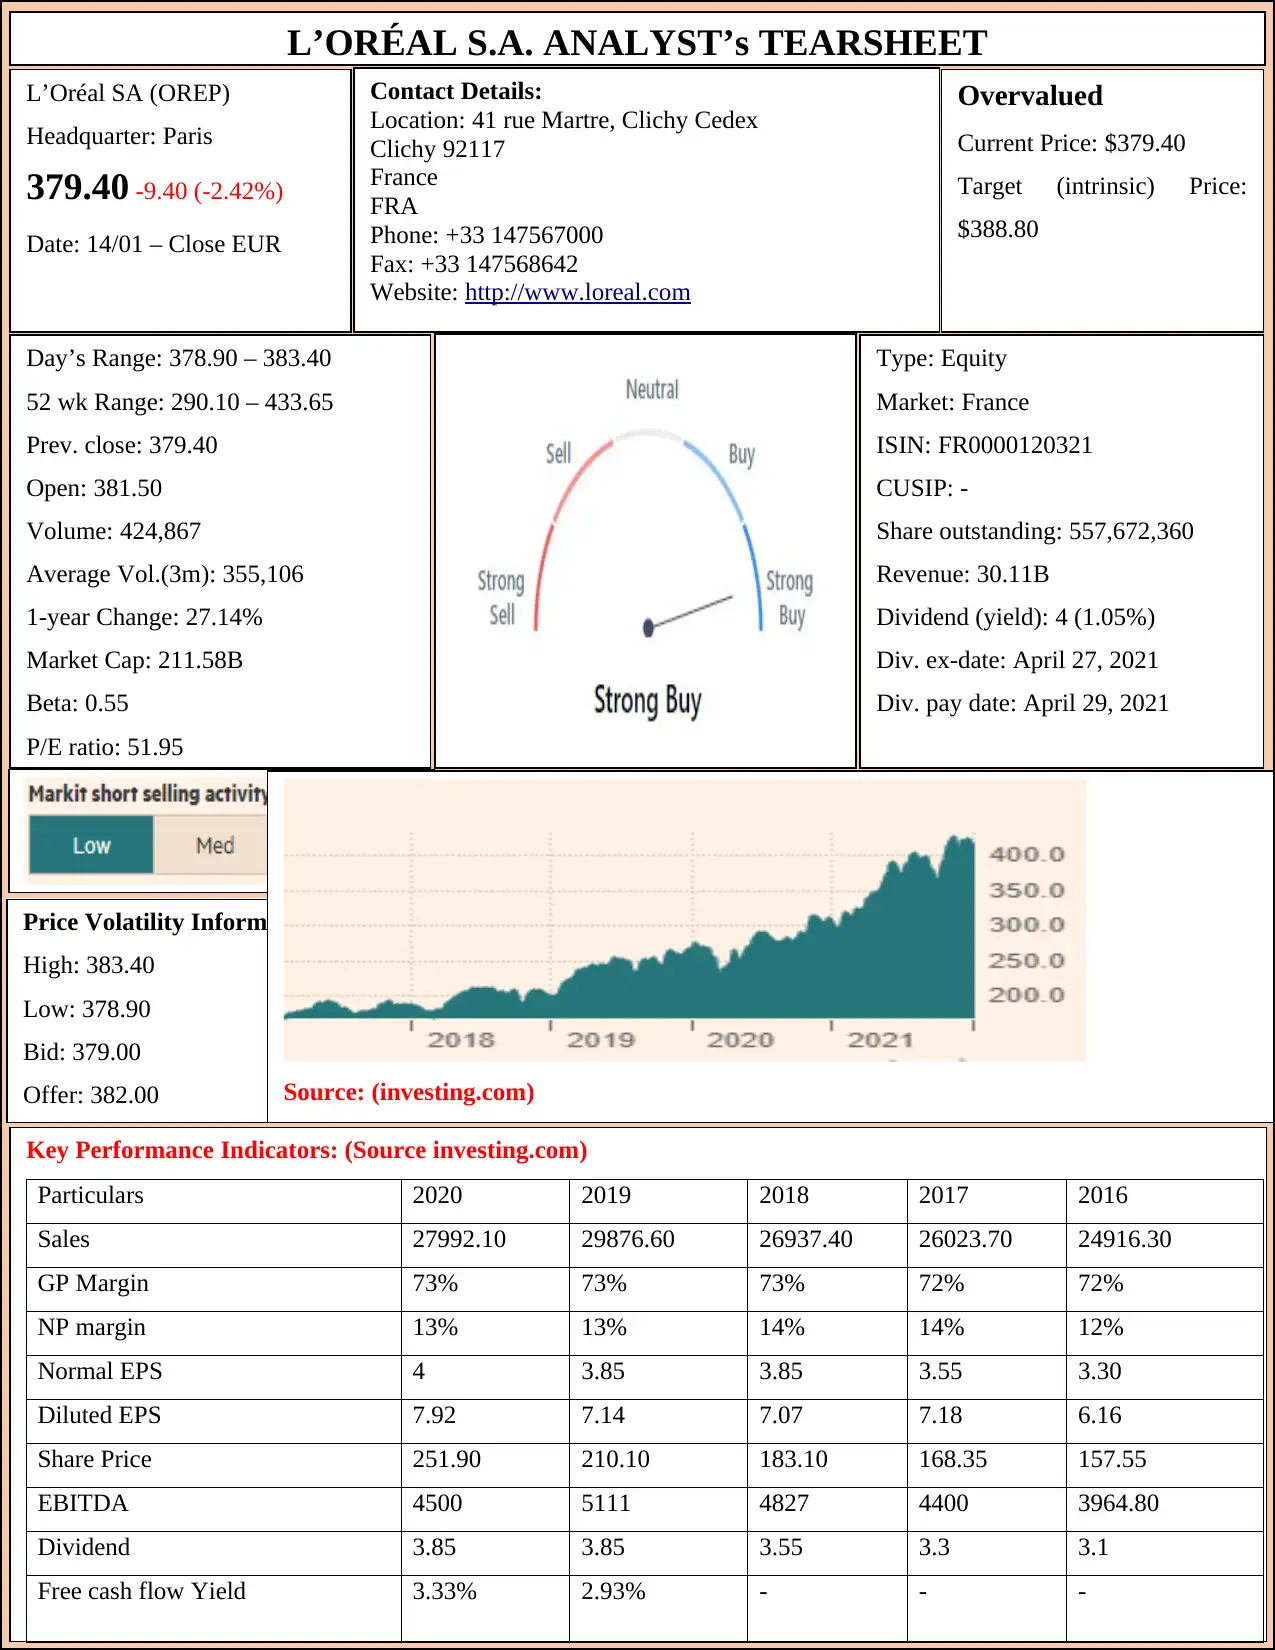
L’ORÉAL S.A. ANALYST’s TEARSHEET
L’Oréal SA (OREP)
Headquarter: Paris
379.40 -9.40 (-2.42%)
Date: 14/01 – Close EUR
Overvalued
Current Price: $379.40
Target (intrinsic) Price:
$388.80
Day’s Range: 378.90 – 383.40
52 wk Range: 290.10 – 433.65
Prev. close: 379.40
Open: 381.50
Volume: 424,867
Average Vol.(3m): 355,106
1-year Change: 27.14%
Market Cap: 211.58B
Beta: 0.55
P/E ratio: 51.95
Type: Equity
Market: France
ISIN: FR0000120321
CUSIP: -
Share outstanding: 557,672,360
Revenue: 30.11B
Dividend (yield): 4 (1.05%)
Div. ex-date: April 27, 2021
Div. pay date: April 29, 2021
Price Volatility Information
High: 383.40
Low: 378.90
Bid: 379.00
Offer: 382.00 Source: (investing.com)
Key Performance Indicators: (Source investing.com)
Particulars 2020 2019 2018 2017 2016
Sales 27992.10 29876.60 26937.40 26023.70 24916.30
GP Margin 73% 73% 73% 72% 72%
NP margin 13% 13% 14% 14% 12%
Normal EPS 4 3.85 3.85 3.55 3.30
Diluted EPS 7.92 7.14 7.07 7.18 6.16
Share Price 251.90 210.10 183.10 168.35 157.55
EBITDA 4500 5111 4827 4400 3964.80
Dividend 3.85 3.85 3.55 3.3 3.1
Free cash flow Yield 3.33% 2.93% - - -
Contact Details:
Location: 41 rue Martre, Clichy Cedex
Clichy 92117
France
FRA
Phone: +33 147567000
Fax: +33 147568642
Website: http://www.loreal.com
Paraphrase This Document
Need a fresh take? Get an instant paraphrase of this document with our AI Paraphraser
Company Profile
L’Oréal SA is one of the largest cosmetic company of UK having headquarter in Clichy,
France with a register office in Paris. The company is basically a French personal care company
that focus on various segment products such as hair colour, skin care, sun protection, make-up,
perfumes and hair care. The company operates in cosmetic industry and serve its both local as
well as international customers. Presently, the company operates in more than 150 countries
which is consider as their large geographical segment. The total number of employees work with
L’Oréal is around 88000 as per 2020 annual report. Further, in the year 2021, the company has
announced the acquisition of Vegan skin care brand in order to increase their business segment
and attract more and more customers. The financial health of the company is best and growing
day by day. The operating profit, revenue, net profit of the company in the year 2021 is €2672.80
million, 15196.60 million and 2362.60 million respectively which is higher than the previous
year i.e., 2020 figures (AREAS, 2018). This means that after Covid-19, company again come on
their growing track. The company have various mergers and acquisitions which help them
existing their business in the competitive market and taking advantage of higher sales and
customer base.
Industry Analysis
In order to analyse the industry in which L’Oréal company operates, the PEST analysis tool
is used. The PEST analysis of cosmetic industry is as follows:
Political: This factor denotes the political stability etc. impact over the cosmetic
industry. Different country has their own rules and regulation which affects the industry
as well as company. Because of brexit and Covid-19, the sales of the company has
showed vast decline which also affect its profitability and financial health. The political
factor is creating threat for the cosmetics industry and L’Oréal company (Gassama,
2020).
Economical: This includes the economic stability and people income factor impact over
industry and company. After covid-19, the income of the consumers has shifted their
purchasing criteria to basic goods from luxury and unnecessary goods. Along with the
trade war between China and USA has also causes decrease in the demand of L’Oréal
products.
Social: In the present time, people all over the world love to show off which helps the
cosmetic industry in the increase of their demand. The impact of which the sales of the
L’Oréal company has also increase because company provides products as per the taste
and preference of consumers (Eriksrød, 2018).
Technological: The technology is increasing day by day and consumer prefer more
digital and online shopping rather than offline shopping. The industry and cosmetics
companies such as L’Oréal has adopted digital platform to connect with the customer is
an opportunity for them which leads to increase in customer base.
Competitors analysis
The competitor’s analysis of cosmetics industry using the Porter five forces model are as
follows:
Buyer Power: The power of buyer over cosmetics is weak because they have little
influence on price and products. Thus, L’Oréal are able to offer high price for the
products as well negotiate for pricing with other companies.
Supplier Power: The bargaining power of supplier over the supply of raw material to
cosmetics companies are also weak. It is because the number of suppliers of cosmetics
such as beauty and personal care products are high and switching cost is also expensive
(Ndirangu, 2019).
Threat of new Entrants: The number of firms that produces similar cosmetics products
are low in the market thus the threat of new entrants is also low. L’Oréal is highly
affected with this factor because their market share will get increase with low threat of
new entrants.
Threat of substitute: The threat of substitute products is high in cosmetics industry
because there are many firms which produces same personal and skin care products
which is produces by L’Oréal. The impact of which they are facing the risk of losing their
sales and customer base (Galetić and Požega, 2019).
Degree of rivalry: The degree of rivalry is high in the case of cosmetics industry because
the number of competitors in the industry are increasing day by day. As the switching
cost for consumer are quite low thus they can easily shift to new and other competitors
which is a risk for L’Oréal.
⊘ This is a preview!⊘
Do you want full access?
Subscribe today to unlock all pages.
Trusted by 1+ million students worldwide
L’Oréal Business model and corporate strategy
The corporate strategy adopted by L’Oréal is unique which is known as Universalization
means the company uses the globalization and understand the needs, traditions, desires of its
customers before selling any product. The strategy of company is to help millions of women and
men in getting their desire skin via their five branches. The company generates 29.9 billion euro
sales which is from 35% skincare segment, 26% make-up, 15% hair care, 10% hair collaring and
5% fragrances (Leppänen, George and Alexy, 2021). The business model of L’Oréal is based on
five pillars which are as follows:
The R&D of company worth around 1 billion euros.
The innovation of company contributes 15% annual sales of business.
The company release every year a new product for its customers.
The company is one of the leading national and international brand.
It also focusses on e-commerce to increase its sales.
Analysis of L’Oréal key corporate events and activities
One of the key and significant event and activities of L’Oréal is announcement of
acquisition of vegan skin care brand in the December 2021. The company has signed an
agreement to acquire Youth to the People company of California skincare brand. This is an
important event for the company because with the help of this acquisition the company able to
attract US, Canada, Australia and other European countries customer (Albert and et.al., 2021).
The acquisition event is quite profitable to company as they able to provide vegan skin care
products to its customers which are highly demanded by customers.
Summary Analysis of L’Oréal Financial statement
On the basis of the analysis of L’Oréal financial statement, it is identified that company are
performing well in the market because from 2016 to 2019, the sales, operating profit as well as
net profit of company in increasing. But in the year 2020, the financial health of business is
reducing which might be because of Covid-19 and lockdown. But this loss is temporary for the
company because as the government lift the lock-down, the sales of company will again increase
because of its online presence. With the help of E-commerce, the company have managed its
Paraphrase This Document
Need a fresh take? Get an instant paraphrase of this document with our AI Paraphraser
operations even in this pandemic situation (AREAS, 2018). Thus, overall financial statement of
the company is good.
Financial ratio calculation of L’Oréal and Revlon along its interpretation and comparison
the company is good.
Financial ratio calculation of L’Oréal and Revlon along its interpretation and comparison
LOREAL REVLON
Particulars Formula 2020 2019 2018 2017 2016 2020 2019 2018 2017 2016
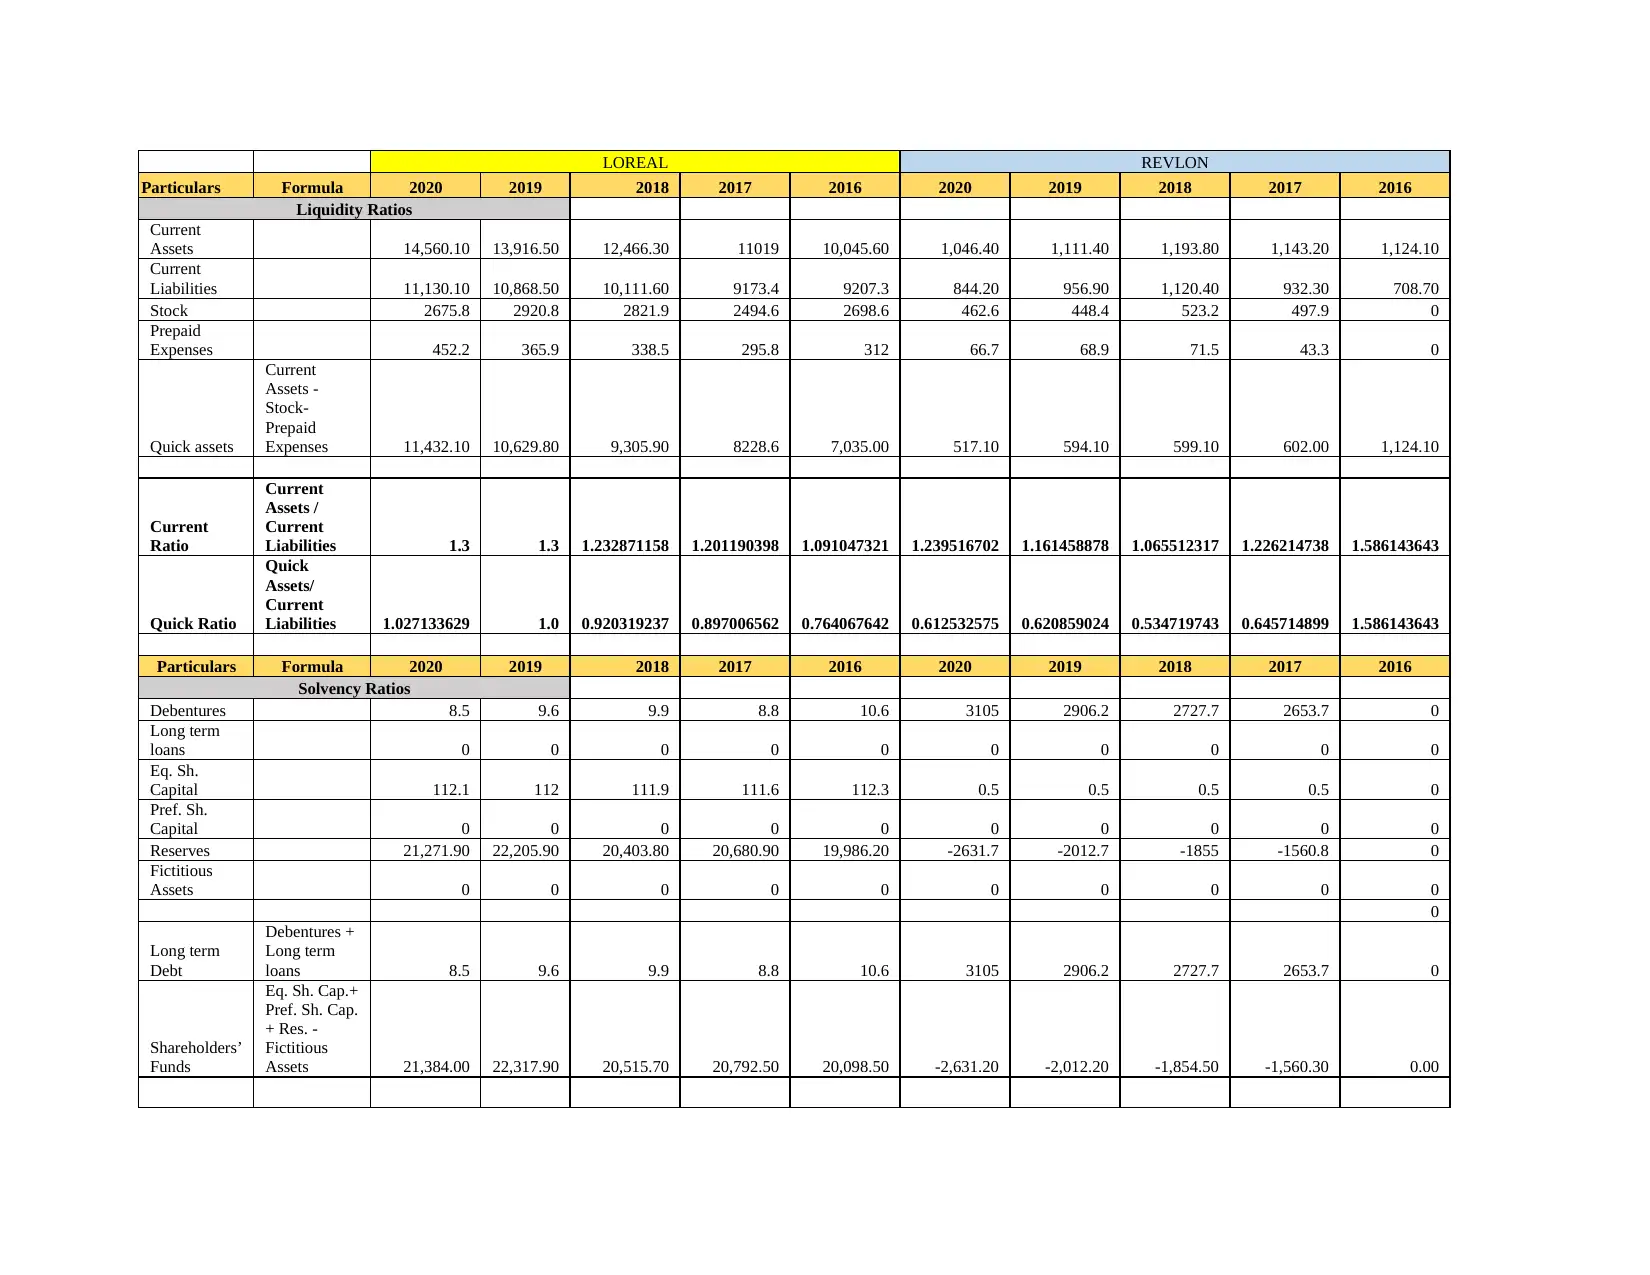
Liquidity Ratios
Current
Assets 14,560.10 13,916.50 12,466.30 11019 10,045.60 1,046.40 1,111.40 1,193.80 1,143.20 1,124.10
Current
Liabilities 11,130.10 10,868.50 10,111.60 9173.4 9207.3 844.20 956.90 1,120.40 932.30 708.70
Stock 2675.8 2920.8 2821.9 2494.6 2698.6 462.6 448.4 523.2 497.9 0
Prepaid
Expenses 452.2 365.9 338.5 295.8 312 66.7 68.9 71.5 43.3 0
Quick assets
Current
Assets -
Stock-
Prepaid
Expenses 11,432.10 10,629.80 9,305.90 8228.6 7,035.00 517.10 594.10 599.10 602.00 1,124.10
Current
Ratio
Current
Assets /
Current
Liabilities 1.3 1.3 1.232871158 1.201190398 1.091047321 1.239516702 1.161458878 1.065512317 1.226214738 1.586143643
Quick Ratio
Quick
Assets/
Current
Liabilities 1.027133629 1.0 0.920319237 0.897006562 0.764067642 0.612532575 0.620859024 0.534719743 0.645714899 1.586143643
Particulars Formula 2020 2019 2018 2017 2016 2020 2019 2018 2017 2016
Solvency Ratios
Debentures 8.5 9.6 9.9 8.8 10.6 3105 2906.2 2727.7 2653.7 0
Long term
loans 0 0 0 0 0 0 0 0 0 0
Eq. Sh.
Capital 112.1 112 111.9 111.6 112.3 0.5 0.5 0.5 0.5 0
Pref. Sh.
Capital 0 0 0 0 0 0 0 0 0 0
Reserves 21,271.90 22,205.90 20,403.80 20,680.90 19,986.20 -2631.7 -2012.7 -1855 -1560.8 0
Fictitious
Assets 0 0 0 0 0 0 0 0 0 0
0
Long term
Debt
Debentures +
Long term
loans 8.5 9.6 9.9 8.8 10.6 3105 2906.2 2727.7 2653.7 0
Shareholders’
Funds
Eq. Sh. Cap.+
Pref. Sh. Cap.
+ Res. -
Fictitious
Assets 21,384.00 22,317.90 20,515.70 20,792.50 20,098.50 -2,631.20 -2,012.20 -1,854.50 -1,560.30 0.00
Particulars Formula 2020 2019 2018 2017 2016 2020 2019 2018 2017 2016
Liquidity Ratios
Current
Assets 14,560.10 13,916.50 12,466.30 11019 10,045.60 1,046.40 1,111.40 1,193.80 1,143.20 1,124.10
Current
Liabilities 11,130.10 10,868.50 10,111.60 9173.4 9207.3 844.20 956.90 1,120.40 932.30 708.70
Stock 2675.8 2920.8 2821.9 2494.6 2698.6 462.6 448.4 523.2 497.9 0
Prepaid
Expenses 452.2 365.9 338.5 295.8 312 66.7 68.9 71.5 43.3 0
Quick assets
Current
Assets -
Stock-
Prepaid
Expenses 11,432.10 10,629.80 9,305.90 8228.6 7,035.00 517.10 594.10 599.10 602.00 1,124.10
Current
Ratio
Current
Assets /
Current
Liabilities 1.3 1.3 1.232871158 1.201190398 1.091047321 1.239516702 1.161458878 1.065512317 1.226214738 1.586143643
Quick Ratio
Quick
Assets/
Current
Liabilities 1.027133629 1.0 0.920319237 0.897006562 0.764067642 0.612532575 0.620859024 0.534719743 0.645714899 1.586143643
Particulars Formula 2020 2019 2018 2017 2016 2020 2019 2018 2017 2016
Solvency Ratios
Debentures 8.5 9.6 9.9 8.8 10.6 3105 2906.2 2727.7 2653.7 0
Long term
loans 0 0 0 0 0 0 0 0 0 0
Eq. Sh.
Capital 112.1 112 111.9 111.6 112.3 0.5 0.5 0.5 0.5 0
Pref. Sh.
Capital 0 0 0 0 0 0 0 0 0 0
Reserves 21,271.90 22,205.90 20,403.80 20,680.90 19,986.20 -2631.7 -2012.7 -1855 -1560.8 0
Fictitious
Assets 0 0 0 0 0 0 0 0 0 0
0
Long term
Debt
Debentures +
Long term
loans 8.5 9.6 9.9 8.8 10.6 3105 2906.2 2727.7 2653.7 0
Shareholders’
Funds
Eq. Sh. Cap.+
Pref. Sh. Cap.
+ Res. -
Fictitious
Assets 21,384.00 22,317.90 20,515.70 20,792.50 20,098.50 -2,631.20 -2,012.20 -1,854.50 -1,560.30 0.00
⊘ This is a preview!⊘
Do you want full access?
Subscribe today to unlock all pages.
Trusted by 1+ million students worldwide
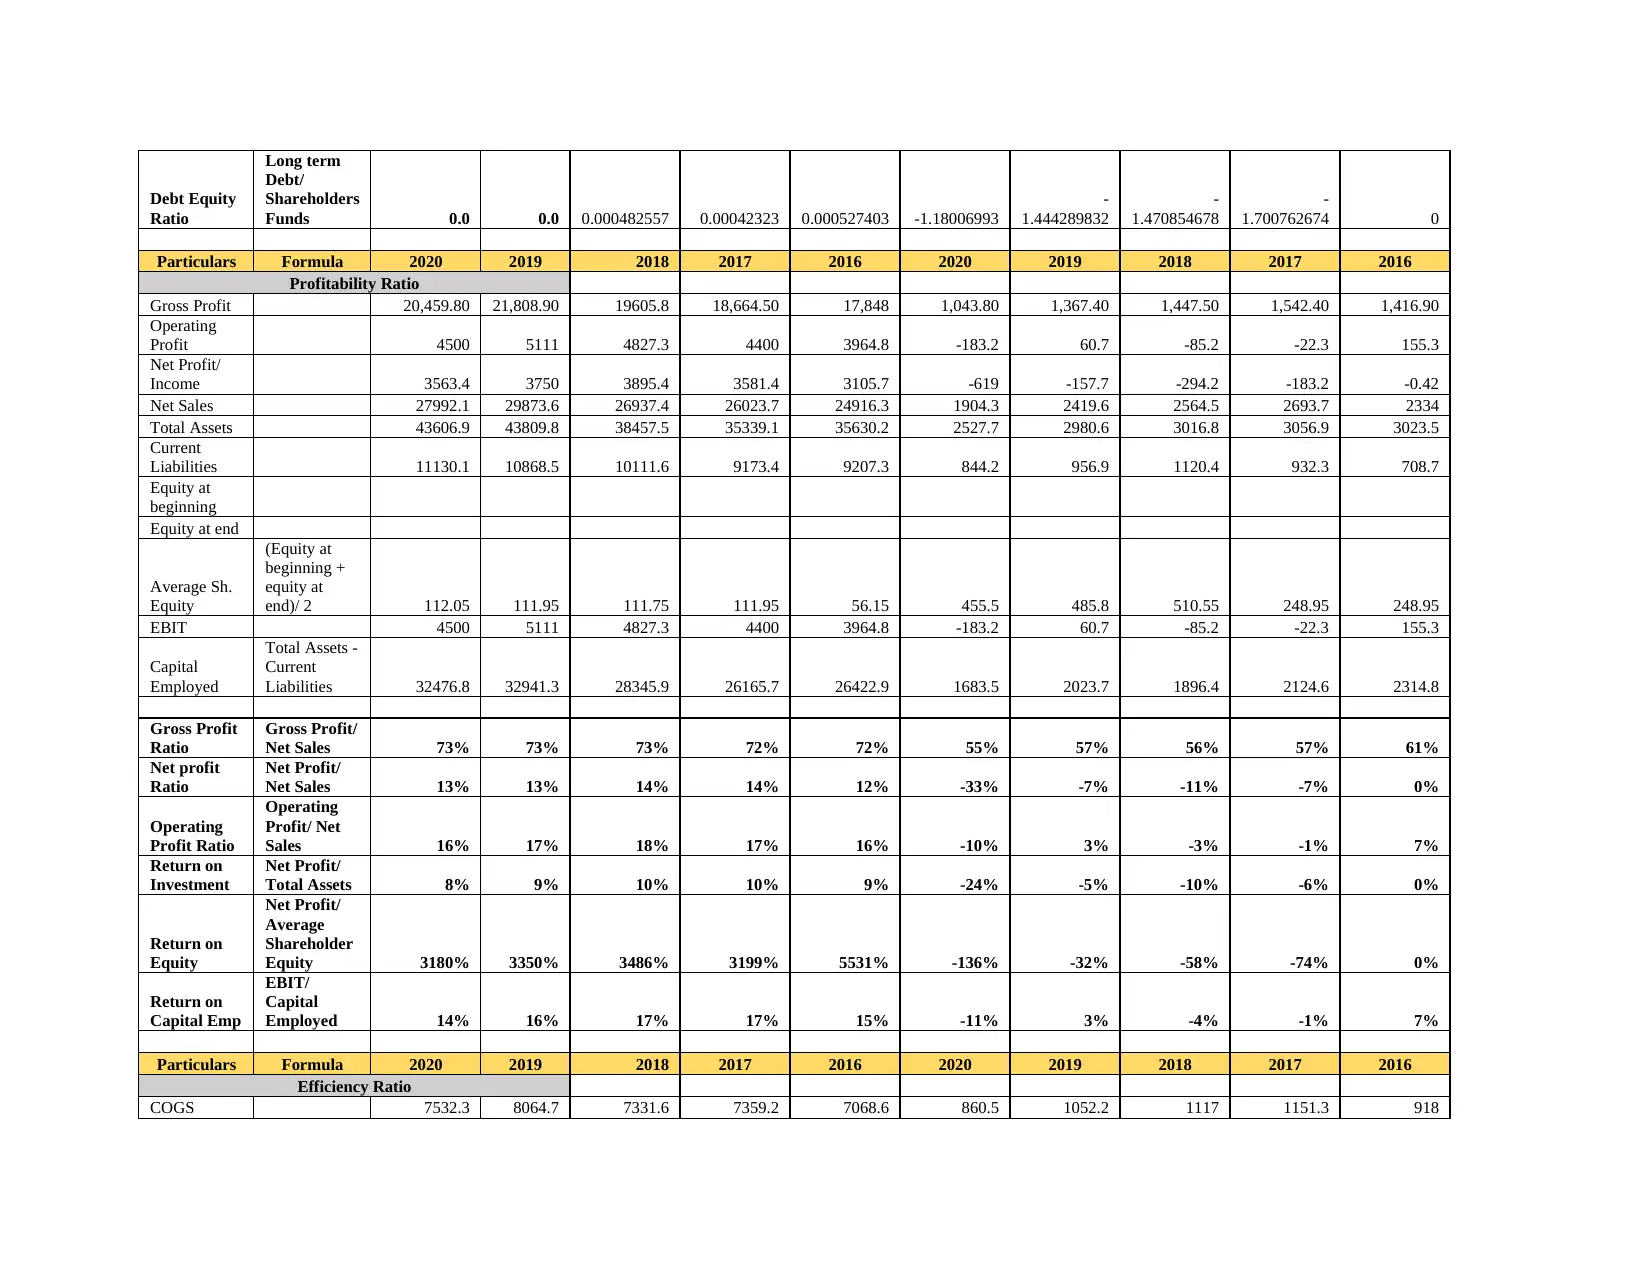
Debt Equity
Ratio
Long term
Debt/
Shareholders
Funds 0.0 0.0 0.000482557 0.00042323 0.000527403 -1.18006993
-
1.444289832
-
1.470854678
-
1.700762674 0
Particulars Formula 2020 2019 2018 2017 2016 2020 2019 2018 2017 2016
Profitability Ratio
Gross Profit 20,459.80 21,808.90 19605.8 18,664.50 17,848 1,043.80 1,367.40 1,447.50 1,542.40 1,416.90
Operating
Profit 4500 5111 4827.3 4400 3964.8 -183.2 60.7 -85.2 -22.3 155.3
Net Profit/
Income 3563.4 3750 3895.4 3581.4 3105.7 -619 -157.7 -294.2 -183.2 -0.42
Net Sales 27992.1 29873.6 26937.4 26023.7 24916.3 1904.3 2419.6 2564.5 2693.7 2334
Total Assets 43606.9 43809.8 38457.5 35339.1 35630.2 2527.7 2980.6 3016.8 3056.9 3023.5
Current
Liabilities 11130.1 10868.5 10111.6 9173.4 9207.3 844.2 956.9 1120.4 932.3 708.7
Equity at
beginning
Equity at end
Average Sh.
Equity
(Equity at
beginning +
equity at
end)/ 2 112.05 111.95 111.75 111.95 56.15 455.5 485.8 510.55 248.95 248.95
EBIT 4500 5111 4827.3 4400 3964.8 -183.2 60.7 -85.2 -22.3 155.3
Capital
Employed
Total Assets -
Current
Liabilities 32476.8 32941.3 28345.9 26165.7 26422.9 1683.5 2023.7 1896.4 2124.6 2314.8
Gross Profit
Ratio
Gross Profit/
Net Sales 73% 73% 73% 72% 72% 55% 57% 56% 57% 61%
Net profit
Ratio
Net Profit/
Net Sales 13% 13% 14% 14% 12% -33% -7% -11% -7% 0%
Operating
Profit Ratio
Operating
Profit/ Net
Sales 16% 17% 18% 17% 16% -10% 3% -3% -1% 7%
Return on
Investment
Net Profit/
Total Assets 8% 9% 10% 10% 9% -24% -5% -10% -6% 0%
Return on
Equity
Net Profit/
Average
Shareholder
Equity 3180% 3350% 3486% 3199% 5531% -136% -32% -58% -74% 0%
Return on
Capital Emp
EBIT/
Capital
Employed 14% 16% 17% 17% 15% -11% 3% -4% -1% 7%
Particulars Formula 2020 2019 2018 2017 2016 2020 2019 2018 2017 2016
Efficiency Ratio
COGS 7532.3 8064.7 7331.6 7359.2 7068.6 860.5 1052.2 1117 1151.3 918
Ratio
Long term
Debt/
Shareholders
Funds 0.0 0.0 0.000482557 0.00042323 0.000527403 -1.18006993
-
1.444289832
-
1.470854678
-
1.700762674 0
Particulars Formula 2020 2019 2018 2017 2016 2020 2019 2018 2017 2016
Profitability Ratio
Gross Profit 20,459.80 21,808.90 19605.8 18,664.50 17,848 1,043.80 1,367.40 1,447.50 1,542.40 1,416.90
Operating
Profit 4500 5111 4827.3 4400 3964.8 -183.2 60.7 -85.2 -22.3 155.3
Net Profit/
Income 3563.4 3750 3895.4 3581.4 3105.7 -619 -157.7 -294.2 -183.2 -0.42
Net Sales 27992.1 29873.6 26937.4 26023.7 24916.3 1904.3 2419.6 2564.5 2693.7 2334
Total Assets 43606.9 43809.8 38457.5 35339.1 35630.2 2527.7 2980.6 3016.8 3056.9 3023.5
Current
Liabilities 11130.1 10868.5 10111.6 9173.4 9207.3 844.2 956.9 1120.4 932.3 708.7
Equity at
beginning
Equity at end
Average Sh.
Equity
(Equity at
beginning +
equity at
end)/ 2 112.05 111.95 111.75 111.95 56.15 455.5 485.8 510.55 248.95 248.95
EBIT 4500 5111 4827.3 4400 3964.8 -183.2 60.7 -85.2 -22.3 155.3
Capital
Employed
Total Assets -
Current
Liabilities 32476.8 32941.3 28345.9 26165.7 26422.9 1683.5 2023.7 1896.4 2124.6 2314.8
Gross Profit
Ratio
Gross Profit/
Net Sales 73% 73% 73% 72% 72% 55% 57% 56% 57% 61%
Net profit
Ratio
Net Profit/
Net Sales 13% 13% 14% 14% 12% -33% -7% -11% -7% 0%
Operating
Profit Ratio
Operating
Profit/ Net
Sales 16% 17% 18% 17% 16% -10% 3% -3% -1% 7%
Return on
Investment
Net Profit/
Total Assets 8% 9% 10% 10% 9% -24% -5% -10% -6% 0%
Return on
Equity
Net Profit/
Average
Shareholder
Equity 3180% 3350% 3486% 3199% 5531% -136% -32% -58% -74% 0%
Return on
Capital Emp
EBIT/
Capital
Employed 14% 16% 17% 17% 15% -11% 3% -4% -1% 7%
Particulars Formula 2020 2019 2018 2017 2016 2020 2019 2018 2017 2016
Efficiency Ratio
COGS 7532.3 8064.7 7331.6 7359.2 7068.6 860.5 1052.2 1117 1151.3 918
Paraphrase This Document
Need a fresh take? Get an instant paraphrase of this document with our AI Paraphraser
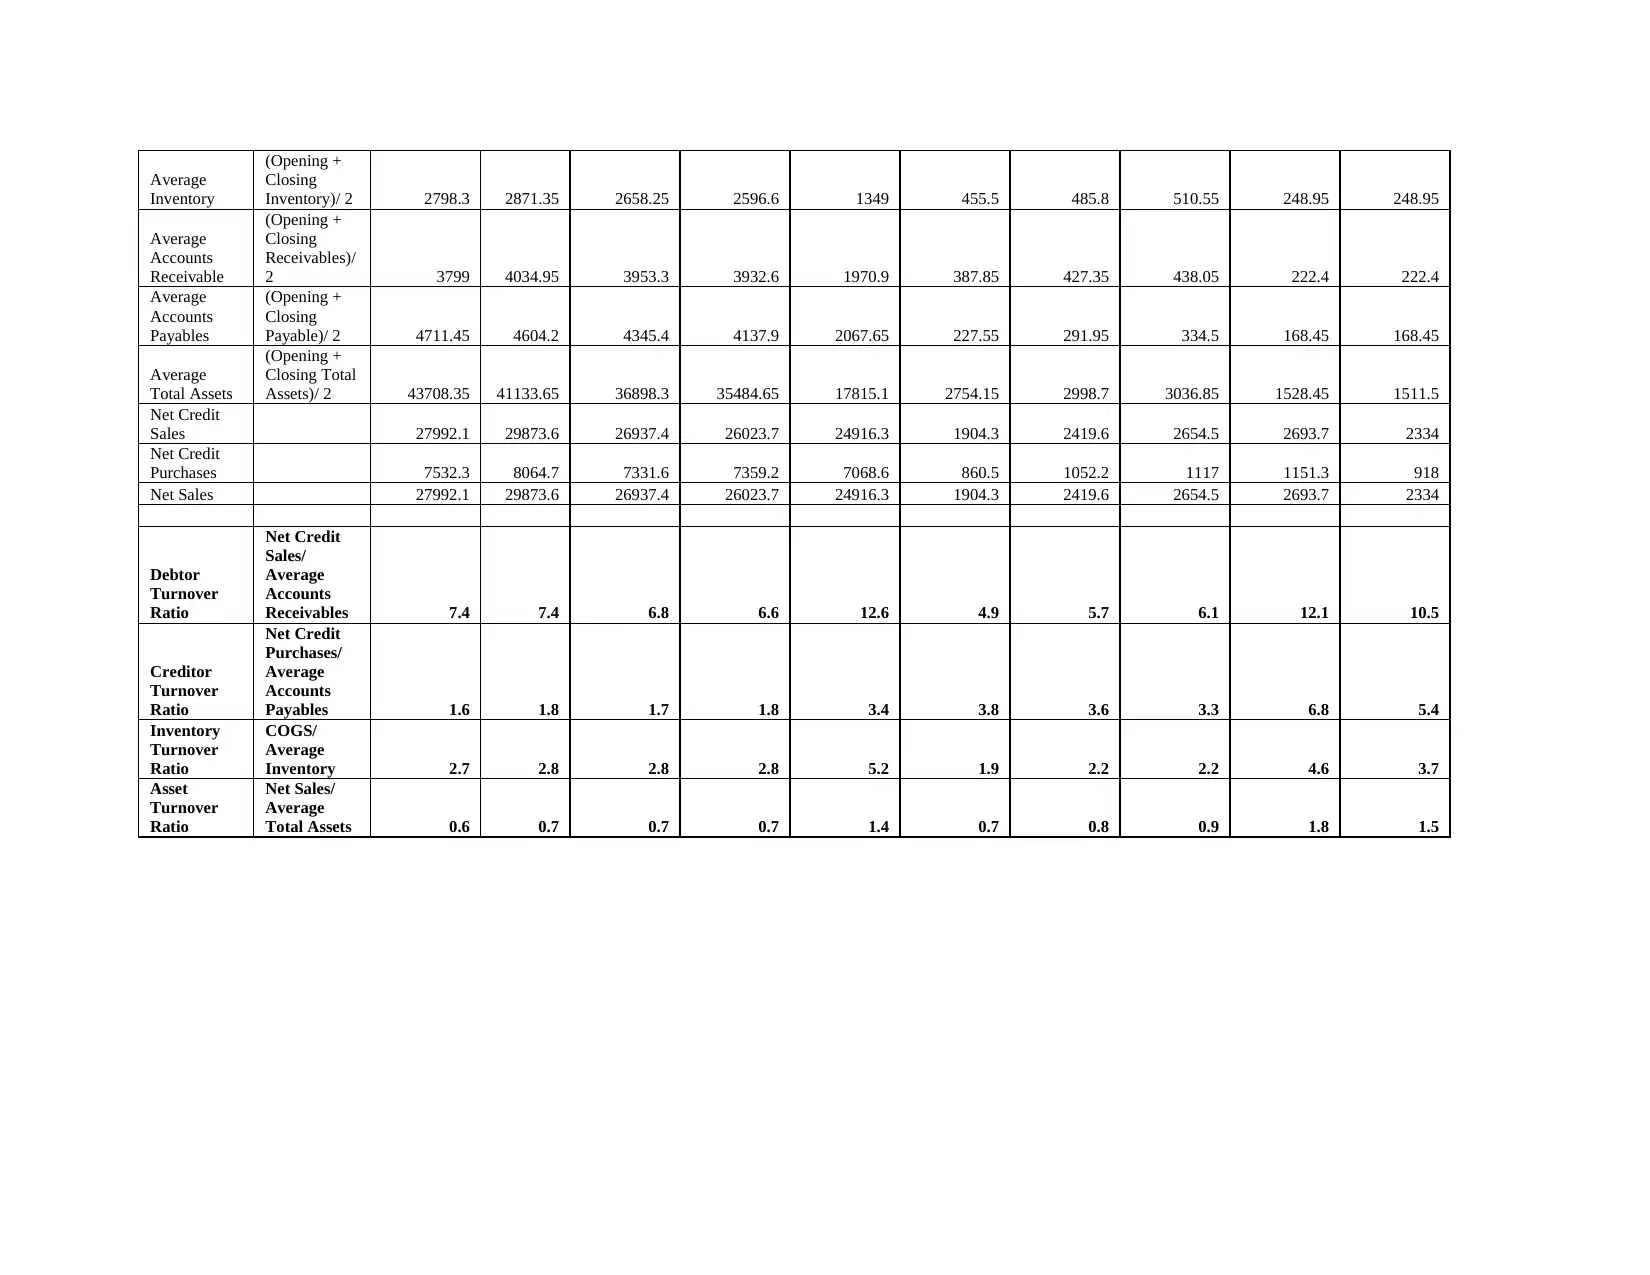
Average
Inventory
(Opening +
Closing
Inventory)/ 2 2798.3 2871.35 2658.25 2596.6 1349 455.5 485.8 510.55 248.95 248.95
Average
Accounts
Receivable
(Opening +
Closing
Receivables)/
2 3799 4034.95 3953.3 3932.6 1970.9 387.85 427.35 438.05 222.4 222.4
Average
Accounts
Payables
(Opening +
Closing
Payable)/ 2 4711.45 4604.2 4345.4 4137.9 2067.65 227.55 291.95 334.5 168.45 168.45
Average
Total Assets
(Opening +
Closing Total
Assets)/ 2 43708.35 41133.65 36898.3 35484.65 17815.1 2754.15 2998.7 3036.85 1528.45 1511.5
Net Credit
Sales 27992.1 29873.6 26937.4 26023.7 24916.3 1904.3 2419.6 2654.5 2693.7 2334
Net Credit
Purchases 7532.3 8064.7 7331.6 7359.2 7068.6 860.5 1052.2 1117 1151.3 918
Net Sales 27992.1 29873.6 26937.4 26023.7 24916.3 1904.3 2419.6 2654.5 2693.7 2334
Debtor
Turnover
Ratio
Net Credit
Sales/
Average
Accounts
Receivables 7.4 7.4 6.8 6.6 12.6 4.9 5.7 6.1 12.1 10.5
Creditor
Turnover
Ratio
Net Credit
Purchases/
Average
Accounts
Payables 1.6 1.8 1.7 1.8 3.4 3.8 3.6 3.3 6.8 5.4
Inventory
Turnover
Ratio
COGS/
Average
Inventory 2.7 2.8 2.8 2.8 5.2 1.9 2.2 2.2 4.6 3.7
Asset
Turnover
Ratio
Net Sales/
Average
Total Assets 0.6 0.7 0.7 0.7 1.4 0.7 0.8 0.9 1.8 1.5
Inventory
(Opening +
Closing
Inventory)/ 2 2798.3 2871.35 2658.25 2596.6 1349 455.5 485.8 510.55 248.95 248.95
Average
Accounts
Receivable
(Opening +
Closing
Receivables)/
2 3799 4034.95 3953.3 3932.6 1970.9 387.85 427.35 438.05 222.4 222.4
Average
Accounts
Payables
(Opening +
Closing
Payable)/ 2 4711.45 4604.2 4345.4 4137.9 2067.65 227.55 291.95 334.5 168.45 168.45
Average
Total Assets
(Opening +
Closing Total
Assets)/ 2 43708.35 41133.65 36898.3 35484.65 17815.1 2754.15 2998.7 3036.85 1528.45 1511.5
Net Credit
Sales 27992.1 29873.6 26937.4 26023.7 24916.3 1904.3 2419.6 2654.5 2693.7 2334
Net Credit
Purchases 7532.3 8064.7 7331.6 7359.2 7068.6 860.5 1052.2 1117 1151.3 918
Net Sales 27992.1 29873.6 26937.4 26023.7 24916.3 1904.3 2419.6 2654.5 2693.7 2334
Debtor
Turnover
Ratio
Net Credit
Sales/
Average
Accounts
Receivables 7.4 7.4 6.8 6.6 12.6 4.9 5.7 6.1 12.1 10.5
Creditor
Turnover
Ratio
Net Credit
Purchases/
Average
Accounts
Payables 1.6 1.8 1.7 1.8 3.4 3.8 3.6 3.3 6.8 5.4
Inventory
Turnover
Ratio
COGS/
Average
Inventory 2.7 2.8 2.8 2.8 5.2 1.9 2.2 2.2 4.6 3.7
Asset
Turnover
Ratio
Net Sales/
Average
Total Assets 0.6 0.7 0.7 0.7 1.4 0.7 0.8 0.9 1.8 1.5
Interpretation
Liquidity Ratios
Liquidity ratios are a form of financial ratios, used by different companies in order to analyse the
liquidity state of a company. These ratios are used to determine if the company has sufficient
assets which can be used to meet its short-term obligations.
From the above calculations of Loreal Paris, it can be stated that the liquidity of the company is
increasing little by little, which is a good indicator. The Current ratio of Loreal Paris were
recorded to be 1.091 in 2016 which increased to 1.2328 in 2018 and further reaching 1.3 in 2020.
Similarly, The Quick ratio of Loreal Paris was 0.764 which increased to 0.9203 in 2018 and
reach to 1.027 in 2020. The increasing liquidity ratio gives a feeling of contentment to the
shareholders of the company as the company is capable of repaying its short-term liabilities on
time. But Loreal Paris can still work on making its liquidity better by repaying its short terms
before time, cutting overhead expenses like rent, labour, marketing expenses (Haralayya, 2021).
The Loreal Paris is doing better than Revlon as the liquidity ratios of Revlon are constantly
decreasing.
Solvency Ratios
The ratios which helps an organization in identifying its capacity to pay long term debts are
known as Solvency ratios. Solvency ratios determines the amount of shareholder’s fund in
relation to the long-term debt owned by the company. It can be seen from the above table that the
solvency ratio of Loreal Paris is below 1. The debt equity ratio of the company in 2016 was
recorded as 0.0005274 and since then it is constantly deteriorating and in the year 2020 it came
down to zero. A debt equity ratio lower than 1 states that the company does not trust external
borrowings for financing. The ideal debt equity ratio is between 1 to 2. But it can be stated that
Loreal Paris has a better debt equity ratio than Revlon as negative debt equity ratio refers more
debt than assets (Pascal and et.al., 2021).
Profitability ratio
The profitability ratio of the company disclose the fact that company could govern an
increase rend in its profits. The net profit of the Loreal company could go down in the year 2019
⊘ This is a preview!⊘
Do you want full access?
Subscribe today to unlock all pages.
Trusted by 1+ million students worldwide
1 out of 26

Your All-in-One AI-Powered Toolkit for Academic Success.
+13062052269
info@desklib.com
Available 24*7 on WhatsApp / Email
![[object Object]](/_next/static/media/star-bottom.7253800d.svg)
Unlock your academic potential
Copyright © 2020–2026 A2Z Services. All Rights Reserved. Developed and managed by ZUCOL.