Financial Statement Analysis of Myer Holdings: Course Report
VerifiedAdded on 2020/02/24
|21
|4416
|184
Report
AI Summary
This report offers a comprehensive financial statement analysis of Myer Holdings, an Australian departmental store. It begins with an introduction to Myer, its operations, and its position within the Australian retail industry, including the challenges posed by online stores and foreign competitors. The analysis delves into Myer's income statement, balance sheet, and cash flow statements over a five-year period (2012-2016), highlighting trends in revenue, gross profit, net income, and key asset and liability components. The report also includes a detailed ratio analysis, focusing on liquidity ratios like working capital and current ratio, providing insights into Myer's financial health and efficiency. Furthermore, it examines cash flow from operating, investing, and financing activities, offering a holistic view of the company's financial performance and future plans, including strategies for growth and cost reduction.
Financial Statement Analysis of Myer Holdings 1
FINANCIAL STATEMENT ANALYSIS OF MYER HOLDINGS
Student’s Name
Course
Lecturer
Institution
Date
FINANCIAL STATEMENT ANALYSIS OF MYER HOLDINGS
Student’s Name
Course
Lecturer
Institution
Date
Paraphrase This Document
Need a fresh take? Get an instant paraphrase of this document with our AI Paraphraser
Financial Statement Analysis of Myer Holdings 2
Financial Statement Analysis of Myer Holdings
Introduction
Myer is an Australia company established in 1900. It is the largest Australian departmental
store with over 60 stores operating across Australia. Basically, Myer Holding is the public
limited company which is ranked in number 131 out of 2000 top organisations in Australia
(Myer Holdings Ltd 2013). Its chief executive officer is Richard Umbers while its chairman
is Paul McClintock who is also referred to non-executive chairman. The company usually
generates most of its revenue from departmental stores in the Australian industry. Basically,
Myer Holdings engages in numerous operations of departmental stores across Australia. In
essence, Myer offers a wide range of products ranging from men’s wear, home wares, youth
wear, furniture, footwear, children’s wear, electrical goods, general merchandise, women’s
wear, toys, handbags, beauty as well as cosmetic products (Myer Holdings Ltd 2016). In
addition, Myer offer some retail customer loyalty programs. Myer operates around 67 stores
under its brand name Myer Holdings Limited. It has stores across six Australian states and
Australian Capital Territory. In essence, it locations comprise a mixture of key suburban
shopping centres, city stores, and as well as shopping centres in the regional New South
Wales, Tasmania, Victoria and Queensland. The company operates under retail sector and
like other retail companies; this company’s shares have been affected greatly during the mass
exodus of the investors from retail sector. In the financial year 2016, it generated a total of
$2.8 billion in revenue with a total of 12,500 employees across Australia (Myer Holdings Ltd
2016). Further, its share price is now down with 36% since the beginning of this year.
Its independent auditor is PwC which ensure that the company’s financial statements are
audited compliant with the Australian Auditing Standards (Myer Holdings Ltd 2010).
According to the auditor Myer’s financial statements are in accordance with Corporations Act
Financial Statement Analysis of Myer Holdings 3
of the year 2001 including abiding by the Australian Accounting Standards, providing a true
and fair outlook of its financial status in 2016.
Industry Situation and Myer Plans
Australian retailing industry has increased by around 3% in the current value in 2016 which
is in consistence with growth observed during the previous year. Further, the industry
experience high competition with subdivision firms struggling to compete against cheap
online stores. Despite the comparison with global retail industry, Australian retail industry is
a significant and large part of Australian retail economy. Further, in Australian retail industry,
foreign retailing firms are strongly represented with retailing firms such as Gap, Apple and
Fossil capitalizing on the increasing sale potential. With these considerations, domestic
retailing firms such as Myer Holding are required to come up with better plans to overcome
the stiff competition being experienced in the industry. Myer Holding Limited future plans is
to grow by 0.6% in the next one year (Myer Holdings Ltd 2016). This seems to be possible
since the company has outperformed in the retail industry for the last one year. In addition, it
ROE for the last one year left a significant mark to be desired. Furthermore, its future plans
include a $480,000,000 capital investments as well as over 3% improvement every year in its
total sales in the next three to five years. It also plans to reduce its costs through store
rationalisation and lifting it sales via refurbishment of its stores and shifting towards bigger
brand sold via in-store concessions (Myer Holdings Ltd 2016).
III. Financial Statement Analysis
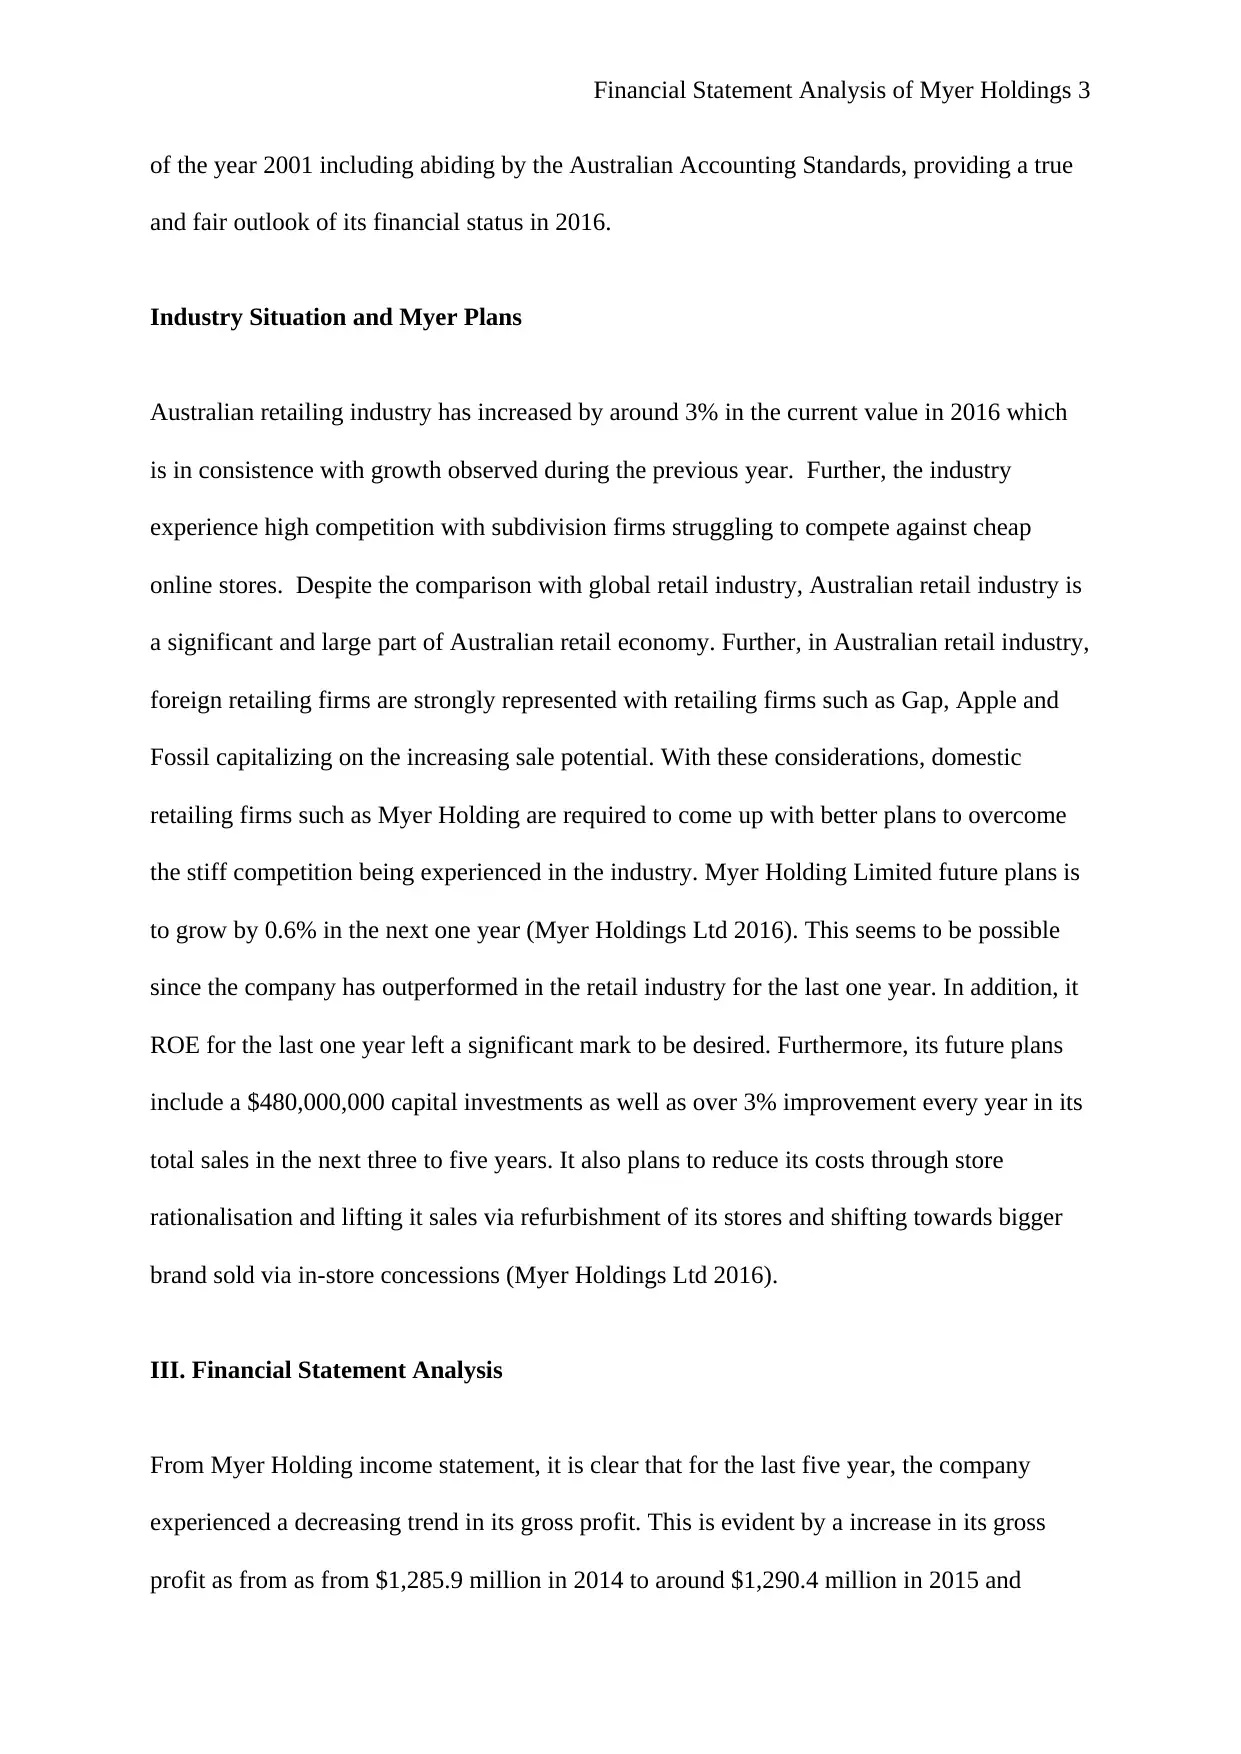
From Myer Holding income statement, it is clear that for the last five year, the company
experienced a decreasing trend in its gross profit. This is evident by a increase in its gross
profit as from as from $1,285.9 million in 2014 to around $1,290.4 million in 2015 and
of the year 2001 including abiding by the Australian Accounting Standards, providing a true
and fair outlook of its financial status in 2016.
Industry Situation and Myer Plans
Australian retailing industry has increased by around 3% in the current value in 2016 which
is in consistence with growth observed during the previous year. Further, the industry
experience high competition with subdivision firms struggling to compete against cheap
online stores. Despite the comparison with global retail industry, Australian retail industry is
a significant and large part of Australian retail economy. Further, in Australian retail industry,
foreign retailing firms are strongly represented with retailing firms such as Gap, Apple and
Fossil capitalizing on the increasing sale potential. With these considerations, domestic
retailing firms such as Myer Holding are required to come up with better plans to overcome
the stiff competition being experienced in the industry. Myer Holding Limited future plans is
to grow by 0.6% in the next one year (Myer Holdings Ltd 2016). This seems to be possible
since the company has outperformed in the retail industry for the last one year. In addition, it
ROE for the last one year left a significant mark to be desired. Furthermore, its future plans
include a $480,000,000 capital investments as well as over 3% improvement every year in its
total sales in the next three to five years. It also plans to reduce its costs through store
rationalisation and lifting it sales via refurbishment of its stores and shifting towards bigger
brand sold via in-store concessions (Myer Holdings Ltd 2016).
III. Financial Statement Analysis
From Myer Holding income statement, it is clear that for the last five year, the company
experienced a decreasing trend in its gross profit. This is evident by a increase in its gross
profit as from as from $1,285.9 million in 2014 to around $1,290.4 million in 2015 and
⊘ This is a preview!⊘
Do you want full access?
Subscribe today to unlock all pages.
Trusted by 1+ million students worldwide
Financial Statement Analysis of Myer Holdings 4
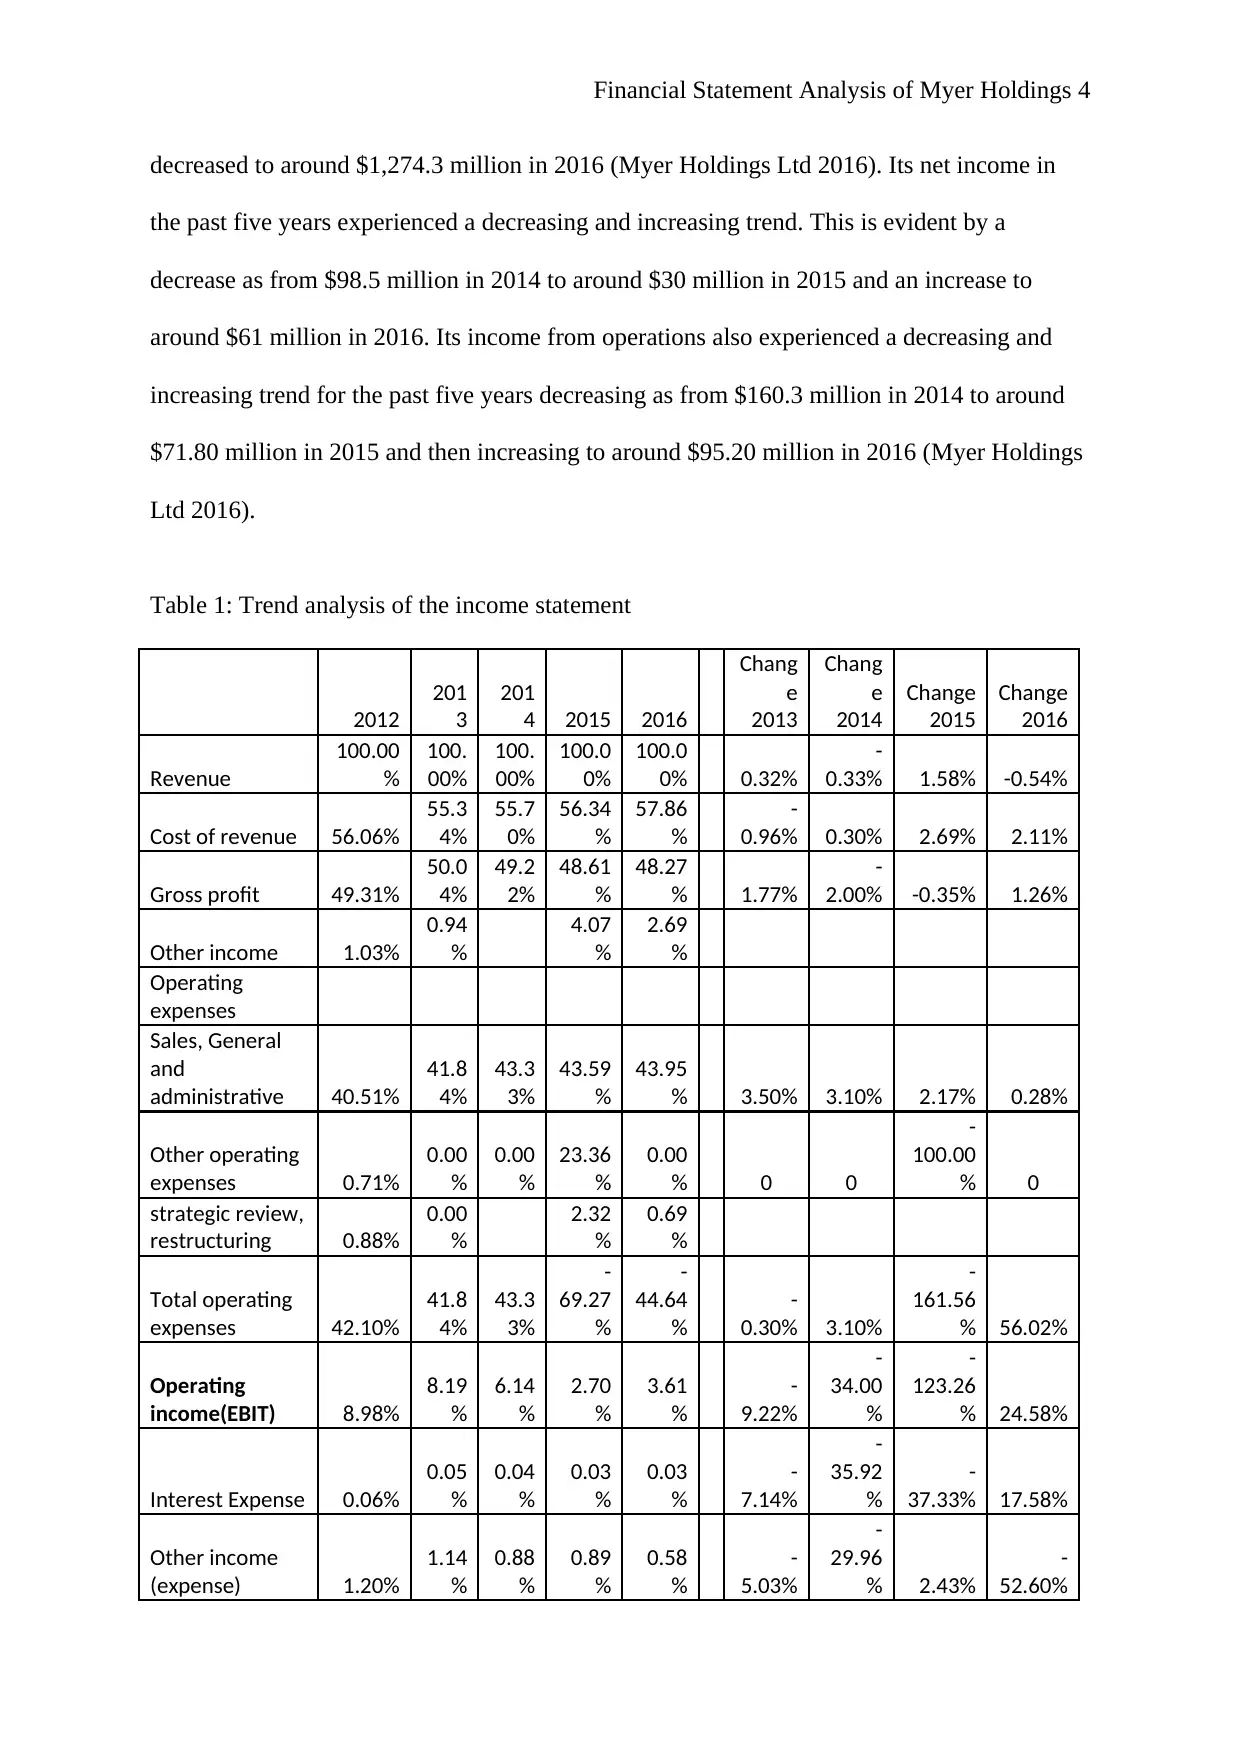
decreased to around $1,274.3 million in 2016 (Myer Holdings Ltd 2016). Its net income in
the past five years experienced a decreasing and increasing trend. This is evident by a
decrease as from $98.5 million in 2014 to around $30 million in 2015 and an increase to
around $61 million in 2016. Its income from operations also experienced a decreasing and
increasing trend for the past five years decreasing as from $160.3 million in 2014 to around
$71.80 million in 2015 and then increasing to around $95.20 million in 2016 (Myer Holdings
Ltd 2016).
Table 1: Trend analysis of the income statement
2012
201
3
201
4 2015 2016
Chang
e
2013
Chang
e
2014
Change
2015
Change
2016
Revenue
100.00
%
100.
00%
100.
00%
100.0
0%
100.0
0% 0.32%
-
0.33% 1.58% -0.54%
Cost of revenue 56.06%
55.3
4%
55.7
0%
56.34
%
57.86
%
-
0.96% 0.30% 2.69% 2.11%
Gross profit 49.31%
50.0
4%
49.2
2%
48.61
%
48.27
% 1.77%
-
2.00% -0.35% 1.26%
Other income 1.03%
0.94
%
4.07
%
2.69
%
Operating
expenses
Sales, General
and
administrative 40.51%
41.8
4%
43.3
3%
43.59
%
43.95
% 3.50% 3.10% 2.17% 0.28%
Other operating
expenses 0.71%
0.00
%
0.00
%
23.36
%
0.00
% 0 0
-
100.00
% 0
strategic review,
restructuring 0.88%
0.00
%
2.32
%
0.69
%
Total operating
expenses 42.10%
41.8
4%
43.3
3%
-
69.27
%
-
44.64
%
-
0.30% 3.10%
-
161.56
% 56.02%
Operating
income(EBIT) 8.98%
8.19
%
6.14
%
2.70
%
3.61
%
-
9.22%
-
34.00
%
-
123.26
% 24.58%
Interest Expense 0.06%
0.05
%
0.04
%
0.03
%
0.03
%
-
7.14%
-
35.92
%
-
37.33% 17.58%
Other income
(expense) 1.20%
1.14
%
0.88
%
0.89
%
0.58
%
-
5.03%
-
29.96
% 2.43%
-
52.60%
Paraphrase This Document
Need a fresh take? Get an instant paraphrase of this document with our AI Paraphraser
Financial Statement Analysis of Myer Holdings 5
Income before
income taxes 7.83%
7.12
%
5.30
%
1.85
%
3.06
%
-
9.76%
-
34.75
%
-
182.28
% 39.24%
Provision for
income taxes 2.44%
2.16
%
1.53
%
0.72
%
0.77
%
-
12.72
%
-
41.85
%
-
107.81
% 4.95%
Net income
from continuing
operations 5.40%
4.96
%
3.77
%
1.13
%
2.31
%
-
8.62%
-
31.88
%
-
228.33
% 50.82%
Net income 5.40%
4.96
%
3.77
%
1.13
%
2.31
%
-
8.62%
-
31.88
%
-
228.33
% 50.82%
Net income
available to
common
shareholders 5.40%
4.96
%
3.77
%
1.13
%
2.31
%
-
8.62%
-
31.88
%
-
228.33
% 50.82%
Earnings per
share
Basic
Diluted
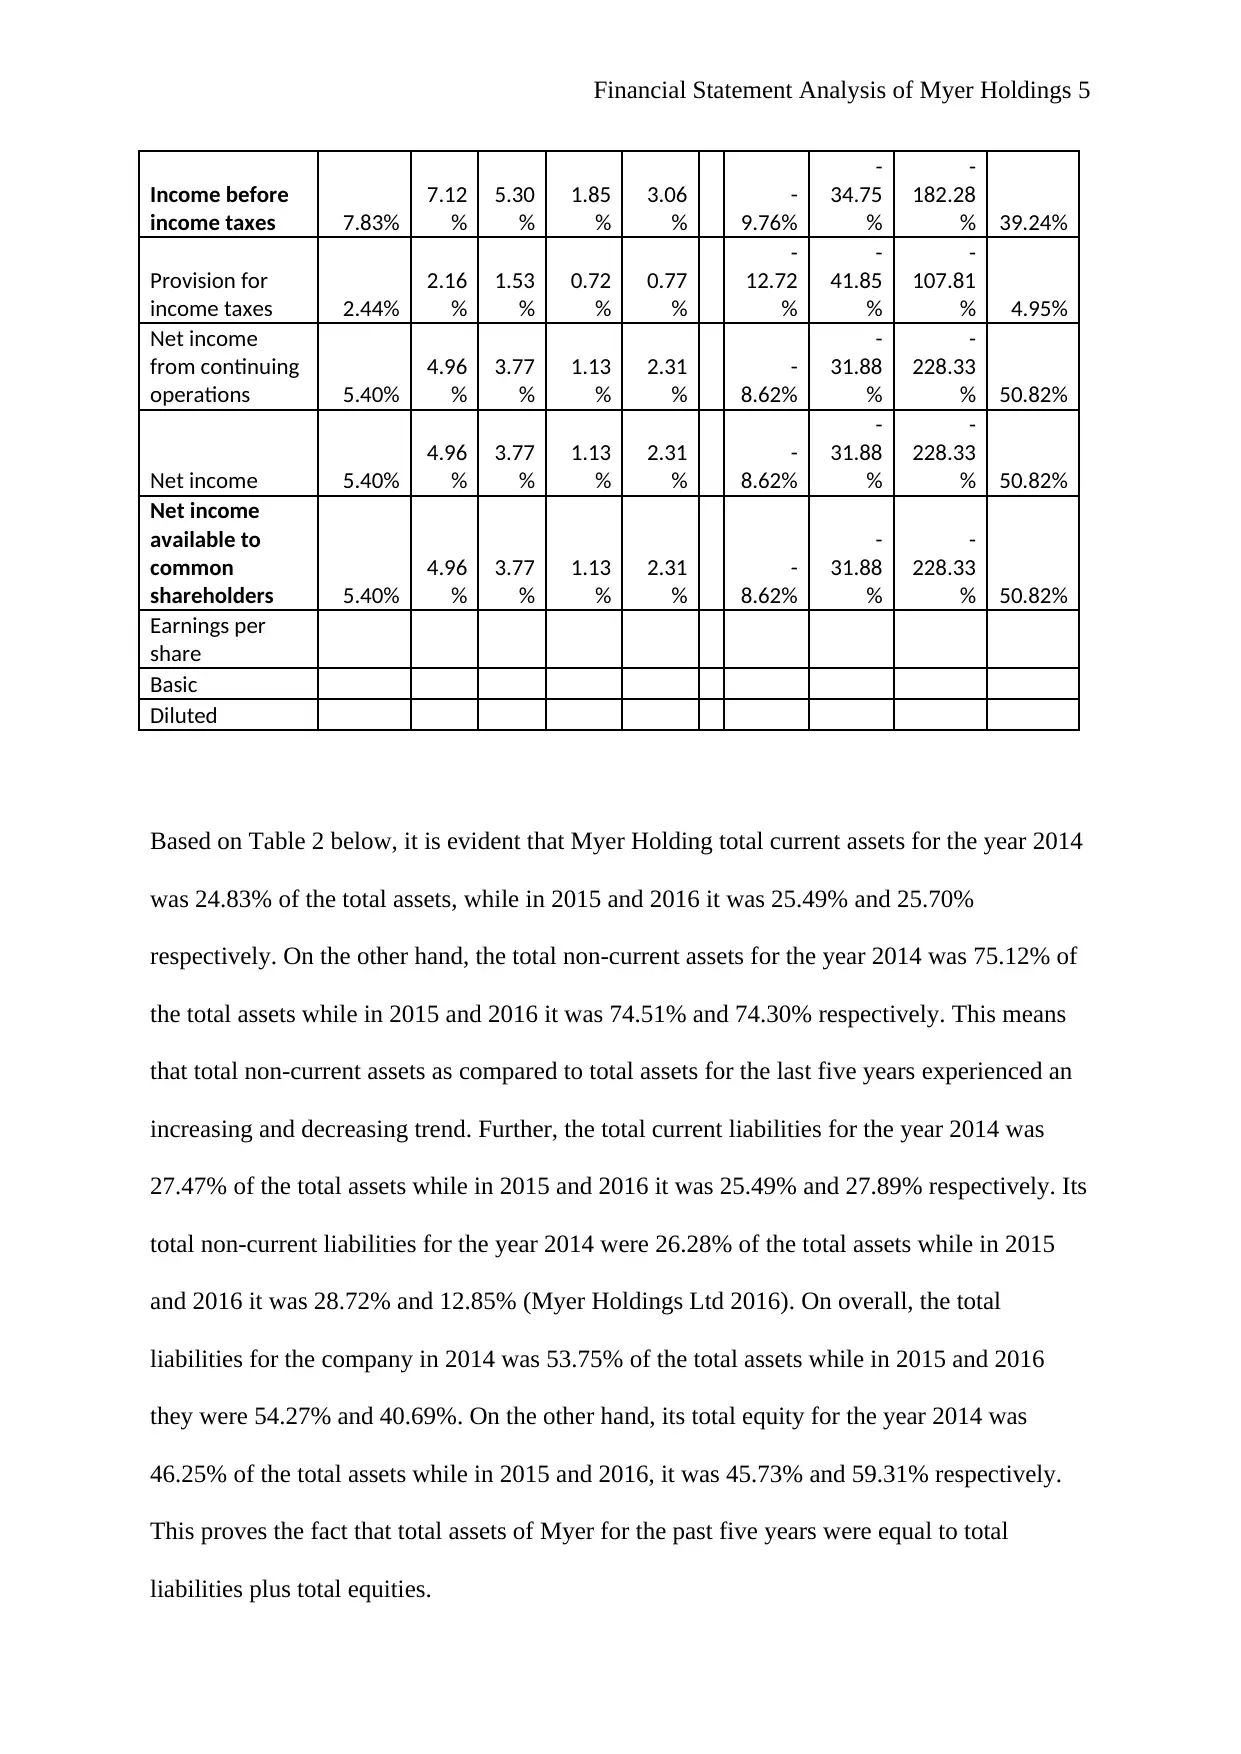
Based on Table 2 below, it is evident that Myer Holding total current assets for the year 2014
was 24.83% of the total assets, while in 2015 and 2016 it was 25.49% and 25.70%
respectively. On the other hand, the total non-current assets for the year 2014 was 75.12% of
the total assets while in 2015 and 2016 it was 74.51% and 74.30% respectively. This means
that total non-current assets as compared to total assets for the last five years experienced an
increasing and decreasing trend. Further, the total current liabilities for the year 2014 was
27.47% of the total assets while in 2015 and 2016 it was 25.49% and 27.89% respectively. Its
total non-current liabilities for the year 2014 were 26.28% of the total assets while in 2015
and 2016 it was 28.72% and 12.85% (Myer Holdings Ltd 2016). On overall, the total
liabilities for the company in 2014 was 53.75% of the total assets while in 2015 and 2016
they were 54.27% and 40.69%. On the other hand, its total equity for the year 2014 was
46.25% of the total assets while in 2015 and 2016, it was 45.73% and 59.31% respectively.
This proves the fact that total assets of Myer for the past five years were equal to total
liabilities plus total equities.
Income before
income taxes 7.83%
7.12
%
5.30
%
1.85
%
3.06
%
-
9.76%
-
34.75
%
-
182.28
% 39.24%
Provision for
income taxes 2.44%
2.16
%
1.53
%
0.72
%
0.77
%
-
12.72
%
-
41.85
%
-
107.81
% 4.95%
Net income
from continuing
operations 5.40%
4.96
%
3.77
%
1.13
%
2.31
%
-
8.62%
-
31.88
%
-
228.33
% 50.82%
Net income 5.40%
4.96
%
3.77
%
1.13
%
2.31
%
-
8.62%
-
31.88
%
-
228.33
% 50.82%
Net income
available to
common
shareholders 5.40%
4.96
%
3.77
%
1.13
%
2.31
%
-
8.62%
-
31.88
%
-
228.33
% 50.82%
Earnings per
share
Basic
Diluted
Based on Table 2 below, it is evident that Myer Holding total current assets for the year 2014
was 24.83% of the total assets, while in 2015 and 2016 it was 25.49% and 25.70%
respectively. On the other hand, the total non-current assets for the year 2014 was 75.12% of
the total assets while in 2015 and 2016 it was 74.51% and 74.30% respectively. This means
that total non-current assets as compared to total assets for the last five years experienced an
increasing and decreasing trend. Further, the total current liabilities for the year 2014 was
27.47% of the total assets while in 2015 and 2016 it was 25.49% and 27.89% respectively. Its
total non-current liabilities for the year 2014 were 26.28% of the total assets while in 2015
and 2016 it was 28.72% and 12.85% (Myer Holdings Ltd 2016). On overall, the total
liabilities for the company in 2014 was 53.75% of the total assets while in 2015 and 2016
they were 54.27% and 40.69%. On the other hand, its total equity for the year 2014 was
46.25% of the total assets while in 2015 and 2016, it was 45.73% and 59.31% respectively.
This proves the fact that total assets of Myer for the past five years were equal to total
liabilities plus total equities.
Financial Statement Analysis of Myer Holdings 6
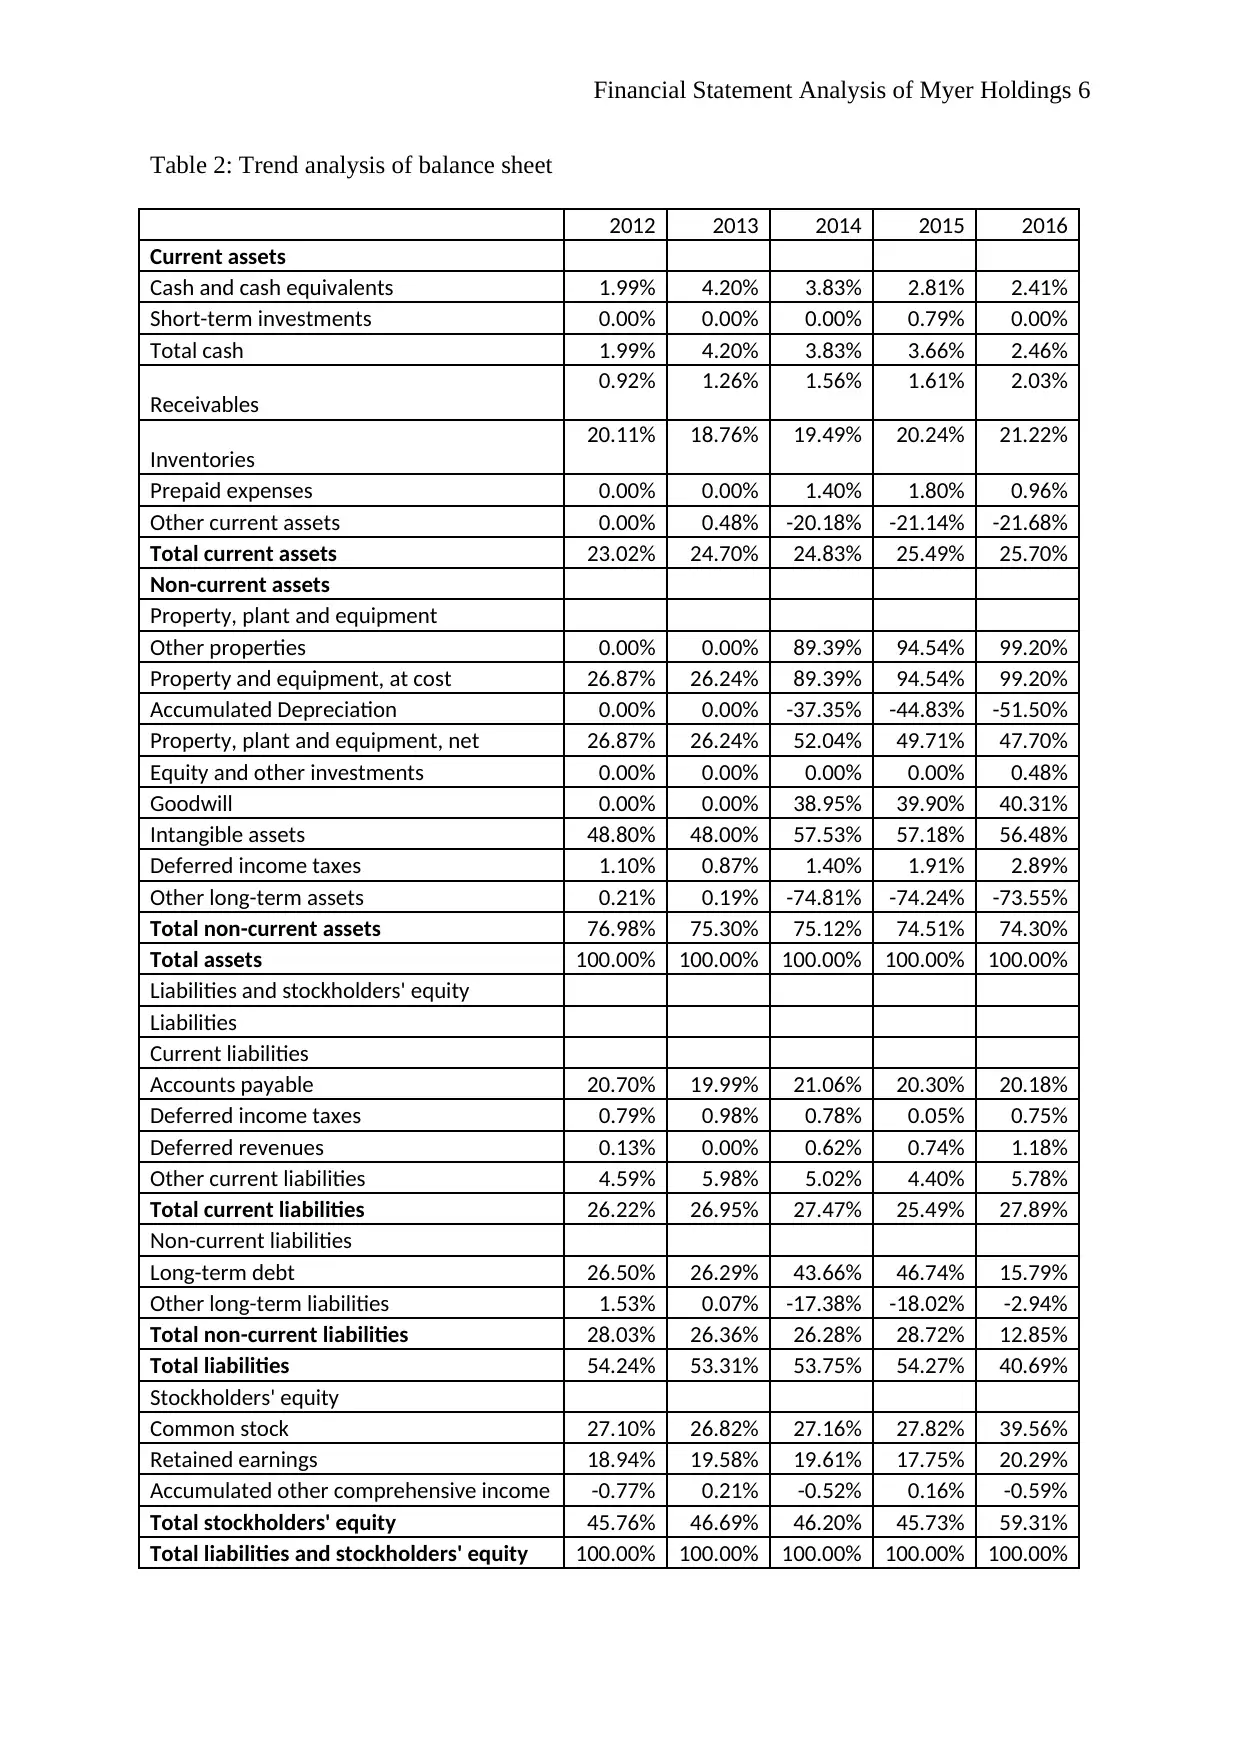
Table 2: Trend analysis of balance sheet
2012 2013 2014 2015 2016
Current assets
Cash and cash equivalents 1.99% 4.20% 3.83% 2.81% 2.41%
Short-term investments 0.00% 0.00% 0.00% 0.79% 0.00%
Total cash 1.99% 4.20% 3.83% 3.66% 2.46%
Receivables
0.92% 1.26% 1.56% 1.61% 2.03%
Inventories
20.11% 18.76% 19.49% 20.24% 21.22%
Prepaid expenses 0.00% 0.00% 1.40% 1.80% 0.96%
Other current assets 0.00% 0.48% -20.18% -21.14% -21.68%
Total current assets 23.02% 24.70% 24.83% 25.49% 25.70%
Non-current assets
Property, plant and equipment
Other properties 0.00% 0.00% 89.39% 94.54% 99.20%
Property and equipment, at cost 26.87% 26.24% 89.39% 94.54% 99.20%
Accumulated Depreciation 0.00% 0.00% -37.35% -44.83% -51.50%
Property, plant and equipment, net 26.87% 26.24% 52.04% 49.71% 47.70%
Equity and other investments 0.00% 0.00% 0.00% 0.00% 0.48%
Goodwill 0.00% 0.00% 38.95% 39.90% 40.31%
Intangible assets 48.80% 48.00% 57.53% 57.18% 56.48%
Deferred income taxes 1.10% 0.87% 1.40% 1.91% 2.89%
Other long-term assets 0.21% 0.19% -74.81% -74.24% -73.55%
Total non-current assets 76.98% 75.30% 75.12% 74.51% 74.30%
Total assets 100.00% 100.00% 100.00% 100.00% 100.00%
Liabilities and stockholders' equity
Liabilities
Current liabilities
Accounts payable 20.70% 19.99% 21.06% 20.30% 20.18%
Deferred income taxes 0.79% 0.98% 0.78% 0.05% 0.75%
Deferred revenues 0.13% 0.00% 0.62% 0.74% 1.18%
Other current liabilities 4.59% 5.98% 5.02% 4.40% 5.78%
Total current liabilities 26.22% 26.95% 27.47% 25.49% 27.89%
Non-current liabilities
Long-term debt 26.50% 26.29% 43.66% 46.74% 15.79%
Other long-term liabilities 1.53% 0.07% -17.38% -18.02% -2.94%
Total non-current liabilities 28.03% 26.36% 26.28% 28.72% 12.85%
Total liabilities 54.24% 53.31% 53.75% 54.27% 40.69%
Stockholders' equity
Common stock 27.10% 26.82% 27.16% 27.82% 39.56%
Retained earnings 18.94% 19.58% 19.61% 17.75% 20.29%
Accumulated other comprehensive income -0.77% 0.21% -0.52% 0.16% -0.59%
Total stockholders' equity 45.76% 46.69% 46.20% 45.73% 59.31%
Total liabilities and stockholders' equity 100.00% 100.00% 100.00% 100.00% 100.00%
⊘ This is a preview!⊘
Do you want full access?
Subscribe today to unlock all pages.
Trusted by 1+ million students worldwide
Financial Statement Analysis of Myer Holdings 7
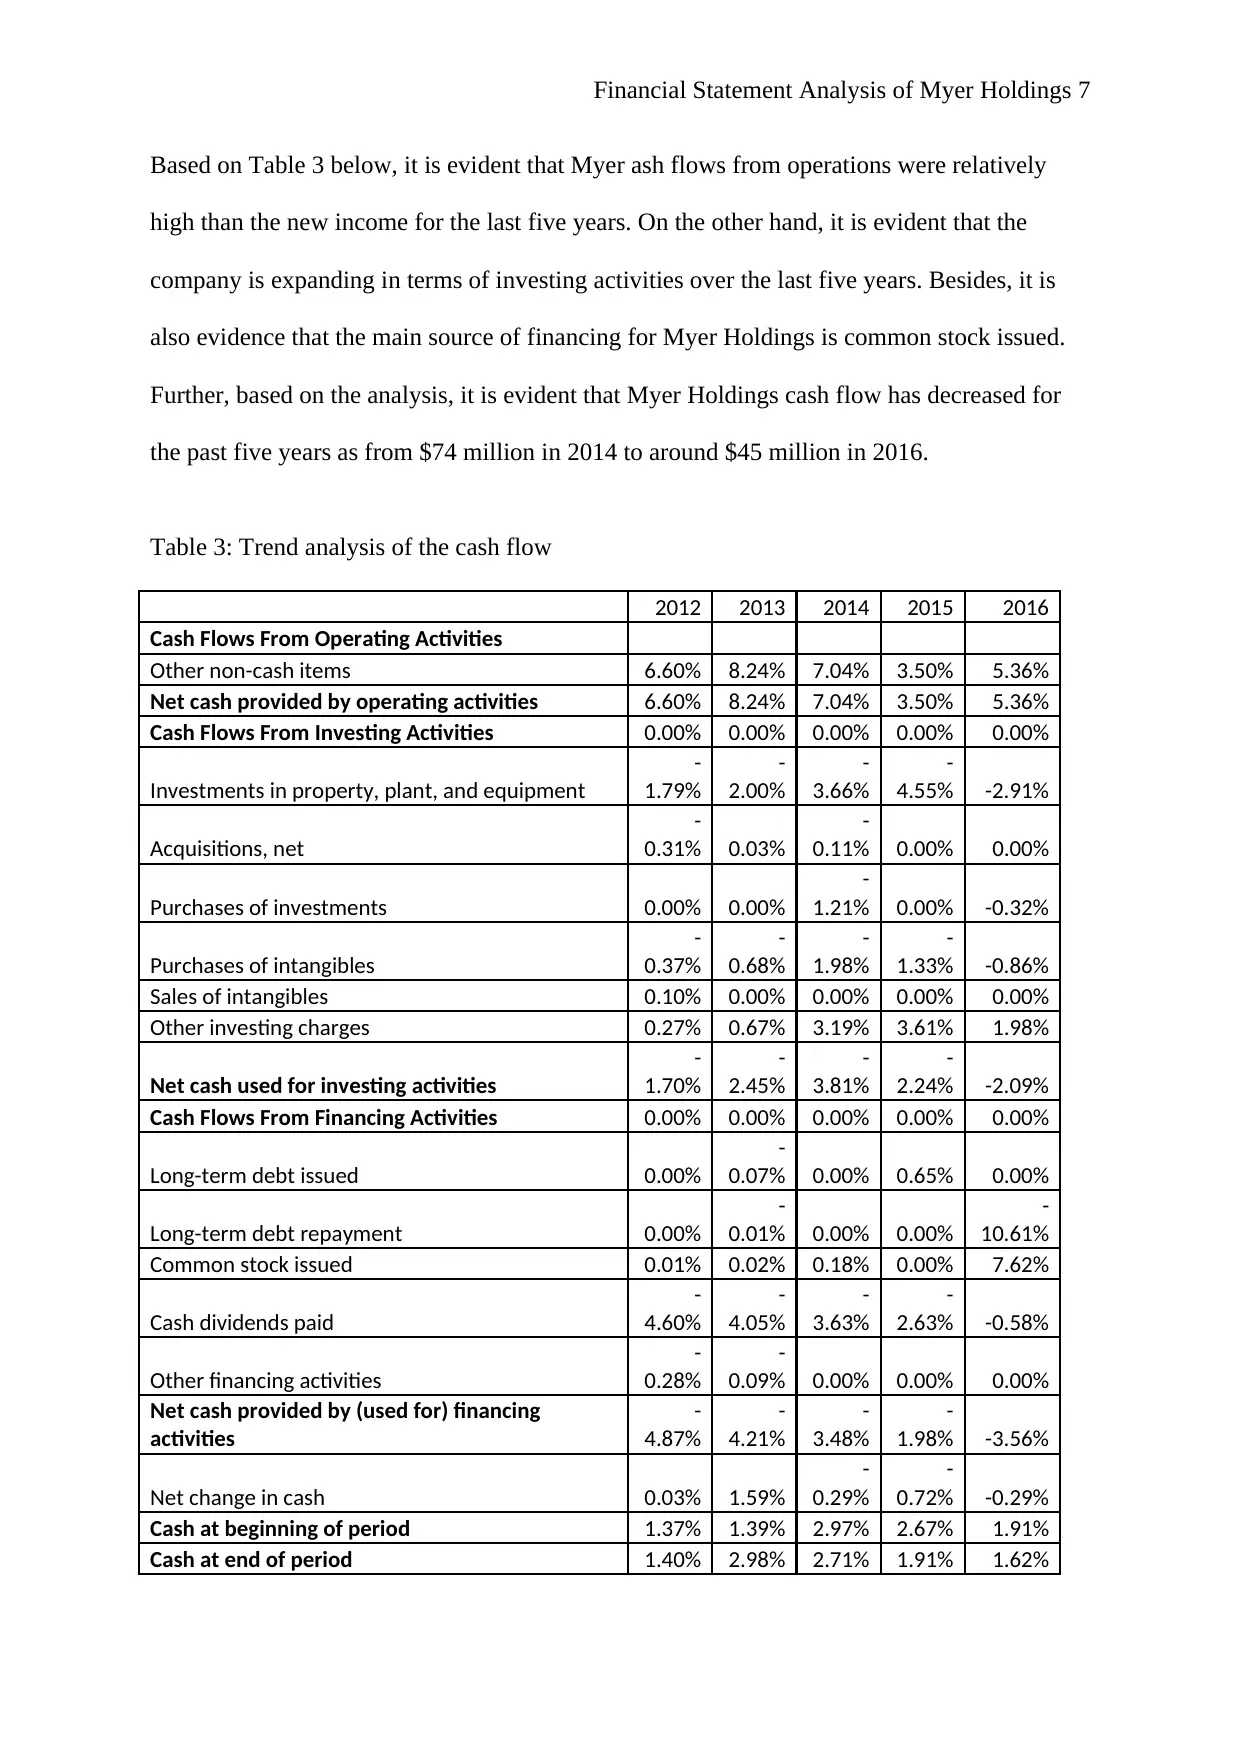
Based on Table 3 below, it is evident that Myer ash flows from operations were relatively
high than the new income for the last five years. On the other hand, it is evident that the
company is expanding in terms of investing activities over the last five years. Besides, it is
also evidence that the main source of financing for Myer Holdings is common stock issued.
Further, based on the analysis, it is evident that Myer Holdings cash flow has decreased for
the past five years as from $74 million in 2014 to around $45 million in 2016.
Table 3: Trend analysis of the cash flow
2012 2013 2014 2015 2016
Cash Flows From Operating Activities
Other non-cash items 6.60% 8.24% 7.04% 3.50% 5.36%
Net cash provided by operating activities 6.60% 8.24% 7.04% 3.50% 5.36%
Cash Flows From Investing Activities 0.00% 0.00% 0.00% 0.00% 0.00%
Investments in property, plant, and equipment
-
1.79%
-
2.00%
-
3.66%
-
4.55% -2.91%
Acquisitions, net
-
0.31% 0.03%
-
0.11% 0.00% 0.00%
Purchases of investments 0.00% 0.00%
-
1.21% 0.00% -0.32%
Purchases of intangibles
-
0.37%
-
0.68%
-
1.98%
-
1.33% -0.86%
Sales of intangibles 0.10% 0.00% 0.00% 0.00% 0.00%
Other investing charges 0.27% 0.67% 3.19% 3.61% 1.98%
Net cash used for investing activities
-
1.70%
-
2.45%
-
3.81%
-
2.24% -2.09%
Cash Flows From Financing Activities 0.00% 0.00% 0.00% 0.00% 0.00%
Long-term debt issued 0.00%
-
0.07% 0.00% 0.65% 0.00%
Long-term debt repayment 0.00%
-
0.01% 0.00% 0.00%
-
10.61%
Common stock issued 0.01% 0.02% 0.18% 0.00% 7.62%
Cash dividends paid
-
4.60%
-
4.05%
-
3.63%
-
2.63% -0.58%
Other financing activities
-
0.28%
-
0.09% 0.00% 0.00% 0.00%
Net cash provided by (used for) financing
activities
-
4.87%
-
4.21%
-
3.48%
-
1.98% -3.56%
Net change in cash 0.03% 1.59%
-
0.29%
-
0.72% -0.29%
Cash at beginning of period 1.37% 1.39% 2.97% 2.67% 1.91%
Cash at end of period 1.40% 2.98% 2.71% 1.91% 1.62%
Paraphrase This Document
Need a fresh take? Get an instant paraphrase of this document with our AI Paraphraser
Financial Statement Analysis of Myer Holdings 8
Ratio analysis
Ratio analysis is an important aspect that is used in analysis financial performance of a given
organization in numerous areas. In addition, ratio analysis is an important tool in comparing
an organization’s financial performance with the industry averages. It could also be utilized
in form of the trend analysis in identifying some of the areas where financial performance of
an organization deteriorated or improved over time (Chen & Shimerda 1981). In this case, the
most common ratio that will be used in analysis Myer Holding financial performance would
include; Liquidity ratios, market strength ratios, long-term solvency ratios, profitability ratios
as well as cash flow adequacy ratios
Liquidity ratios:
Working capital
This ratio is useful in measuring both an organization’s efficiency. It is usually computed by
subtracting an entity’s total current liabilities from its current assets (Lev & Sunder 1979). In
this case, the working capital for the past five years is as follows;
2012 = 441.5- 502.9 = -61.4
2013 = 479.2- 522.7 = -43.5
2014 = 480-531 = -51
2015 = 481 -481 = 0
2016 = 480 -521= -41
Current ratio
Financial Statement Analysis of Myer Holdings 9
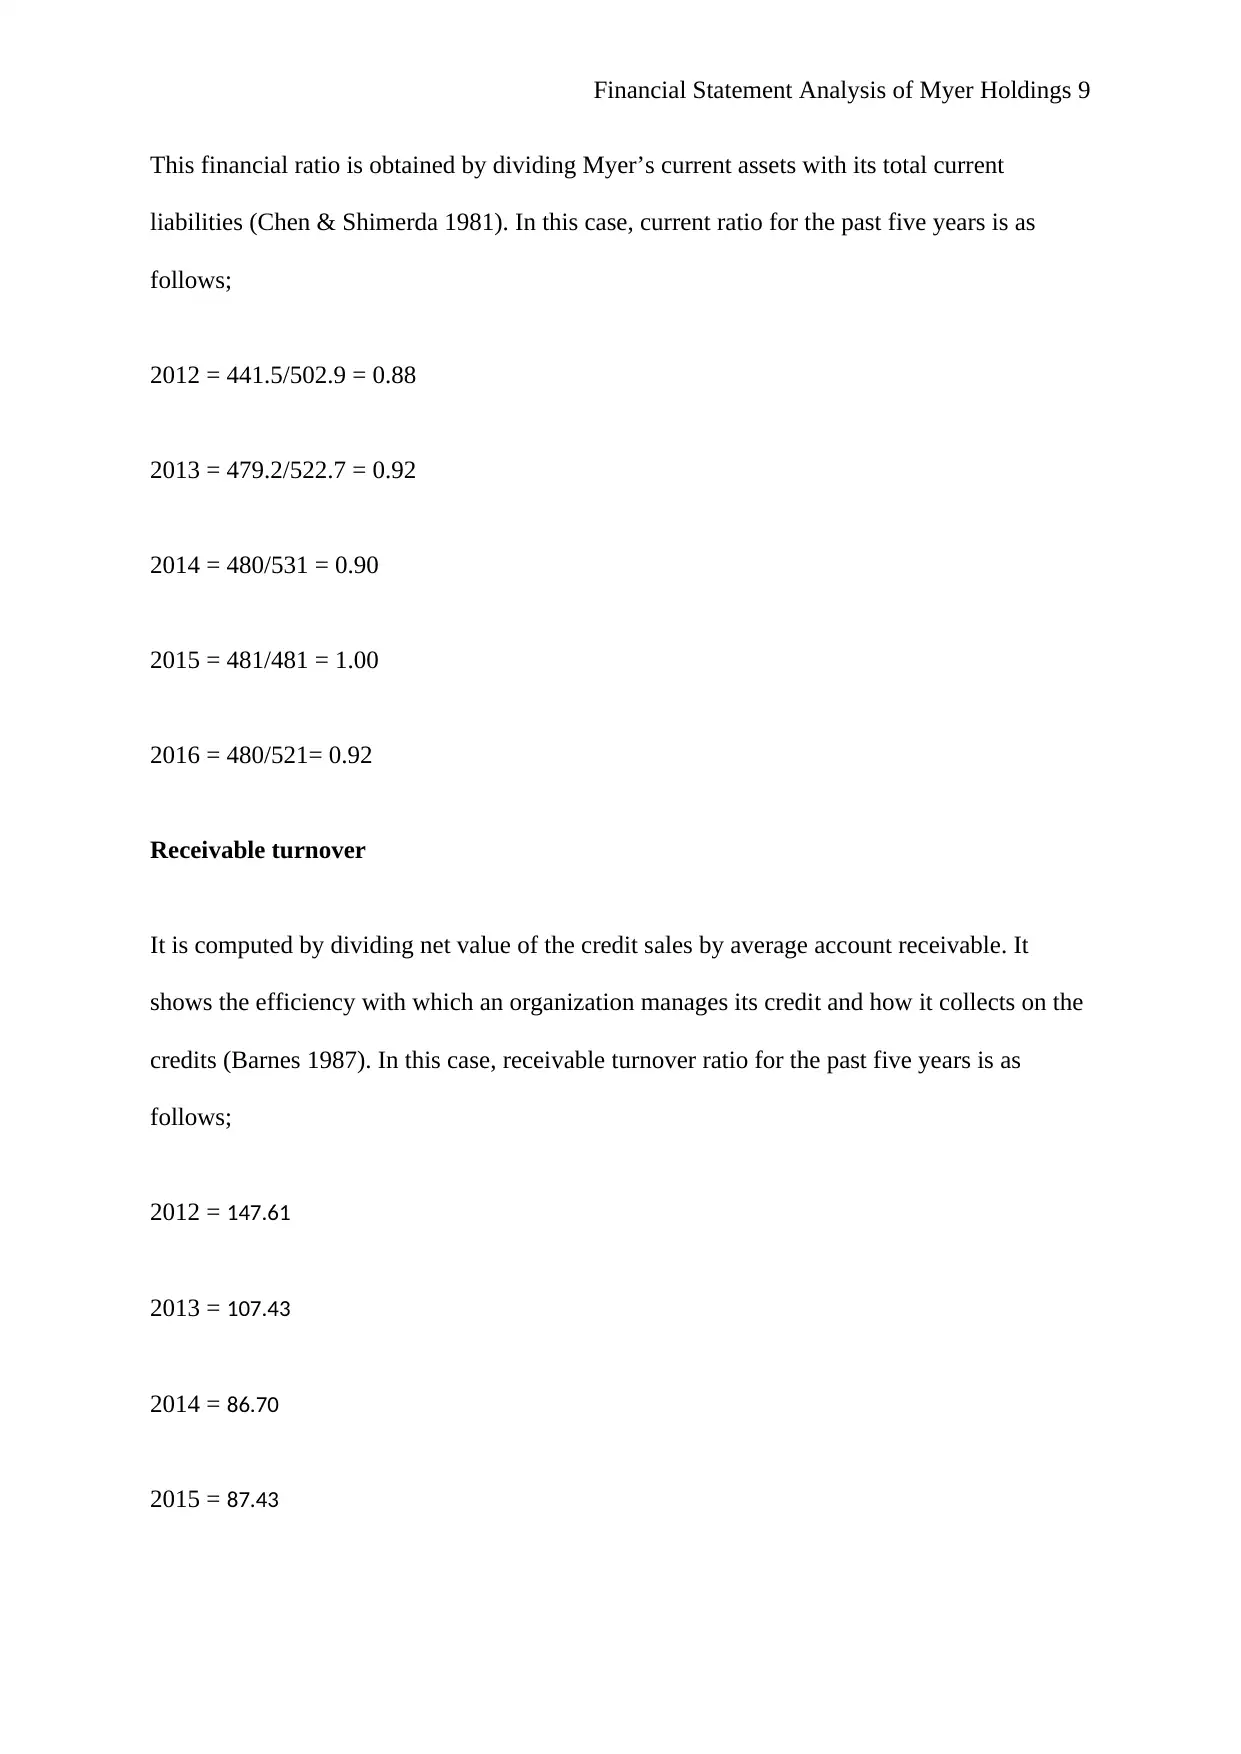
This financial ratio is obtained by dividing Myer’s current assets with its total current
liabilities (Chen & Shimerda 1981). In this case, current ratio for the past five years is as
follows;
2012 = 441.5/502.9 = 0.88
2013 = 479.2/522.7 = 0.92
2014 = 480/531 = 0.90
2015 = 481/481 = 1.00
2016 = 480/521= 0.92
Receivable turnover
It is computed by dividing net value of the credit sales by average account receivable. It
shows the efficiency with which an organization manages its credit and how it collects on the
credits (Barnes 1987). In this case, receivable turnover ratio for the past five years is as
follows;
2012 = 147.61
2013 = 107.43
2014 = 86.70
2015 = 87.43
⊘ This is a preview!⊘
Do you want full access?
Subscribe today to unlock all pages.
Trusted by 1+ million students worldwide

Financial Statement Analysis of Myer Holdings 10
2016 = 69.69
Average days’ sales uncollected
The ratio is used in measuring when an organization would actually receive cash from sales.
This is computed by dividing account receivable by net sales (Lev & Sunder 1979). In this
case, average day’s sales uncollected for the past five years are as follows;
2012 = 2.47
2013 = 3.40
2014 = 4.21
2015 = 4.17
2016 = 5.24
Inventory turnover
The ratio is used in measuring number of times inventories in an organization is utilized or
sold in a given period of time. It is obtained by dividing COGS by inventories (Barnes 1987).
In this case, inventory turnover ratio for the past five years is as follows;
2012 = 3.80
2013 = 3.99
2014 = 3.86
Paraphrase This Document
Need a fresh take? Get an instant paraphrase of this document with our AI Paraphraser
Financial Statement Analysis of Myer Holdings 11
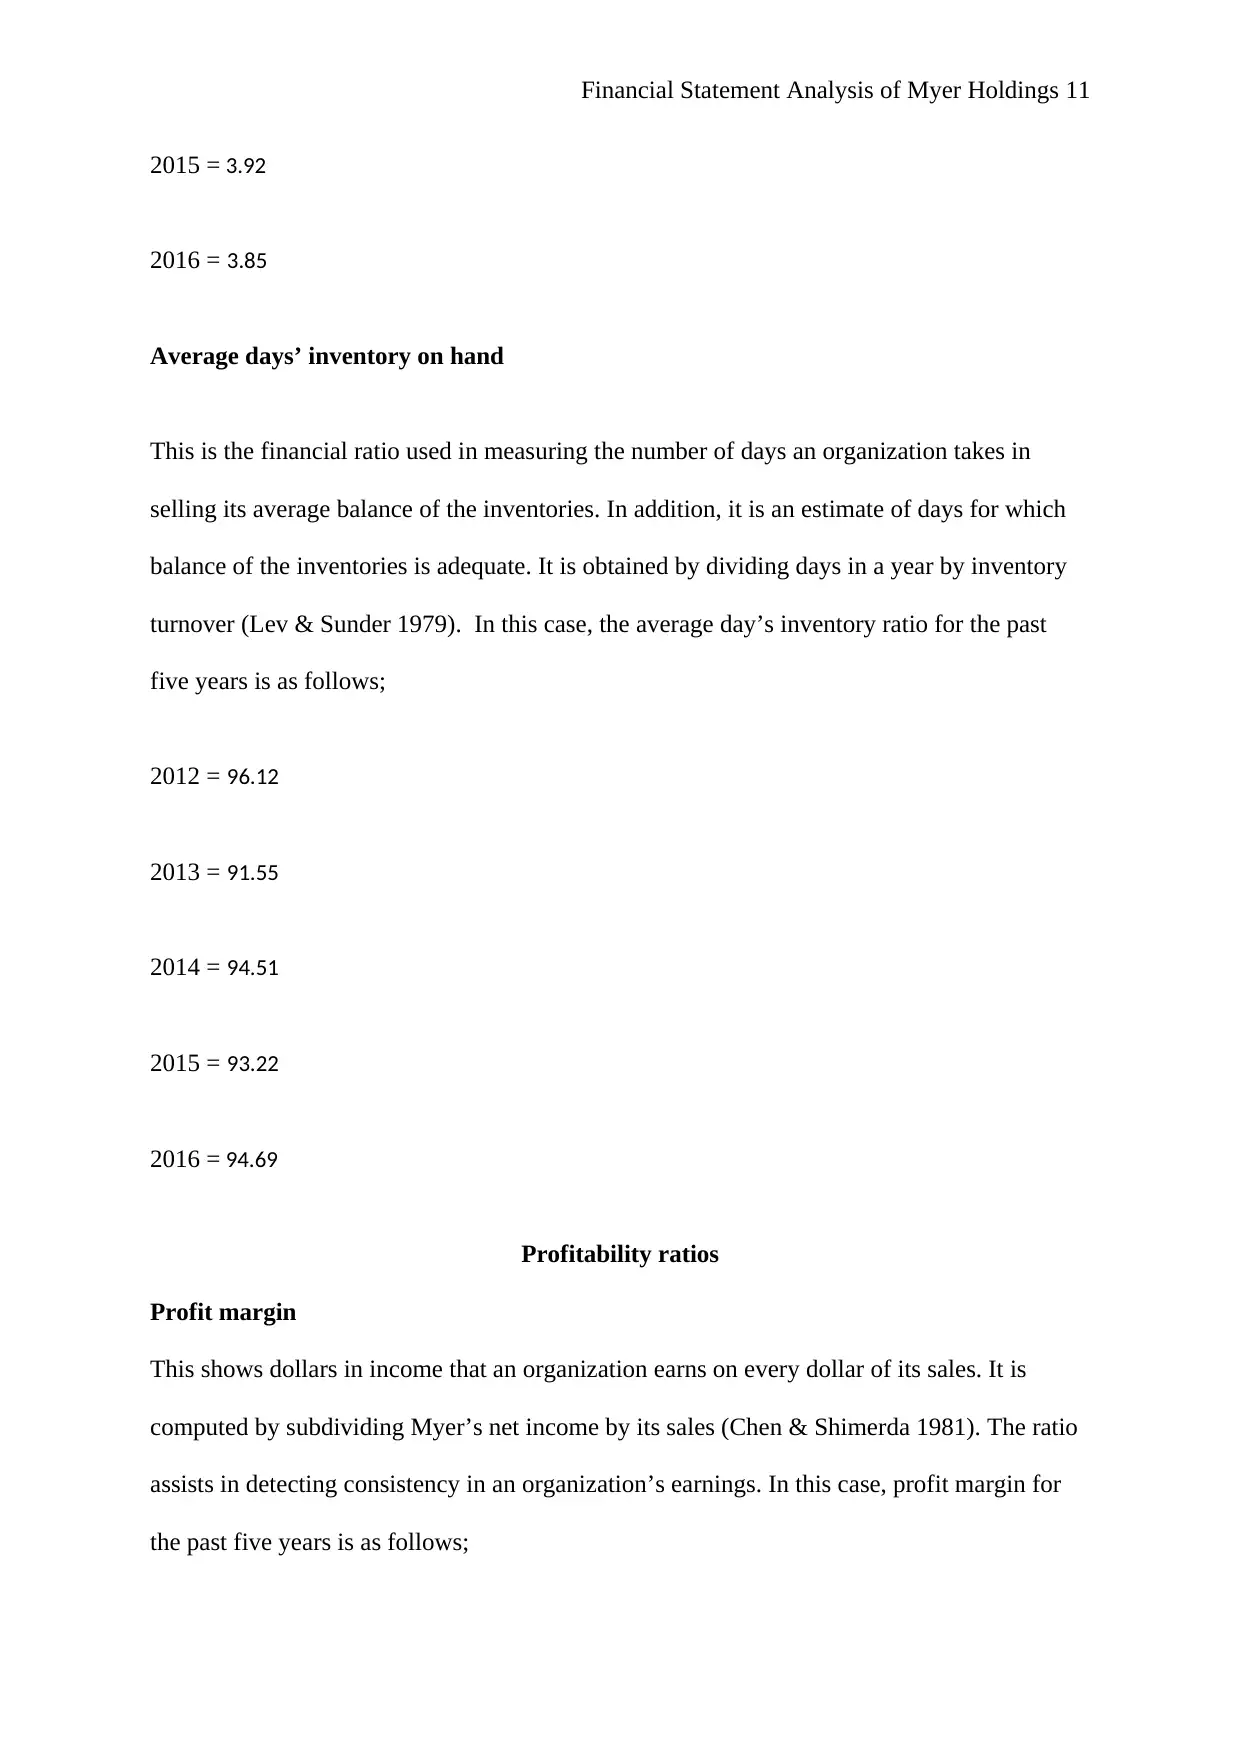
2015 = 3.92
2016 = 3.85
Average days’ inventory on hand
This is the financial ratio used in measuring the number of days an organization takes in
selling its average balance of the inventories. In addition, it is an estimate of days for which
balance of the inventories is adequate. It is obtained by dividing days in a year by inventory
turnover (Lev & Sunder 1979). In this case, the average day’s inventory ratio for the past
five years is as follows;
2012 = 96.12
2013 = 91.55
2014 = 94.51
2015 = 93.22
2016 = 94.69
Profitability ratios
Profit margin
This shows dollars in income that an organization earns on every dollar of its sales. It is
computed by subdividing Myer’s net income by its sales (Chen & Shimerda 1981). The ratio
assists in detecting consistency in an organization’s earnings. In this case, profit margin for
the past five years is as follows;
Financial Statement Analysis of Myer Holdings 12
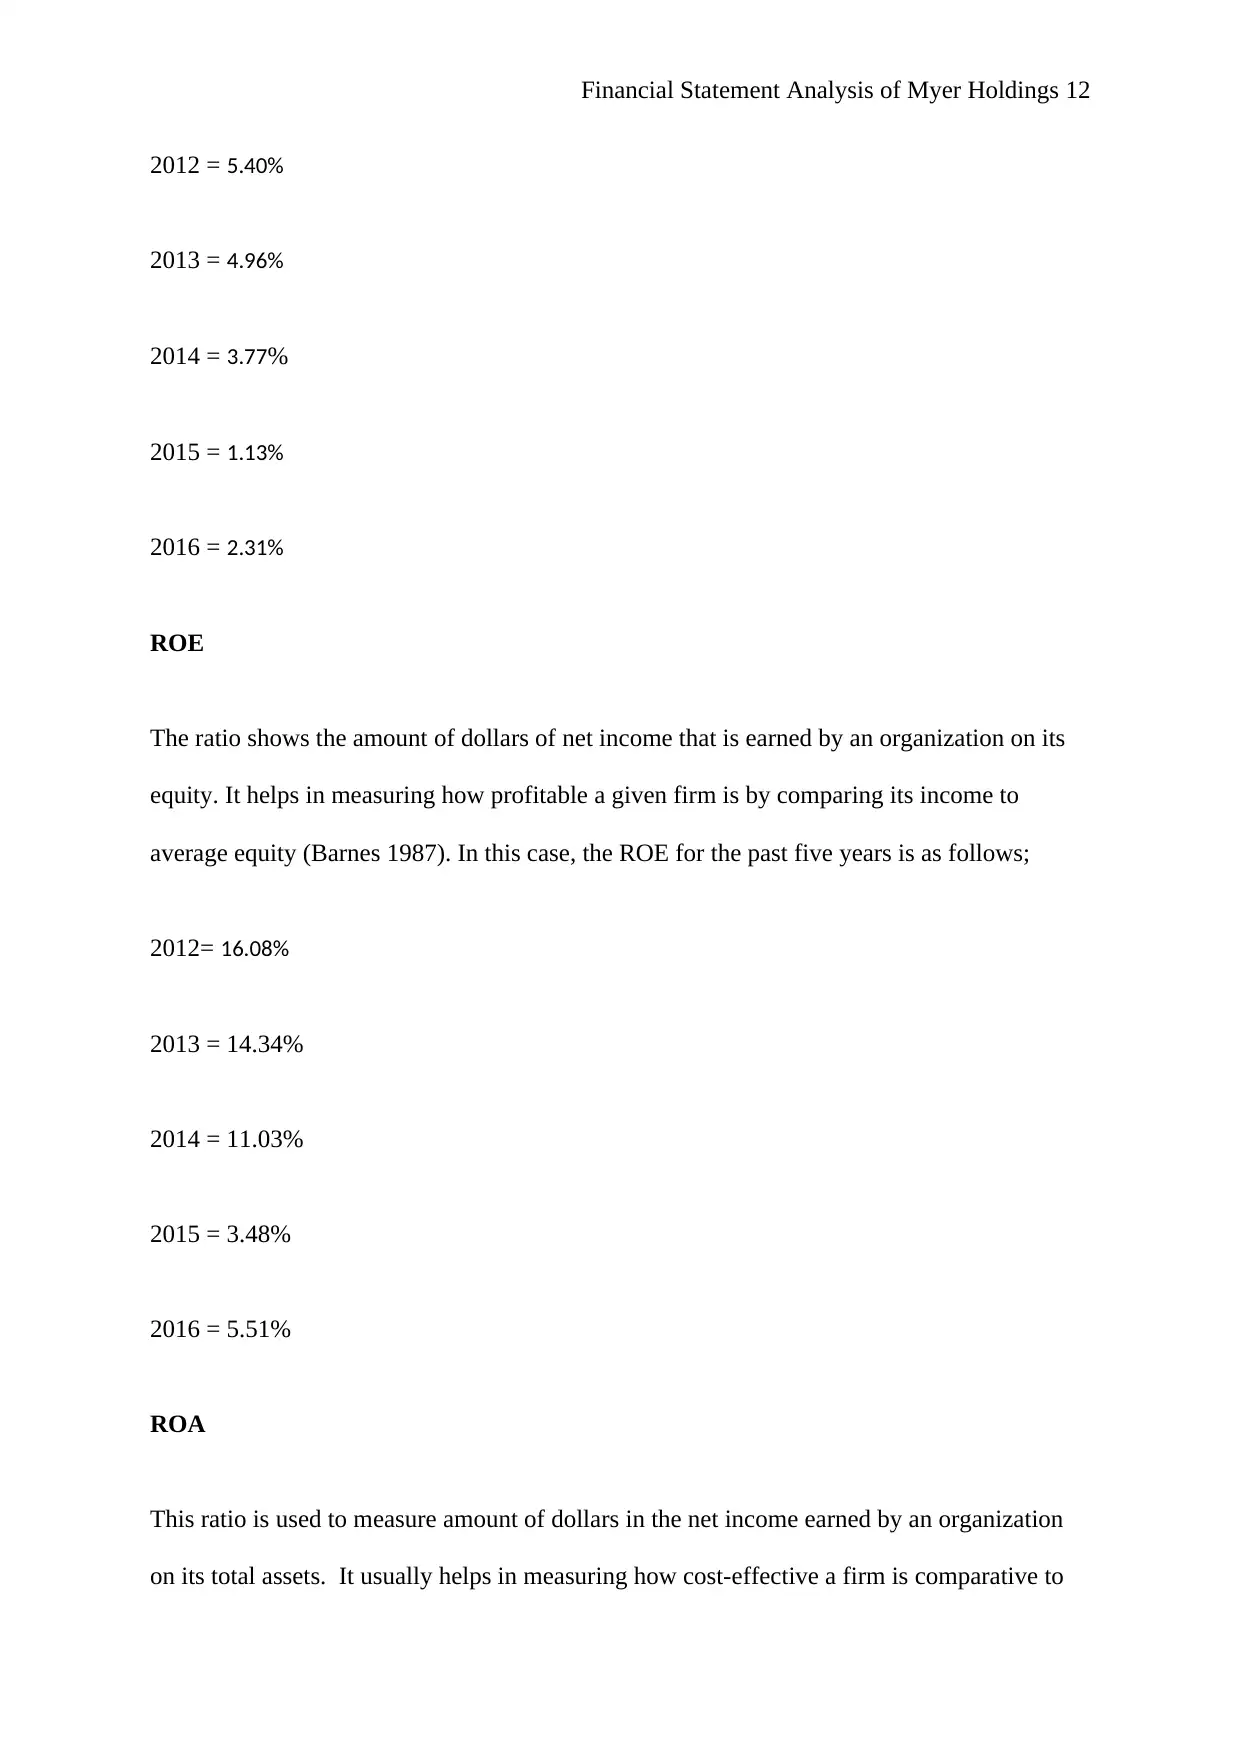
2012 = 5.40%
2013 = 4.96%
2014 = 3.77%
2015 = 1.13%
2016 = 2.31%
ROE
The ratio shows the amount of dollars of net income that is earned by an organization on its
equity. It helps in measuring how profitable a given firm is by comparing its income to
average equity (Barnes 1987). In this case, the ROE for the past five years is as follows;
2012= 16.08%
2013 = 14.34%
2014 = 11.03%
2015 = 3.48%
2016 = 5.51%
ROA
This ratio is used to measure amount of dollars in the net income earned by an organization
on its total assets. It usually helps in measuring how cost-effective a firm is comparative to
⊘ This is a preview!⊘
Do you want full access?
Subscribe today to unlock all pages.
Trusted by 1+ million students worldwide
1 out of 21
Related Documents


Your All-in-One AI-Powered Toolkit for Academic Success.
+13062052269
info@desklib.com
Available 24*7 on WhatsApp / Email
![[object Object]](/_next/static/media/star-bottom.7253800d.svg)
Unlock your academic potential
Copyright © 2020–2026 A2Z Services. All Rights Reserved. Developed and managed by ZUCOL.