Financial Statement Analysis Report
VerifiedAdded on 2019/12/03
|16
|4389
|28
Report
AI Summary
This report provides a comprehensive financial statement analysis of the Volkswagen Group, comparing its performance with that of Daimler Co. Ltd. The analysis utilizes both traditional and modern approaches, including comparative financial statements, common-size statements, cash flow analysis, fund flow analysis, and ratio analysis (profitability, liquidity, activity, and solvency ratios). The report examines trends in key financial metrics over a three-year period (2012-2014) and assesses the impact of internal and external factors on Volkswagen's financial performance. A comparative analysis with Daimler highlights key differences in profitability, liquidity, and solvency. The report concludes with recommendations for Volkswagen's shareholders, considering the company's financial position and performance trends.
FINANCIAL
STATEMENT
ANALYSIS
STATEMENT
ANALYSIS
Paraphrase This Document
Need a fresh take? Get an instant paraphrase of this document with our AI Paraphraser
Table of Contents
INTRODUCTION......................................................................................................................1
Financial statement analysis of Volkswagen....................................................................1
Financial statement analysis of Volkswagen group..........................................................2
Impact of internal and external factors on Volkswagen group.........................................7
Comparative analysis of Volkswagen with the competitor Daimler Co. Ltd...................8
Recommendation to the Volkswagen Group's shareholders...........................................11
CONCLUSION........................................................................................................................12
REFERENCES.........................................................................................................................13
Index of Tables
Table 1: Ratio Analysis of Volkswagen Group (In £)................................................................3
Table 2: Ratio Analysis of Daimler Co. Ltd. (In £)...................................................................8
Illustration Index
Illustration 1: Profitability ratio- Volkswagen Group................................................................4
Illustration 2: Debt and equity chart...........................................................................................4
Illustration 3: Current assets and Current liability.....................................................................5
Illustration 4: Net profit ratio of Volkswagen Group and Daimler Co. Ltd...............................9
Illustration 5: Earning per share of Volkswagen Group and Daimler........................................9
⊘ This is a preview!⊘
Do you want full access?
Subscribe today to unlock all pages.
Trusted by 1+ million students worldwide
INTRODUCTION
Every organization needs to prepare the financial statement so as to know their profits
and financial position. Moreover, financial statement helps the organization for analysis
purpose. Volkswagen is a German automotive manufacturing company started its operations
from 28 May, 1937. Headquarter of the company is situated in Wolfsburg, Lower Saxony.
The parent company of Volkswagen is Volkswagen Group. However, Audi, Skoda, Bentley,
Seat are its subsidiaries. The aim of the company is to become the largest car maker in the
world till the year 2018 and so on. The company is operating at international level and ranked
ninth in the fortune global 500 (Ormiston and Fraser, 2013). There are two division
established in the company involves automotive division and financial service division.
Production of cars and commercial vehicles such as trucks, buses and other auto parts have
taken place in the automotive division. However, facilities such as financing, banking, leasing
and dealing with customers prevail in the financial division. The report presents an analytical
view of Volkswagen's financial statements. Moreover, Daimler co. Ltd. is also analysed for
making comparative analysis of Volkswagen.
Financial statement analysis of Volkswagen
There are different approaches available to the company for analytical purpose. Such
analysis will help the company so as to make better and effective business decisions (Griffin,
2015). Financial statement analysis is the process of reviewing the financial statement so as
to identify the changes in different components such as assets, liabilities as well as income
and expenditures. It is important for different users such as investors, creditors, managers,
employees, shareholders, government and competitors.
Tradition Approach: Under the traditional approach, the company evaluate the
previous data that were reported in the previous financial statements. The approaches are
described below:
Comparative financial statements: It helps in identifying the business process over the
time period (Persons, 2011). It helps in making comparison between the income statement
and balance sheet for two different periods. Thus, it can be said that it helps in making
comparison the business operation results and financial status.
Common size financial statements: The limit of comparative financial statement is
that it determined the changes in absolute terms. However, common size statement helps in
identifying the changes in terms of percentage by taking a common base year. Thus, it can be
said that it overcomes the limits of comparative financial statements.
1 | P a g e
Paraphrase This Document
Need a fresh take? Get an instant paraphrase of this document with our AI Paraphraser
Cash flow statement: It helps in determining the changes in cash sources by analysing
cash inflows. Moreover, it also identifies those how such sources are employed in the
business by analysing the cash outflow (Wahlen, Baginski and Bradshaw, 2014).
Fund flow statement: Cash flow statement comprises only one component of finance
cash. On other hand, Fund flow statement makes analyse of all the fund sources and the
application of it.
Ratio Analysis: It is considered as an appropriate method for making financial
statement analysis because it provides a detailed analysis. Under this method, different type
of ratios is calculated so as to know the changes in different factors. This helps the
organization in identifying the changes in liquidity position, solvency position, working
capital and capital structure of the company. In addition to it, income statement can be
analysed by computing profitability ratios.
Modern Approach: Under the modern approach, benchmarking is the appropriate
method (Romic, 2011). It is the process of comparing the business performance to the other
company that lies in the same industry. It is the process of measuring the performance using a
specific factor such as cost per unit and productivity per unit.
Financial statement analysis of Volkswagen group
The financial statement of Volkswagen Group is analysed here by involving both
income statement and balance sheet. Different ratios are calculated from three financial
statement of the year 2012, 2013 and 2014 that are explained below:
Table 1: Ratio Analysis of Volkswagen Group (In £)
Ratios Formula 2014 2013 2012
2 | P a g e
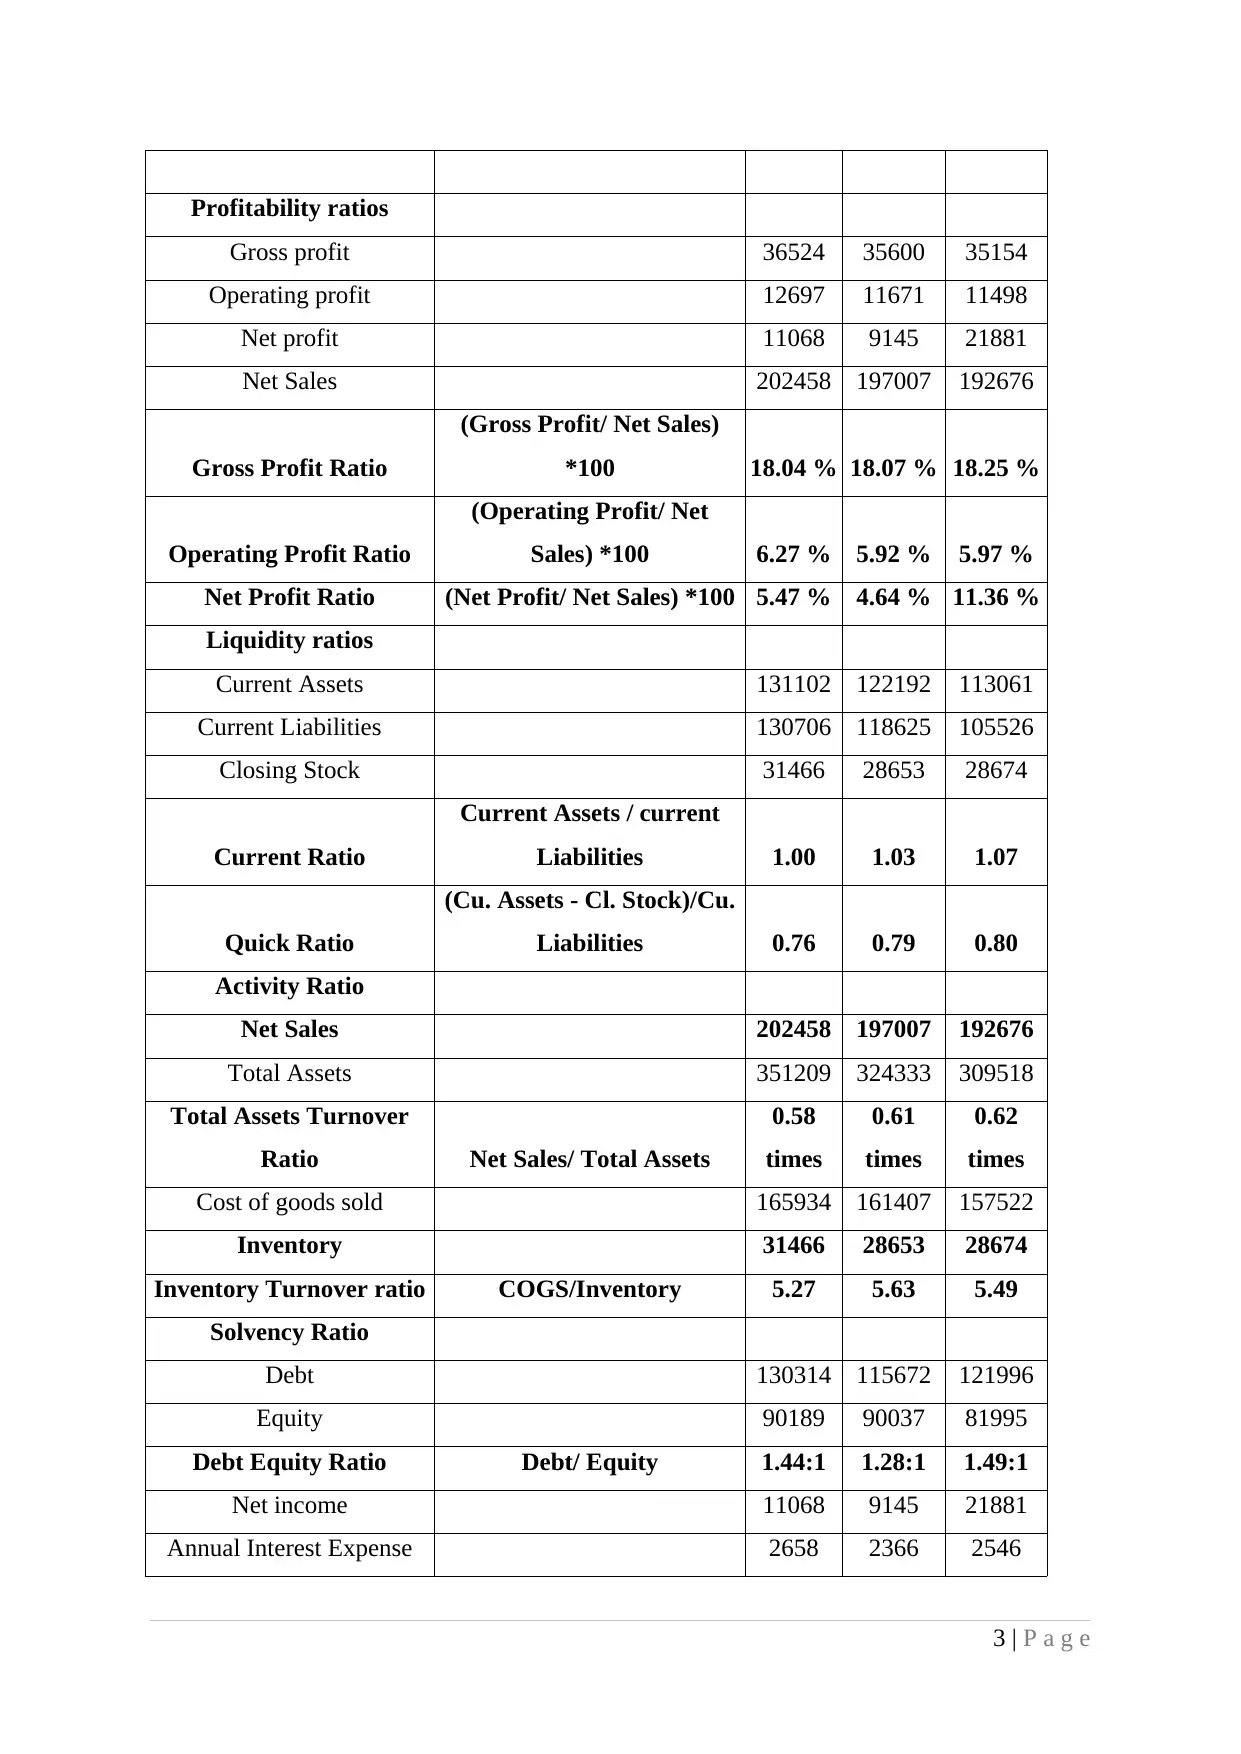
Profitability ratios
Gross profit 36524 35600 35154
Operating profit 12697 11671 11498
Net profit 11068 9145 21881
Net Sales 202458 197007 192676
Gross Profit Ratio
(Gross Profit/ Net Sales)
*100 18.04 % 18.07 % 18.25 %
Operating Profit Ratio
(Operating Profit/ Net
Sales) *100 6.27 % 5.92 % 5.97 %
Net Profit Ratio (Net Profit/ Net Sales) *100 5.47 % 4.64 % 11.36 %
Liquidity ratios
Current Assets 131102 122192 113061
Current Liabilities 130706 118625 105526
Closing Stock 31466 28653 28674
Current Ratio
Current Assets / current
Liabilities 1.00 1.03 1.07
Quick Ratio
(Cu. Assets - Cl. Stock)/Cu.
Liabilities 0.76 0.79 0.80
Activity Ratio
Net Sales 202458 197007 192676
Total Assets 351209 324333 309518
Total Assets Turnover
Ratio Net Sales/ Total Assets
0.58
times
0.61
times
0.62
times
Cost of goods sold 165934 161407 157522
Inventory 31466 28653 28674
Inventory Turnover ratio COGS/Inventory 5.27 5.63 5.49
Solvency Ratio
Debt 130314 115672 121996
Equity 90189 90037 81995
Debt Equity Ratio Debt/ Equity 1.44:1 1.28:1 1.49:1
Net income 11068 9145 21881
Annual Interest Expense 2658 2366 2546
3 | P a g e
⊘ This is a preview!⊘
Do you want full access?
Subscribe today to unlock all pages.
Trusted by 1+ million students worldwide
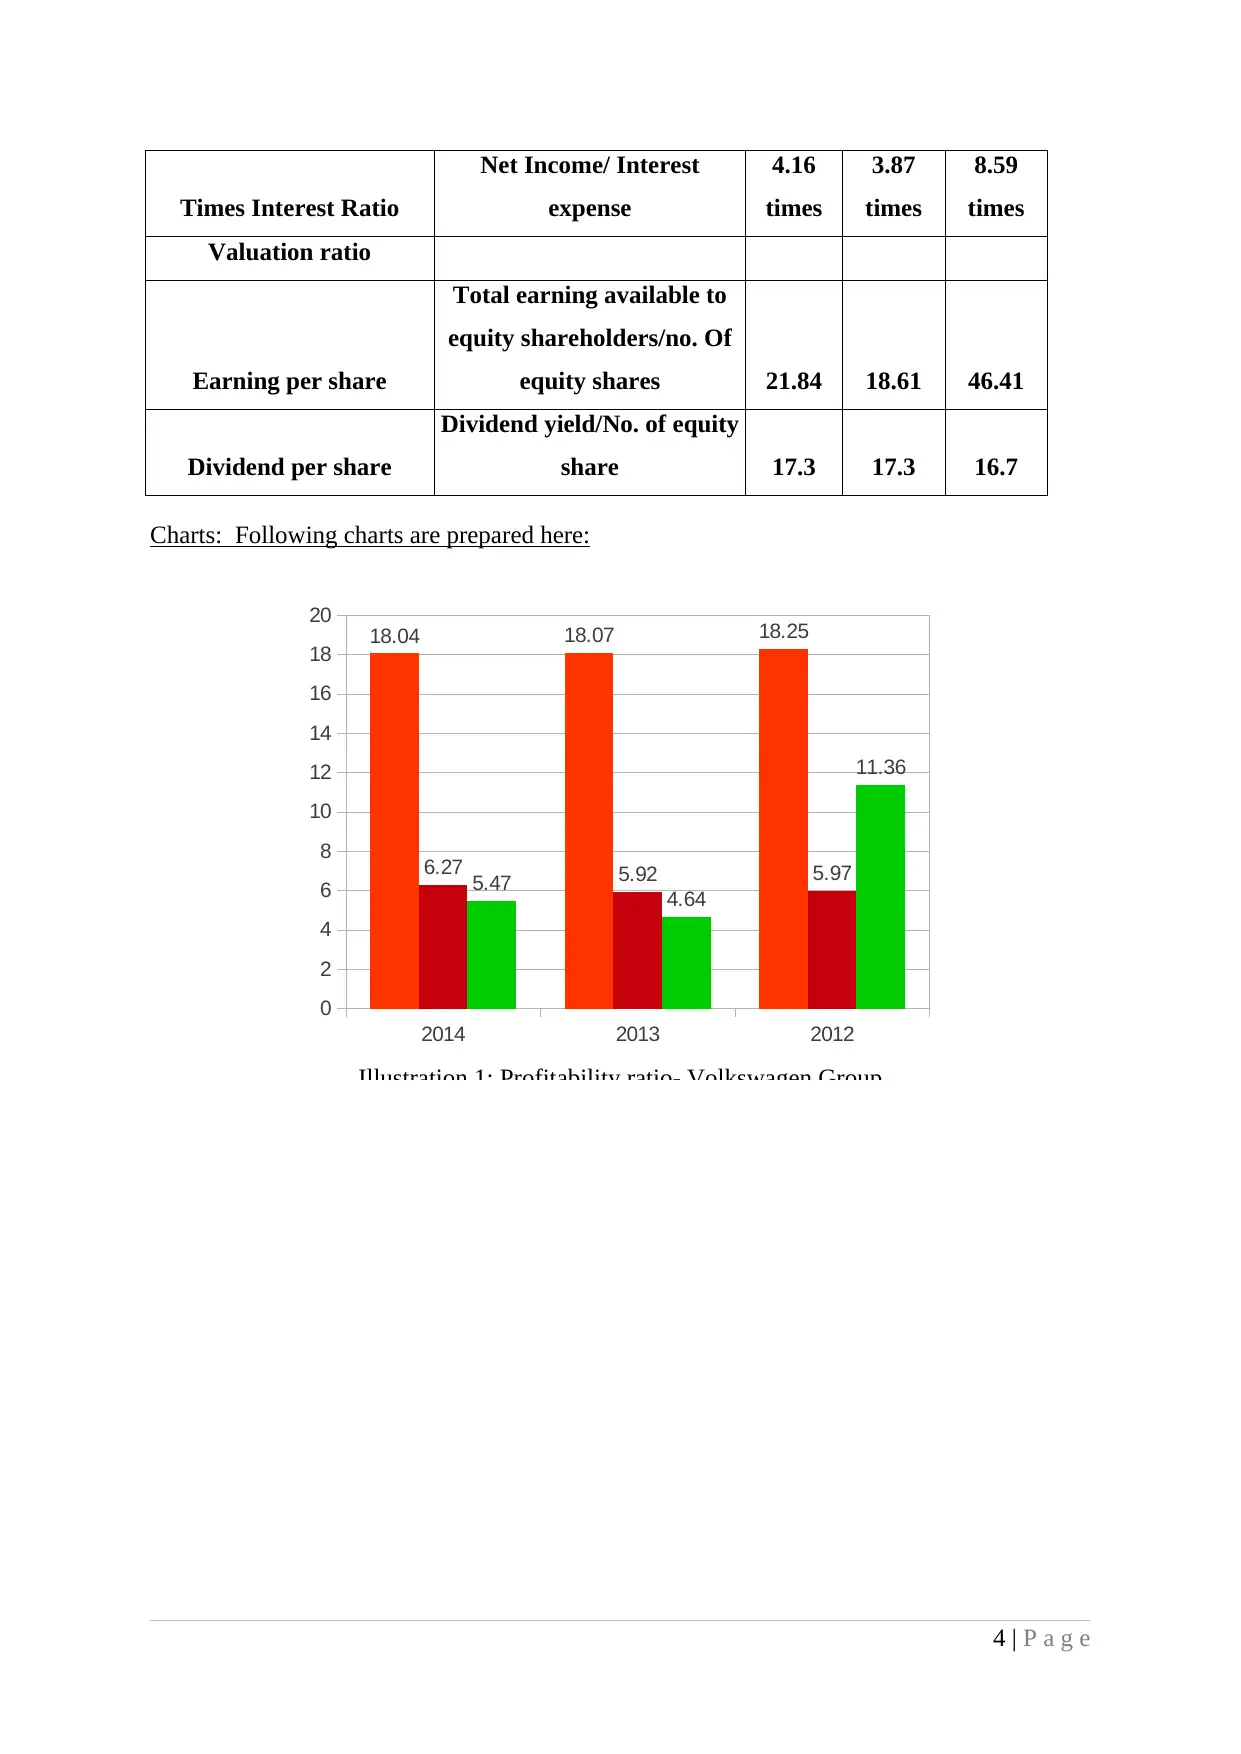
Times Interest Ratio
Net Income/ Interest
expense
4.16
times
3.87
times
8.59
times
Valuation ratio
Earning per share
Total earning available to
equity shareholders/no. Of
equity shares 21.84 18.61 46.41
Dividend per share
Dividend yield/No. of equity
share 17.3 17.3 16.7
Charts: Following charts are prepared here:
4 | P a g e
2014 2013 2012
0
2
4
6
8
10
12
14
16
18
20
18.04 18.07 18.25
6.27 5.92 5.975.47 4.64
11.36
Illustration 1: Profitability ratio- Volkswagen Group
Paraphrase This Document
Need a fresh take? Get an instant paraphrase of this document with our AI Paraphraser
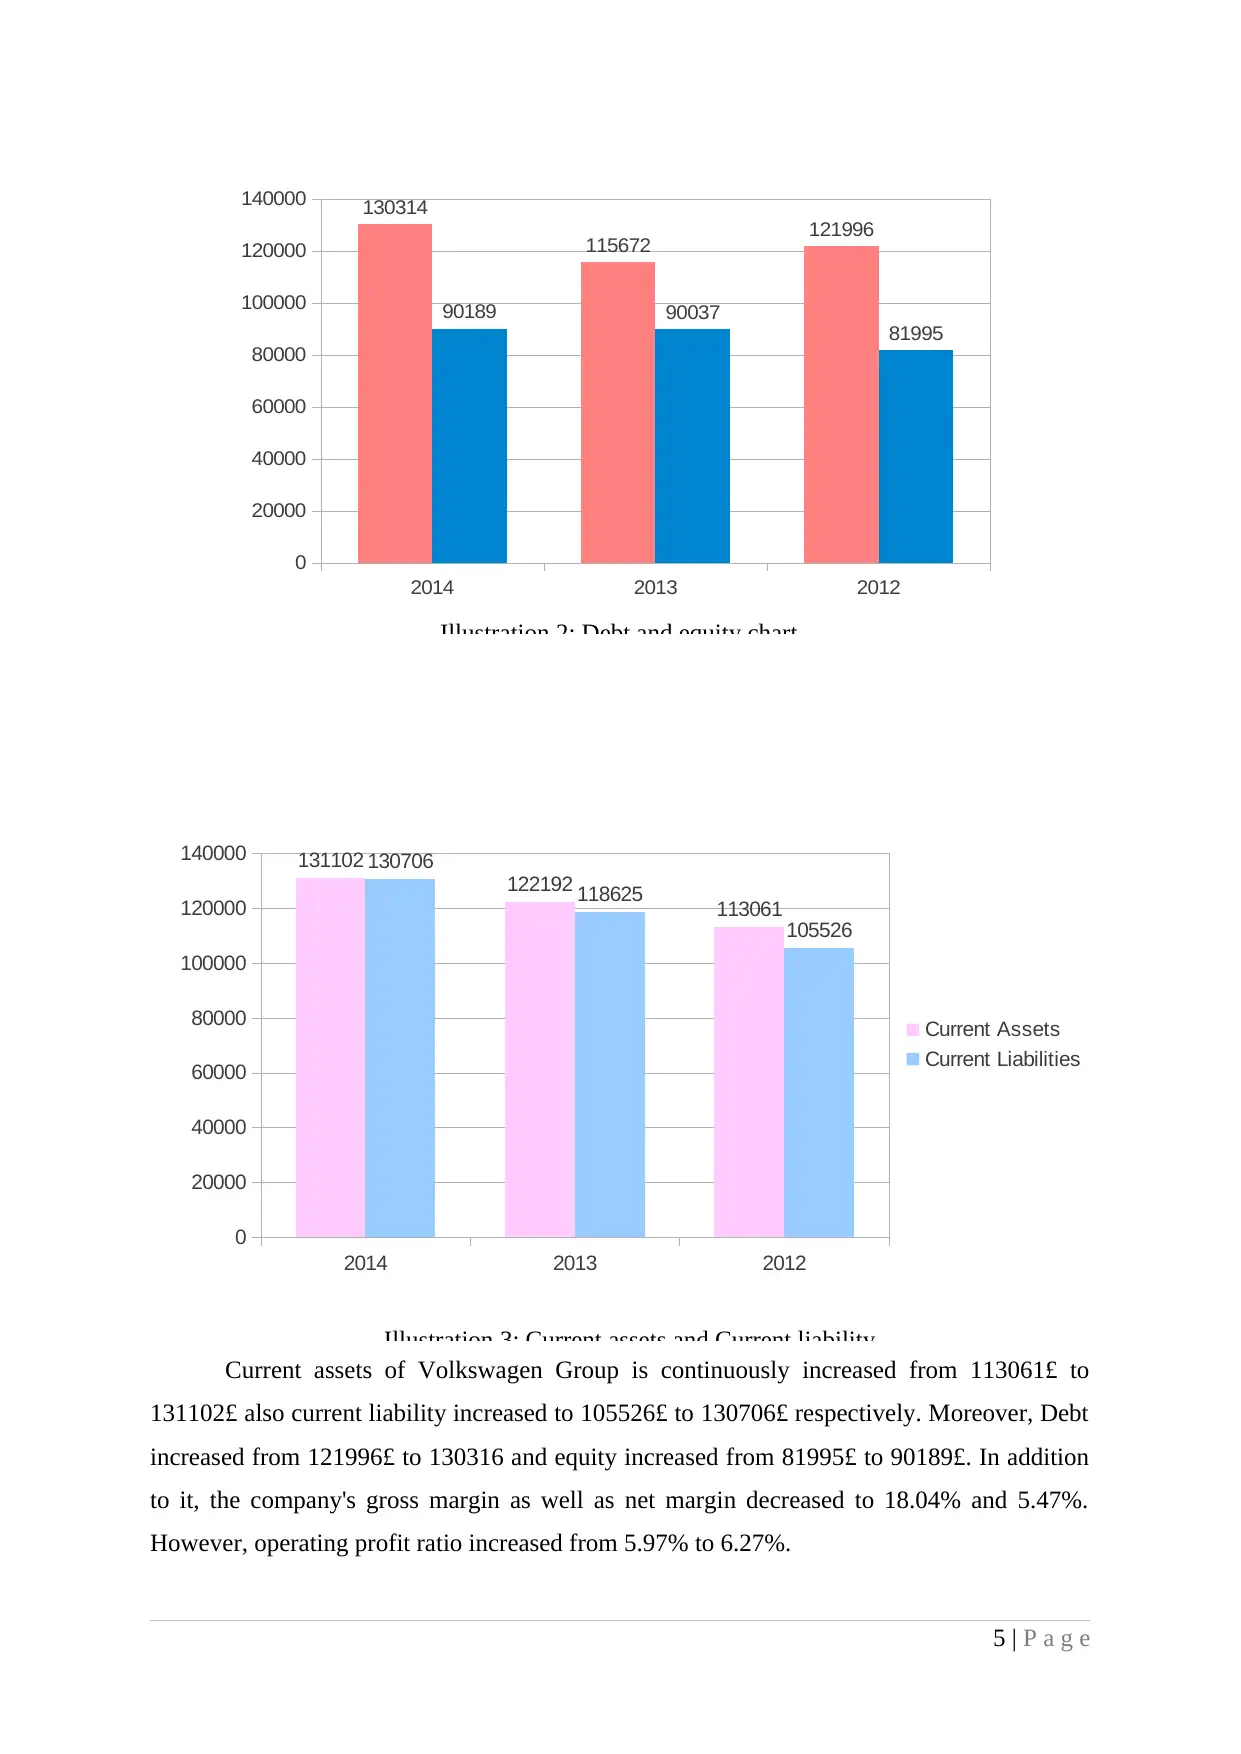
Current assets of Volkswagen Group is continuously increased from 113061£ to
131102£ also current liability increased to 105526£ to 130706£ respectively. Moreover, Debt
increased from 121996£ to 130316 and equity increased from 81995£ to 90189£. In addition
to it, the company's gross margin as well as net margin decreased to 18.04% and 5.47%.
However, operating profit ratio increased from 5.97% to 6.27%.
5 | P a g e
2014 2013 2012
0
20000
40000
60000
80000
100000
120000
140000 130314
115672 121996
90189 90037
81995
Illustration 2: Debt and equity chart
2014 2013 2012
0
20000
40000
60000
80000
100000
120000
140000 131102
122192
113061
130706
118625
105526
Current Assets
Current Liabilities
Illustration 3: Current assets and Current liability
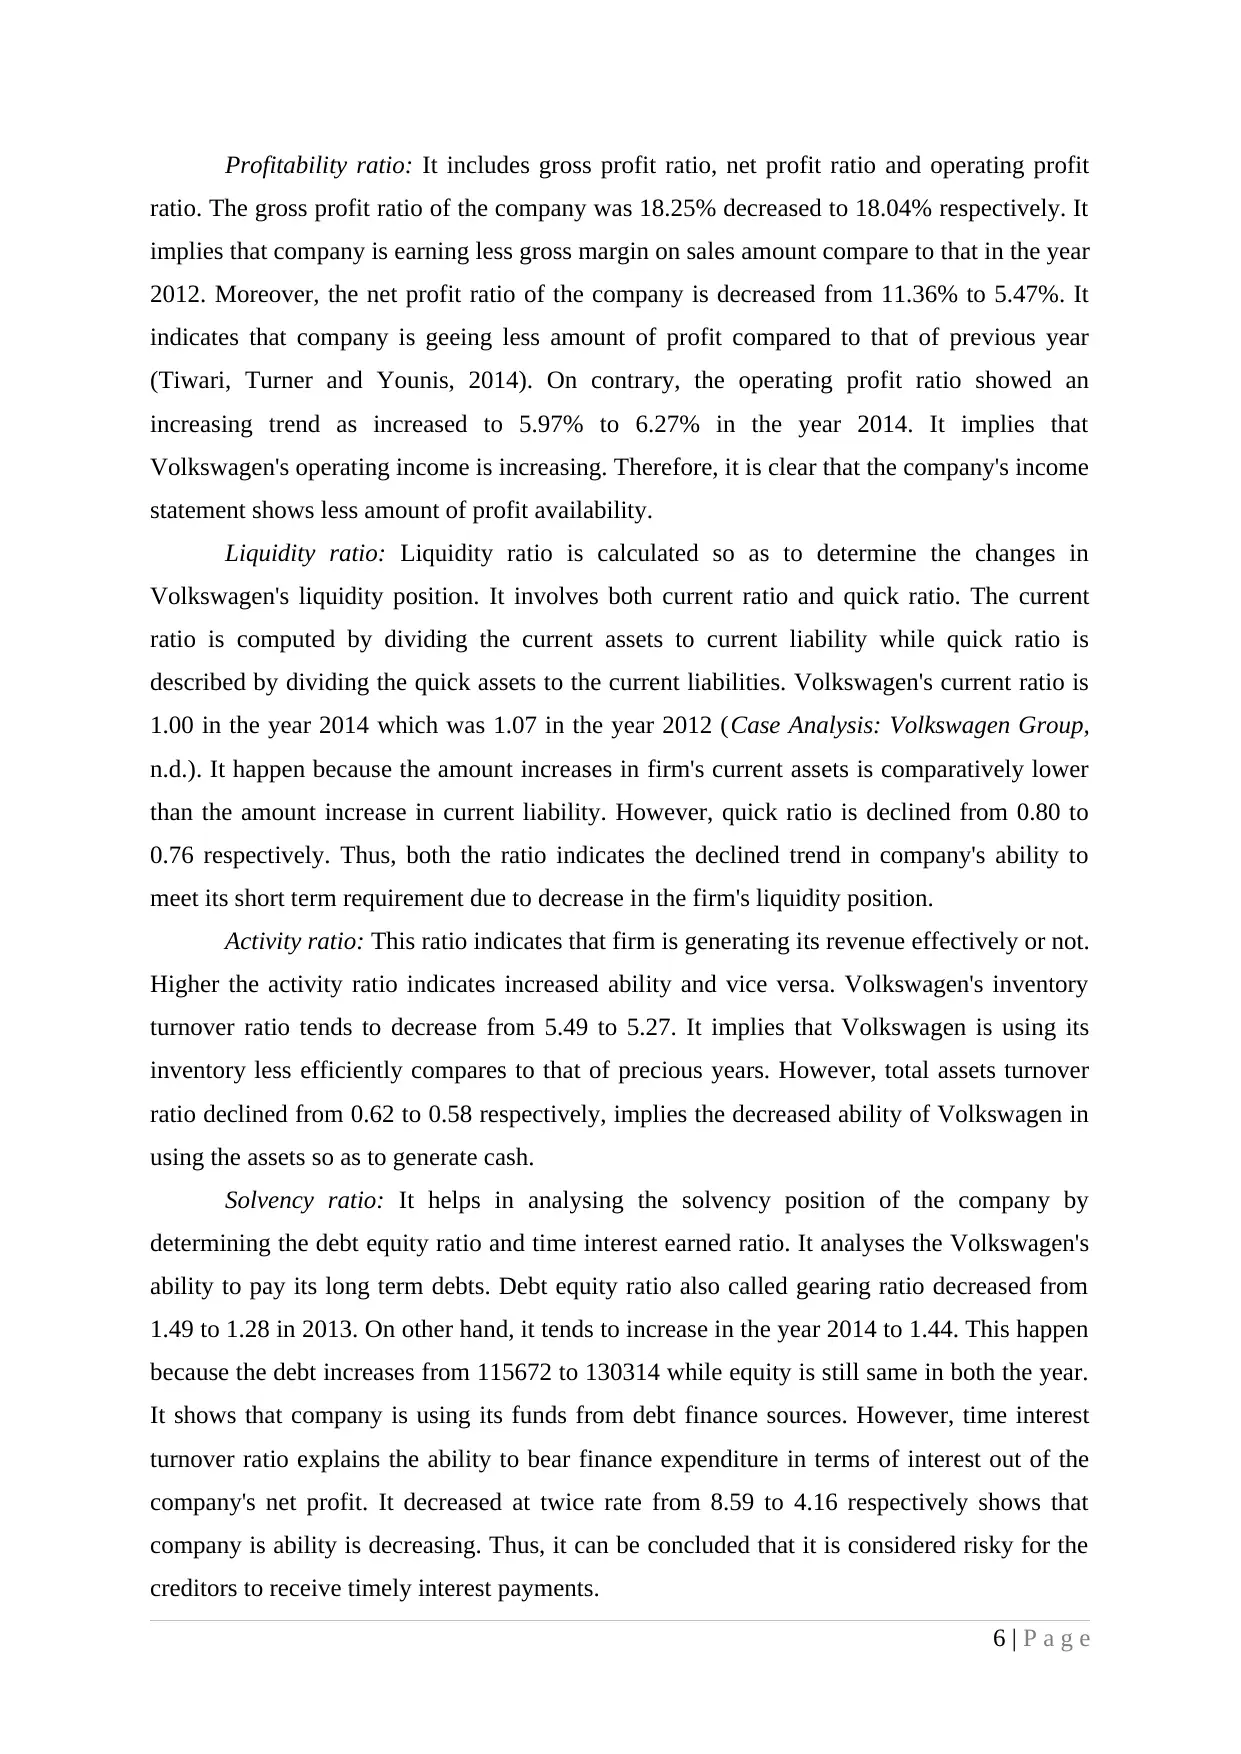
Profitability ratio: It includes gross profit ratio, net profit ratio and operating profit
ratio. The gross profit ratio of the company was 18.25% decreased to 18.04% respectively. It
implies that company is earning less gross margin on sales amount compare to that in the year
2012. Moreover, the net profit ratio of the company is decreased from 11.36% to 5.47%. It
indicates that company is geeing less amount of profit compared to that of previous year
(Tiwari, Turner and Younis, 2014). On contrary, the operating profit ratio showed an
increasing trend as increased to 5.97% to 6.27% in the year 2014. It implies that
Volkswagen's operating income is increasing. Therefore, it is clear that the company's income
statement shows less amount of profit availability.
Liquidity ratio: Liquidity ratio is calculated so as to determine the changes in
Volkswagen's liquidity position. It involves both current ratio and quick ratio. The current
ratio is computed by dividing the current assets to current liability while quick ratio is
described by dividing the quick assets to the current liabilities. Volkswagen's current ratio is
1.00 in the year 2014 which was 1.07 in the year 2012 (Case Analysis: Volkswagen Group,
n.d.). It happen because the amount increases in firm's current assets is comparatively lower
than the amount increase in current liability. However, quick ratio is declined from 0.80 to
0.76 respectively. Thus, both the ratio indicates the declined trend in company's ability to
meet its short term requirement due to decrease in the firm's liquidity position.
Activity ratio: This ratio indicates that firm is generating its revenue effectively or not.
Higher the activity ratio indicates increased ability and vice versa. Volkswagen's inventory
turnover ratio tends to decrease from 5.49 to 5.27. It implies that Volkswagen is using its
inventory less efficiently compares to that of precious years. However, total assets turnover
ratio declined from 0.62 to 0.58 respectively, implies the decreased ability of Volkswagen in
using the assets so as to generate cash.
Solvency ratio: It helps in analysing the solvency position of the company by
determining the debt equity ratio and time interest earned ratio. It analyses the Volkswagen's
ability to pay its long term debts. Debt equity ratio also called gearing ratio decreased from
1.49 to 1.28 in 2013. On other hand, it tends to increase in the year 2014 to 1.44. This happen
because the debt increases from 115672 to 130314 while equity is still same in both the year.
It shows that company is using its funds from debt finance sources. However, time interest
turnover ratio explains the ability to bear finance expenditure in terms of interest out of the
company's net profit. It decreased at twice rate from 8.59 to 4.16 respectively shows that
company is ability is decreasing. Thus, it can be concluded that it is considered risky for the
creditors to receive timely interest payments.
6 | P a g e
⊘ This is a preview!⊘
Do you want full access?
Subscribe today to unlock all pages.
Trusted by 1+ million students worldwide
Earning per share: The earning per share of the company was 41.61 in the year 2012
decreased to 18.61 in the year 2013. However, in the year 2014, it improved to 21.84.
Therefore, it can be concluded that company is provided more return to the shareholders in
the year 2014 as compared to previous year.
Dividend per share: The dividend per share of Volkswagen group was 16.7 in the year
2013 get increased to 17.30 remains constant in the next year. Thus, it shows that company
declared more dividends in the year 2014 comparatively than year 2013.
Impact of internal and external factors on Volkswagen group
There are two factors that affect the organization in different ways internal as well as
external factors. Internal factors prevail in the organization thus can be controlled by the
organization. It involves the changes in culture, organization structure, management and
employees (Petersen and Plenborg, 2012). However, external factors changes due to change
in market behaviour. It includes changes in political, environmental, economical and
technological environment.
Political factors: Every country has different political environment comprise the
government policies, rules and regulations. Volkswagen operates in a widespread area in the
world. Thus, such factors affect the organization to a great extent (Sinha, 2012). The policies
regarding different type of service industries such as banking and insurance influence the
financial service sector division. If the vehicle loans are available at lower interest rates than
it affects Volkswagen in a positive direction and vice versa.
Economic Environment: each and every organization contributes in the country's
economic development in terms of gross domestic product and per capita income. Moreover,
it can be measured in terms of quality of life. Volkswagen provides an improved lifestyle to
the citizens and develops its line of industry also.
Technological factors: Volkswagen is a manufacturing company therefore;
technology plays a very important role in the organization success. The company is regularly
upgrading its technology according to the market requirement. The best example of it is Audi
and Skoda produced by the company using advance technology.
Environmental factors: It is the responsibility of every organization not to pollute the
environment. Volkswagen is using variety of raw material for production. Moreover, the
industrial waste and use of petrol and diesel in commercial vehicles is the reason for
pollution. Thus, the company has to make policies with a view to recycle the waste and also
follow the environmental rules.
7 | P a g e
Paraphrase This Document
Need a fresh take? Get an instant paraphrase of this document with our AI Paraphraser
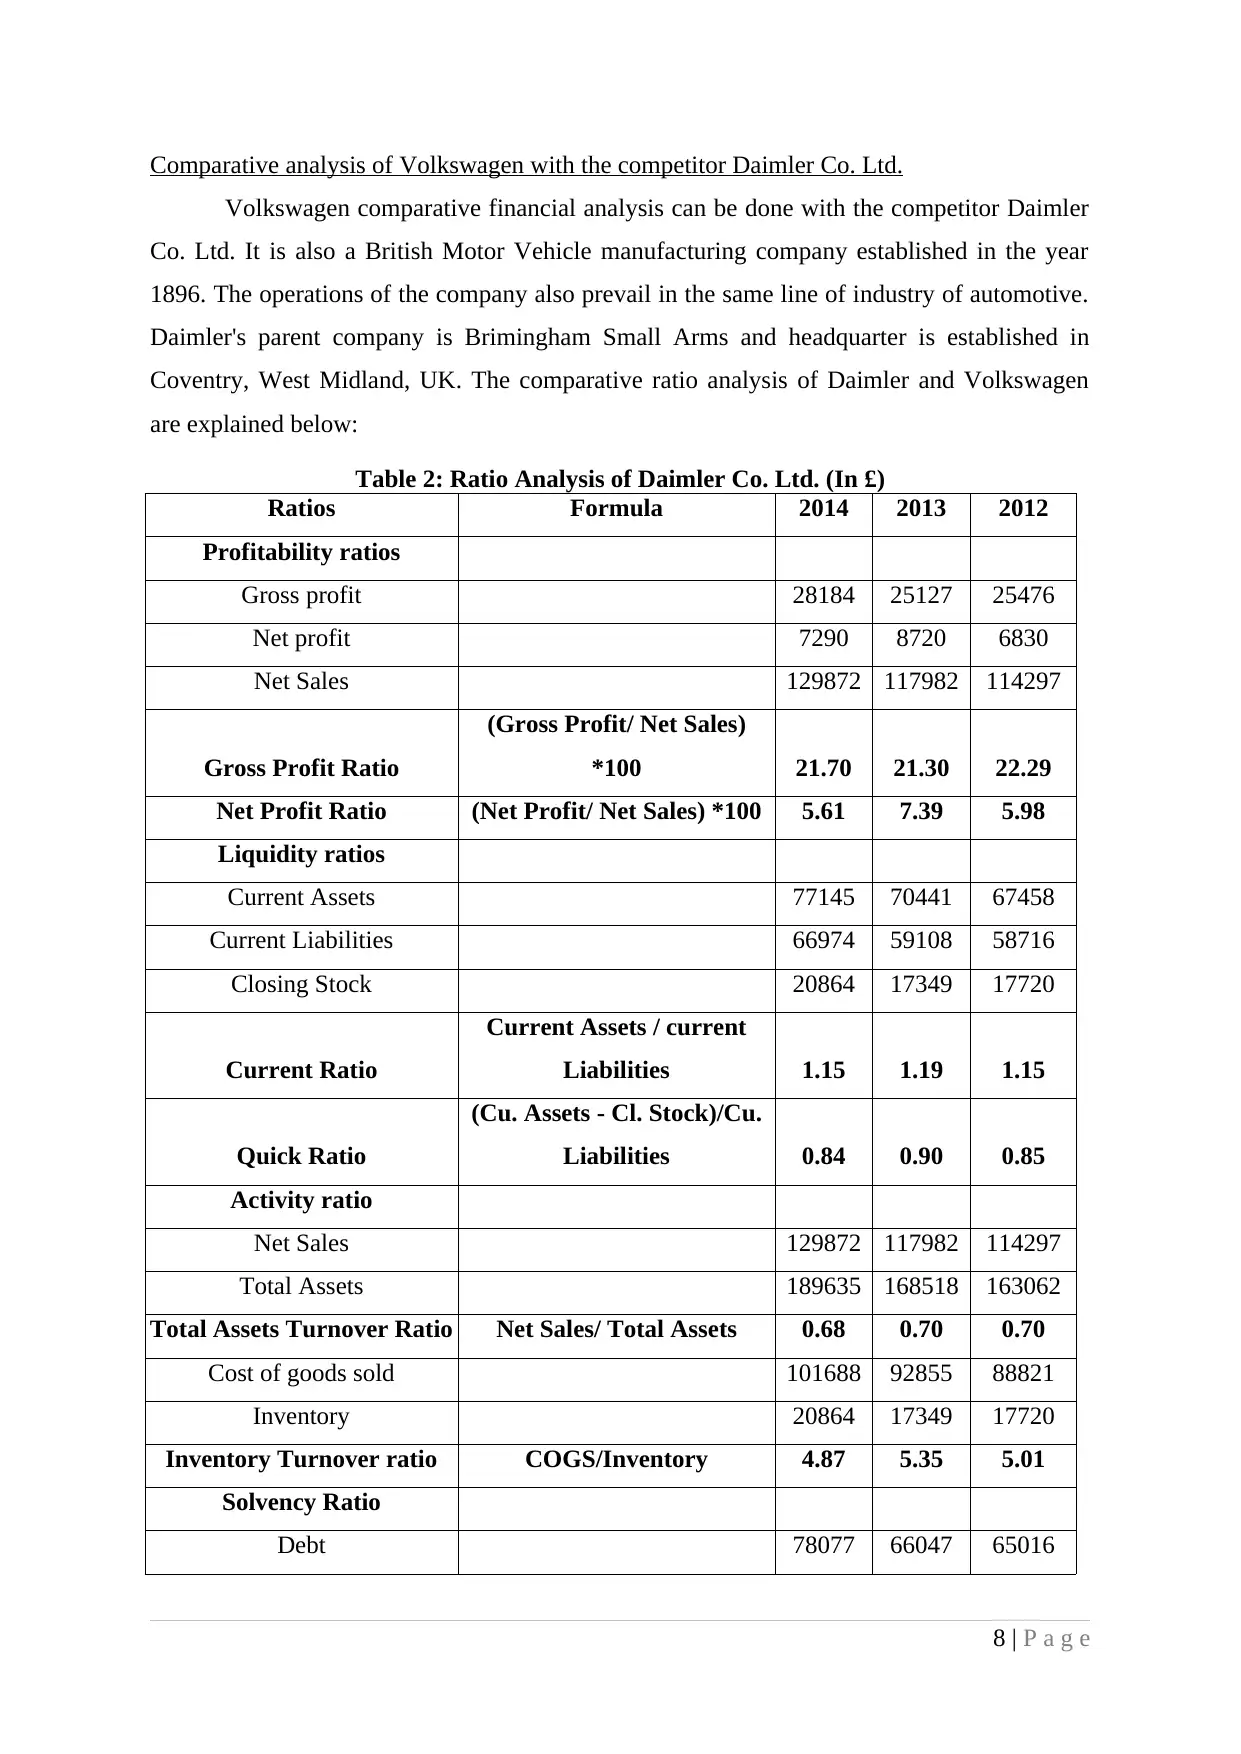
Comparative analysis of Volkswagen with the competitor Daimler Co. Ltd.
Volkswagen comparative financial analysis can be done with the competitor Daimler
Co. Ltd. It is also a British Motor Vehicle manufacturing company established in the year
1896. The operations of the company also prevail in the same line of industry of automotive.
Daimler's parent company is Brimingham Small Arms and headquarter is established in
Coventry, West Midland, UK. The comparative ratio analysis of Daimler and Volkswagen
are explained below:
Table 2: Ratio Analysis of Daimler Co. Ltd. (In £)
Ratios Formula 2014 2013 2012
Profitability ratios
Gross profit 28184 25127 25476
Net profit 7290 8720 6830
Net Sales 129872 117982 114297
Gross Profit Ratio
(Gross Profit/ Net Sales)
*100 21.70 21.30 22.29
Net Profit Ratio (Net Profit/ Net Sales) *100 5.61 7.39 5.98
Liquidity ratios
Current Assets 77145 70441 67458
Current Liabilities 66974 59108 58716
Closing Stock 20864 17349 17720
Current Ratio
Current Assets / current
Liabilities 1.15 1.19 1.15
Quick Ratio
(Cu. Assets - Cl. Stock)/Cu.
Liabilities 0.84 0.90 0.85
Activity ratio
Net Sales 129872 117982 114297
Total Assets 189635 168518 163062
Total Assets Turnover Ratio Net Sales/ Total Assets 0.68 0.70 0.70
Cost of goods sold 101688 92855 88821
Inventory 20864 17349 17720
Inventory Turnover ratio COGS/Inventory 4.87 5.35 5.01
Solvency Ratio
Debt 78077 66047 65016
8 | P a g e
Equity 44584 43363 39330
Debt Equity Ratio Debt/ Equity 1.75 1.52 1.65
Net income 7290 8720 6830
Annual Interest Expense 715 884 937
Times Interest Ratio Net Income/ Interest expense 10.20 9.86 7.29
Valuation ratio
Earning per share
Total earnings available to
equity shareholders/Total
no. of equity shares 6.51 6.4 6.02
Dividend per share
Total dividend declared/No.
of equity share issued 2.45 2.25 2.2
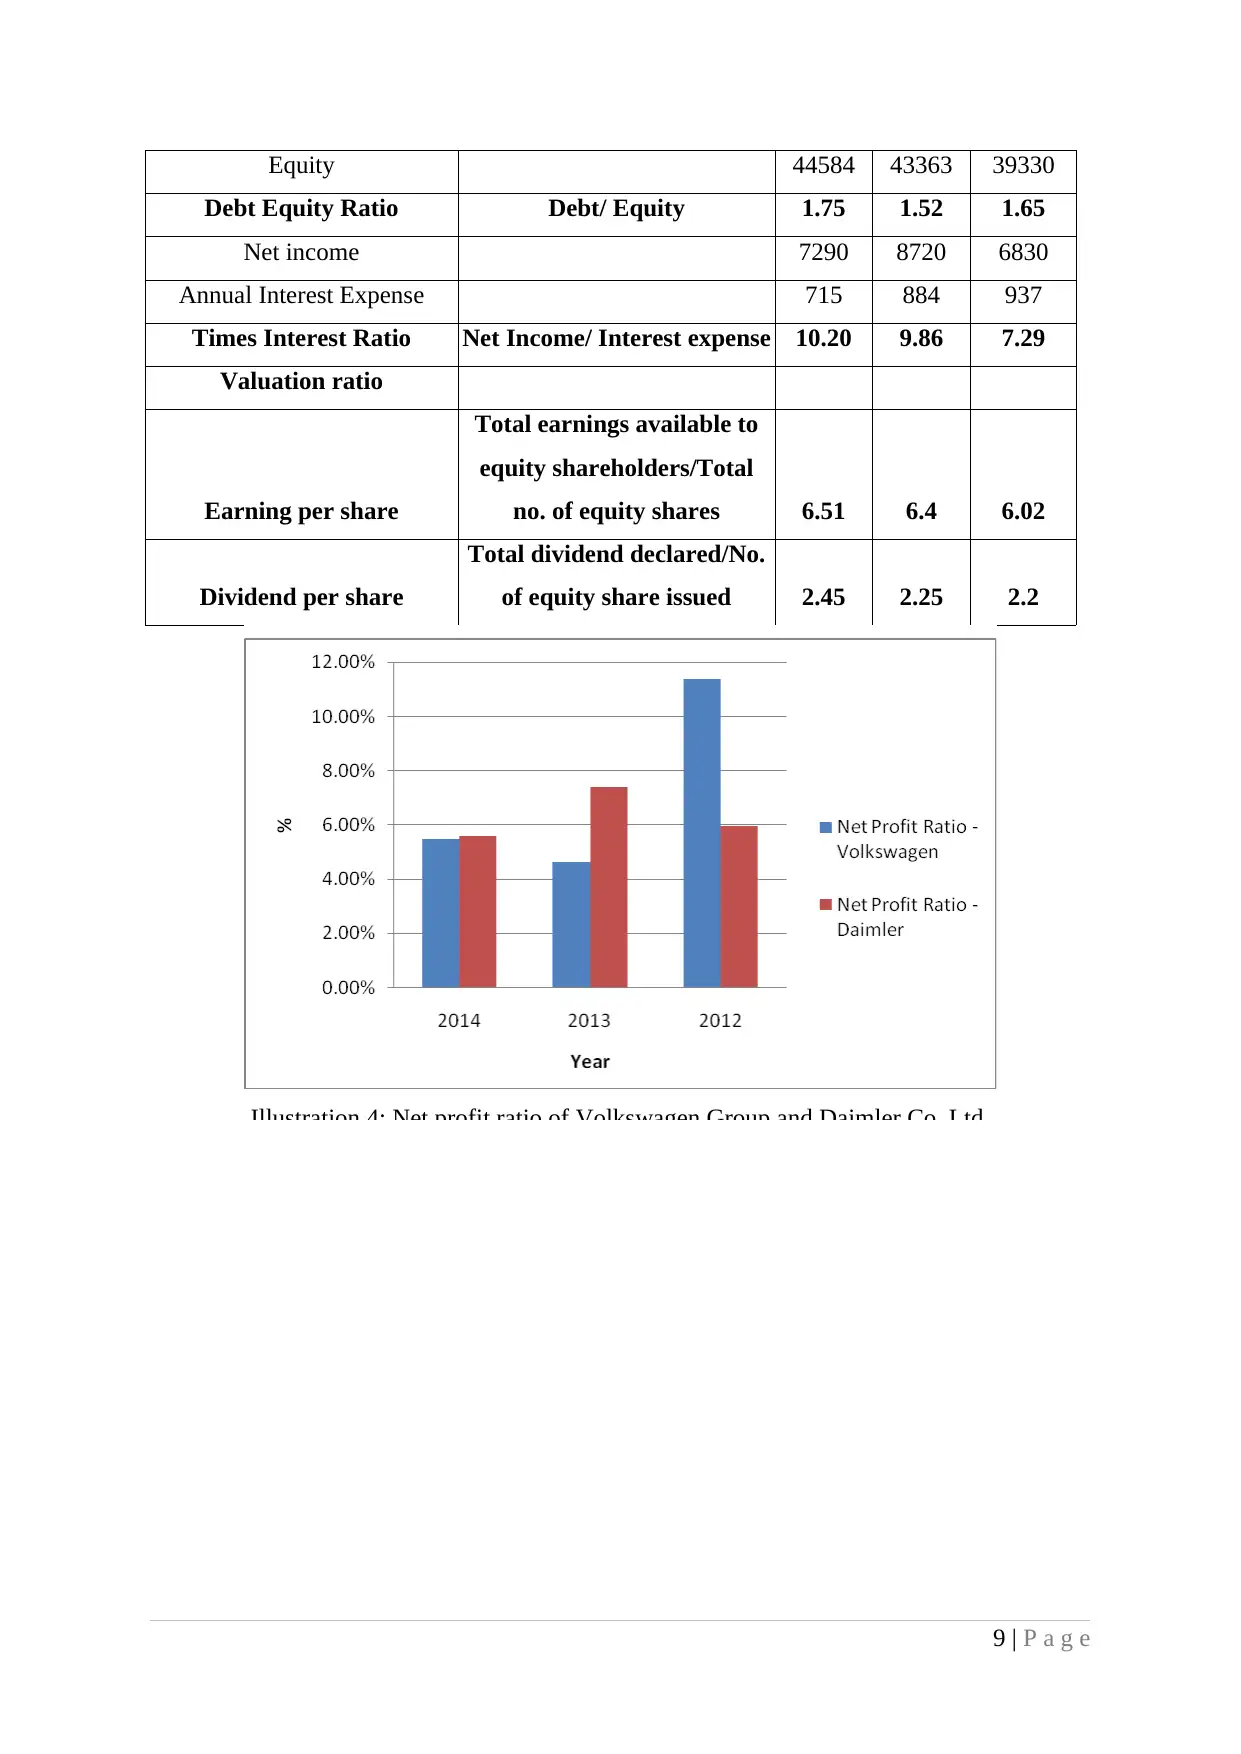
Illustration 4: Net profit ratio of Volkswagen Group and Daimler Co. Ltd.
9 | P a g e
Debt Equity Ratio Debt/ Equity 1.75 1.52 1.65
Net income 7290 8720 6830
Annual Interest Expense 715 884 937
Times Interest Ratio Net Income/ Interest expense 10.20 9.86 7.29
Valuation ratio
Earning per share
Total earnings available to
equity shareholders/Total
no. of equity shares 6.51 6.4 6.02
Dividend per share
Total dividend declared/No.
of equity share issued 2.45 2.25 2.2
Illustration 4: Net profit ratio of Volkswagen Group and Daimler Co. Ltd.
9 | P a g e
⊘ This is a preview!⊘
Do you want full access?
Subscribe today to unlock all pages.
Trusted by 1+ million students worldwide
1 out of 16