Financial Statement Analysis- PDF
Added on 2020-12-29
33 Pages7802 Words356 Views
FAME

TABLE OF CONTENTS
INTRODUCTION...........................................................................................................................1
1. Critically contrasting and comparing financial performance of Tesla and Daimler (2014-
2017)............................................................................................................................................1
Ratio Analysis..............................................................................................................................1
Tesla's Horizontal statement of profit and loss..........................................................................13
Tesla's Horizontal statement of Balance sheet...........................................................................13
Tesla's Vertical statement of profit and loss..............................................................................14
Tesla's Vertical statement of Balance sheet...............................................................................14
Daimler's Horizontal statement of profit and loss.....................................................................14
Daimler's Horizontal statement of Balance sheet......................................................................14
Daimler's Vertical statement of profit and loss..........................................................................15
Daimler's Vertical statement of Balance sheet..........................................................................15
2. Cash position .........................................................................................................................15
CONCLUSION..............................................................................................................................16
REFERENCES..............................................................................................................................17
APPENDIX....................................................................................................................................18
Daimler's Horizontal analysis of statement of profit and loss...................................................18
Daimler's Horizontal analysis of statement of financial position..............................................18
Daimler's Vertical analysis of statement of profit and loss.......................................................20
Daimler's Vertical analysis of statement of financial position..................................................22
Tesla's horizontal analysis of statement of profit and loss.........................................................24
Tesla's horizontal analysis of statement of financial position....................................................25
Tesla's vertical analysis of statement of profit and loss.............................................................27
Tesla's vertical analysis of statement of financial position........................................................28
INTRODUCTION
Financial analysis is referred as assessment about viability, solvent, stable along with
profitability of business. It might be considered as measuring how fund could be invested in
effective aspect. The main application of this analysis is to evaluate various economic trends,
building long term plans for activity of business, setting financial policy and to determine
companies or project for investment. Generally, it is performed by synthesizing financial
numbers along with data. The financial analysis could be done by different methods such as ratio
analysis, horizontal and vertical analysis. The present report will give brief discussion about
Tesla and Daimler along with their comparison during 2014 to 2017. Daimler and Tesla both are
in similar industry as Tesla is American energy organization and Daimler as German
multinational corporation. In the similar aspect, it will articulate financial weakness and strength
by stating strong company with its financial backgrounds. Further, it will reflect cash position of
both organization and perform critical evaluation in same time period with specific findings.
1. Critically contrasting and comparing financial performance of Tesla and Daimler (2014-2017)
Ratio Analysis
Liquidity ratio
Daimler
T
e
s
l
a
Tesla
Particular
s Formula 2014 2015 2016 2017 2014 2015 2016 2017
Current
Ratio
Current Assets /
Current Liability 1.15 1.19 1.21 1.23 1.52 0.99 1.07 0.86
1
Quick
ratio
(Current asset-
Inventory)/Curren
t Liability
0.84 0.88 0.90 0.92 1.02 0.49 0.69 0.53
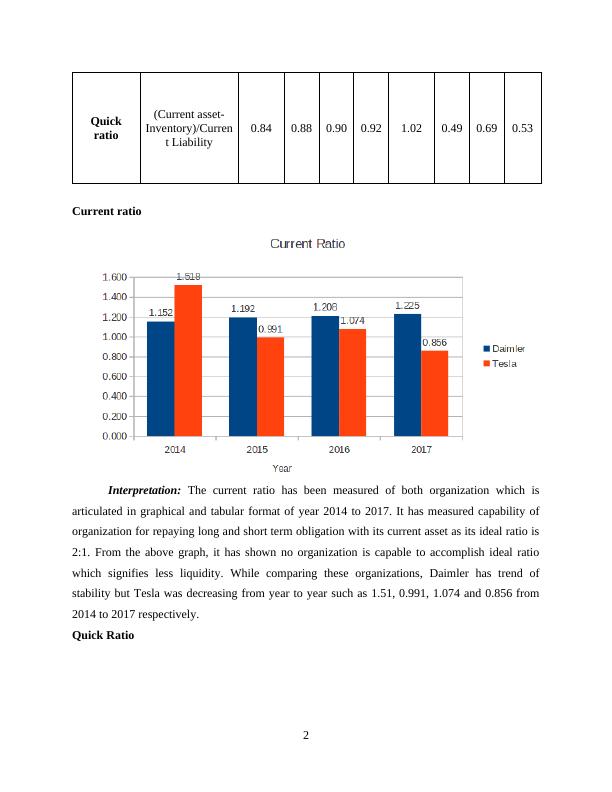
Current ratio
Interpretation: The current ratio has been measured of both organization which is
articulated in graphical and tabular format of year 2014 to 2017. It has measured capability of
organization for repaying long and short term obligation with its current asset as its ideal ratio is
2:1. From the above graph, it has shown no organization is capable to accomplish ideal ratio
which signifies less liquidity. While comparing these organizations, Daimler has trend of
stability but Tesla was decreasing from year to year such as 1.51, 0.991, 1.074 and 0.856 from
2014 to 2017 respectively.
Quick Ratio
2
ratio
(Current asset-
Inventory)/Curren
t Liability
0.84 0.88 0.90 0.92 1.02 0.49 0.69 0.53
Current ratio
Interpretation: The current ratio has been measured of both organization which is
articulated in graphical and tabular format of year 2014 to 2017. It has measured capability of
organization for repaying long and short term obligation with its current asset as its ideal ratio is
2:1. From the above graph, it has shown no organization is capable to accomplish ideal ratio
which signifies less liquidity. While comparing these organizations, Daimler has trend of
stability but Tesla was decreasing from year to year such as 1.51, 0.991, 1.074 and 0.856 from
2014 to 2017 respectively.
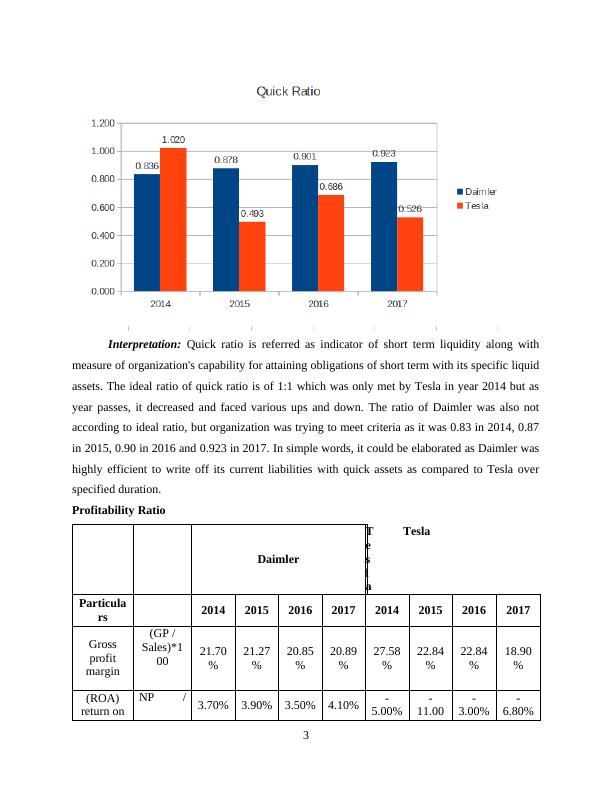
Quick Ratio
2
Interpretation: Quick ratio is referred as indicator of short term liquidity along with
measure of organization's capability for attaining obligations of short term with its specific liquid
assets. The ideal ratio of quick ratio is of 1:1 which was only met by Tesla in year 2014 but as
year passes, it decreased and faced various ups and down. The ratio of Daimler was also not
according to ideal ratio, but organization was trying to meet criteria as it was 0.83 in 2014, 0.87
in 2015, 0.90 in 2016 and 0.923 in 2017. In simple words, it could be elaborated as Daimler was
highly efficient to write off its current liabilities with quick assets as compared to Tesla over
specified duration.
Profitability Ratio
Daimler
T
e
s
l
a
Tesla
Particula
rs 2014 2015 2016 2017 2014 2015 2016 2017
Gross
profit
margin
(GP /
Sales)*1
00 21.70
%
21.27
%
20.85
%
20.89
%
27.58
%
22.84
%
22.84
%
18.90
%
(ROA)
return on
NP / 3.70% 3.90% 3.50% 4.10% -
5.00%
-
11.00
-
3.00%
-
6.80%
3
Assets
Total
Assets %
(ROCE)R
eturn on
capital
employed
Net
operating
profit /
Capital
employe
d)
7.70% 9.00% 7.60% 7.70% -
5.00%
-
13.60
%
-
4.00%
-
7.80%
(ROE)
Return on
Equity
Profit /
Net
worth
15.90
%
15.70
%
14.70
%
16.40
%
-
32.20
%
-
81.60
%
-
14.20
%
-
46.30
%
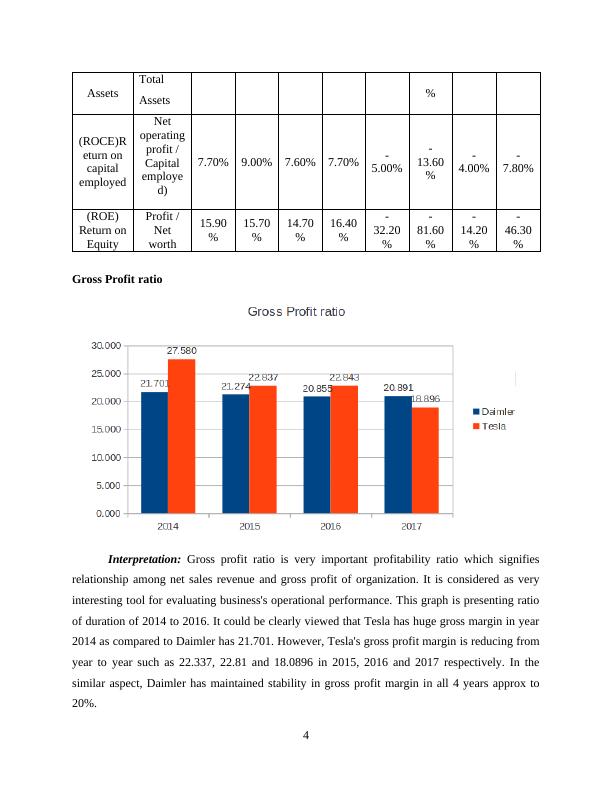
Gross Profit ratio
Interpretation: Gross profit ratio is very important profitability ratio which signifies
relationship among net sales revenue and gross profit of organization. It is considered as very
interesting tool for evaluating business's operational performance. This graph is presenting ratio
of duration of 2014 to 2016. It could be clearly viewed that Tesla has huge gross margin in year
2014 as compared to Daimler has 21.701. However, Tesla's gross profit margin is reducing from
year to year such as 22.337, 22.81 and 18.0896 in 2015, 2016 and 2017 respectively. In the
similar aspect, Daimler has maintained stability in gross profit margin in all 4 years approx to
20%.
4
Total
Assets %
(ROCE)R
eturn on
capital
employed
Net
operating
profit /
Capital
employe
d)
7.70% 9.00% 7.60% 7.70% -
5.00%
-
13.60
%
-
4.00%
-
7.80%
(ROE)
Return on
Equity
Profit /
Net
worth
15.90
%
15.70
%
14.70
%
16.40
%
-
32.20
%
-
81.60
%
-
14.20
%
-
46.30
%
Gross Profit ratio
Interpretation: Gross profit ratio is very important profitability ratio which signifies
relationship among net sales revenue and gross profit of organization. It is considered as very
interesting tool for evaluating business's operational performance. This graph is presenting ratio
of duration of 2014 to 2016. It could be clearly viewed that Tesla has huge gross margin in year
2014 as compared to Daimler has 21.701. However, Tesla's gross profit margin is reducing from
year to year such as 22.337, 22.81 and 18.0896 in 2015, 2016 and 2017 respectively. In the
similar aspect, Daimler has maintained stability in gross profit margin in all 4 years approx to
20%.
4
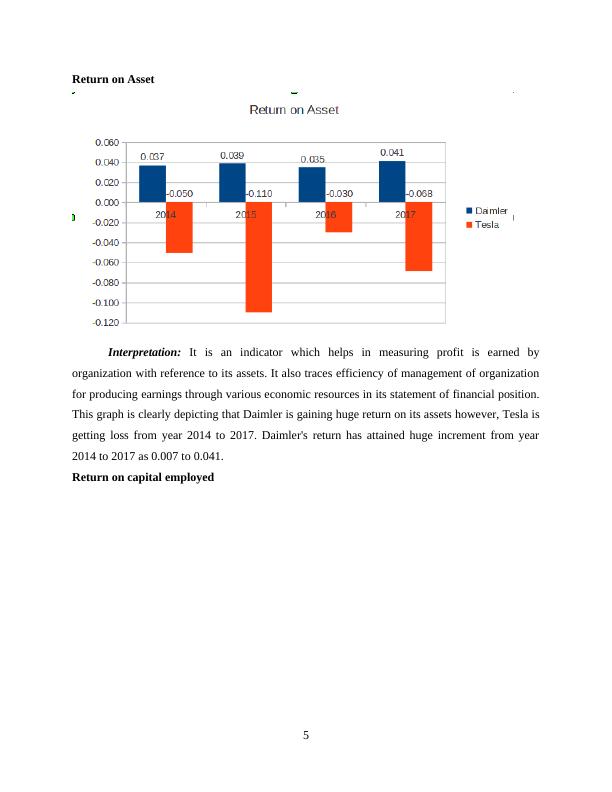
Return on Asset
Interpretation: It is an indicator which helps in measuring profit is earned by
organization with reference to its assets. It also traces efficiency of management of organization
for producing earnings through various economic resources in its statement of financial position.
This graph is clearly depicting that Daimler is gaining huge return on its assets however, Tesla is
getting loss from year 2014 to 2017. Daimler's return has attained huge increment from year
2014 to 2017 as 0.007 to 0.041.
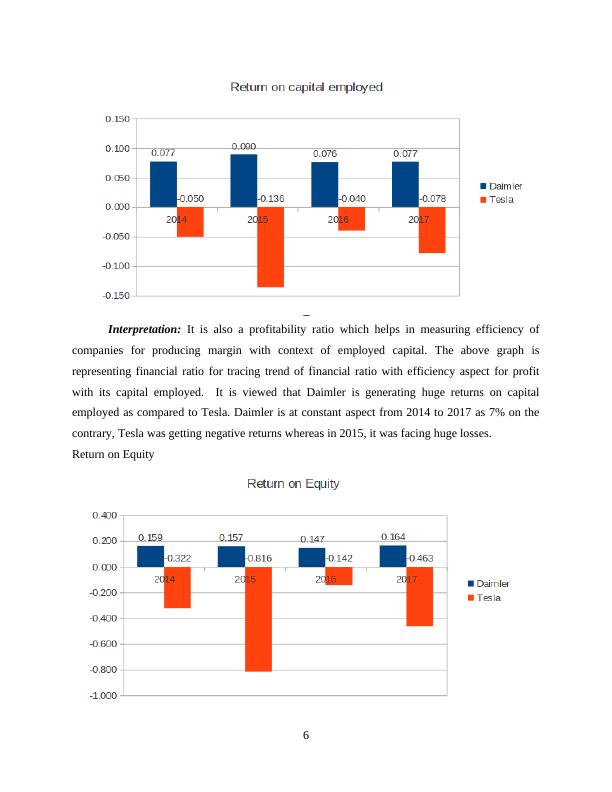
Return on capital employed
5
Interpretation: It is an indicator which helps in measuring profit is earned by
organization with reference to its assets. It also traces efficiency of management of organization
for producing earnings through various economic resources in its statement of financial position.
This graph is clearly depicting that Daimler is gaining huge return on its assets however, Tesla is
getting loss from year 2014 to 2017. Daimler's return has attained huge increment from year
2014 to 2017 as 0.007 to 0.041.
Return on capital employed
5
Interpretation: It is also a profitability ratio which helps in measuring efficiency of
companies for producing margin with context of employed capital. The above graph is
representing financial ratio for tracing trend of financial ratio with efficiency aspect for profit
with its capital employed. It is viewed that Daimler is generating huge returns on capital
employed as compared to Tesla. Daimler is at constant aspect from 2014 to 2017 as 7% on the
contrary, Tesla was getting negative returns whereas in 2015, it was facing huge losses.
Return on Equity
6
End of preview
Want to access all the pages? Upload your documents or become a member.
Related Documents
FINANCIAL ANALYSIS MANAGEMENT & ENTERPRISE - FAME TABLE OF CONTENTS INTRODUCTION 1 Daimler's Horizontal Analysis of Statement of Financial Positionlg...
|27
|9136
|179
Financial Analysis Management & Enterprise - Doclg...
|33
|9497
|470
FINANCIAL ANALYSIS MANAGEMENT & ENTERPRISE - FAME INTRODUCTIONlg...
|31
|7792
|433
Financial Analysis of Tesla and Daimlerlg...
|20
|5276
|23
Financial analysis and management enterprise (Doc)lg...
|22
|5808
|21
Financial Analysis of Samsung and Applelg...
|22
|4606
|499