logo

Financial Statistics

10 Pages1354 Words65 Views
   

Added on  2022-12-29

About This Document

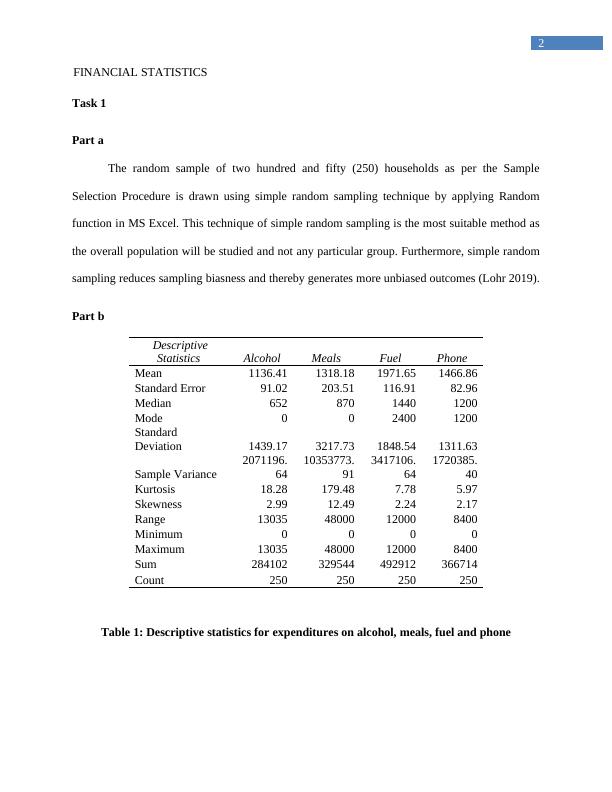
This document provides detailed financial statistics and analysis for households. It covers topics such as expenditures, income, education levels, and more. The data is presented in tables, graphs, and descriptive statistics. The document also includes solutions for assignments and essays related to financial statistics.

Financial Statistics

   Added on 2022-12-29

ShareRelated Documents
Running head: FINANCIAL STATISTICS
Financial Statistics
Name of the Student:
Name of the University:
Author note:
Financial Statistics_1
1
FINANCIAL STATISTICS
Table of Contents
Task 1...............................................................................................................................................2
Part a............................................................................................................................................2
Part b............................................................................................................................................2
Part c............................................................................................................................................3
Task 2...............................................................................................................................................4
Part a............................................................................................................................................4
Part b............................................................................................................................................4
Part c............................................................................................................................................5
Task 3...............................................................................................................................................6
Part a............................................................................................................................................6
Part b............................................................................................................................................6
Part c............................................................................................................................................7
Part d............................................................................................................................................7
Part e............................................................................................................................................7
References........................................................................................................................................9
Financial Statistics_2
2
FINANCIAL STATISTICS
Task 1
Part a
The random sample of two hundred and fifty (250) households as per the Sample
Selection Procedure is drawn using simple random sampling technique by applying Random
function in MS Excel. This technique of simple random sampling is the most suitable method as
the overall population will be studied and not any particular group. Furthermore, simple random
sampling reduces sampling biasness and thereby generates more unbiased outcomes (Lohr 2019).
Part b
Descriptive
Statistics Alcohol Meals Fuel Phone
Mean 1136.41 1318.18 1971.65 1466.86
Standard Error 91.02 203.51 116.91 82.96
Median 652 870 1440 1200
Mode 0 0 2400 1200
Standard
Deviation 1439.17 3217.73 1848.54 1311.63
Sample Variance
2071196.
64
10353773.
91
3417106.
64
1720385.
40
Kurtosis 18.28 179.48 7.78 5.97
Skewness 2.99 12.49 2.24 2.17
Range 13035 48000 12000 8400
Minimum 0 0 0 0
Maximum 13035 48000 12000 8400
Sum 284102 329544 492912 366714
Count 250 250 250 250
Table 1: Descriptive statistics for expenditures on alcohol, meals, fuel and phone
Financial Statistics_3

End of preview

Want to access all the pages? Upload your documents or become a member.

Related Documents
Statistics for Business - Descriptive Statistics, Frequency Distribution, Probability Distribution, Contingency Table and Scatter Plot
|9
|1339
|404

Microsoft Excel Data Analysis
|7
|1051
|16

Statistics Assignment: Sampling, Descriptive Statistics, Probability and Contingency Table
|11
|2091
|354

BUS5SBF - Statistics for Business & Finance Assignment
|13
|1601
|43

Statistics for Business and Finance - Desklib
|10
|1347
|476

Desklib: Online Library for Study Material with Solved Assignments
|8
|1583
|204