Financial Management ACCT 702: Capital Budgeting & Lease Analysis
VerifiedAdded on 2023/06/12
|12
|2724
|132
Project
AI Summary
This project provides a comprehensive financial analysis of a machine purchase decision for two cupcake companies, Fluffy Cupcake Company (FCC) and Brownie Cake Company (BCC), under different financial scenarios. It begins by calculating the Free Cash Flow for the Firm (FCFF) and Net Present Value (NPV) to assess the financial viability of the purchase for both companies, considering scenarios with 100% equity and a mix of equity and debt. A sensitivity analysis is then performed to evaluate the impact of changes in key variables on the NPV. Finally, the project compares the purchase option with a lease alternative, determining the most financially beneficial option for both companies based on present value calculations. The analysis incorporates factors such as incremental cash revenues, operating expenses, depreciation, tax implications, and cost of capital to provide a thorough evaluation of the investment decision. Desklib offers this and many more solved assignments for students.
FINACIAL MANAGEMENT COURSE – ACCT 702_001 W 18
Name of the student
Name of the University
Name of the student
Name of the University
Paraphrase This Document
Need a fresh take? Get an instant paraphrase of this document with our AI Paraphraser

Author Note
Table of Contents
Part A: Financial Viability for Fluffy Cupcake Company (FCC)......................................................................................................................................................................4
Part B: Financial Viability for Brownie Cake Company (BCC)........................................................................................................................................................................ 5
Part C: Sensitivity Analysis........................................................................................................................................................................................................................... 6
Part D: Purchase vs Lease Analysis............................................................................................................................................................................................................... 9
Bibliography............................................................................................................................................................................................................................................... 11
⊘ This is a preview!⊘
Do you want full access?
Subscribe today to unlock all pages.
Trusted by 1+ million students worldwide
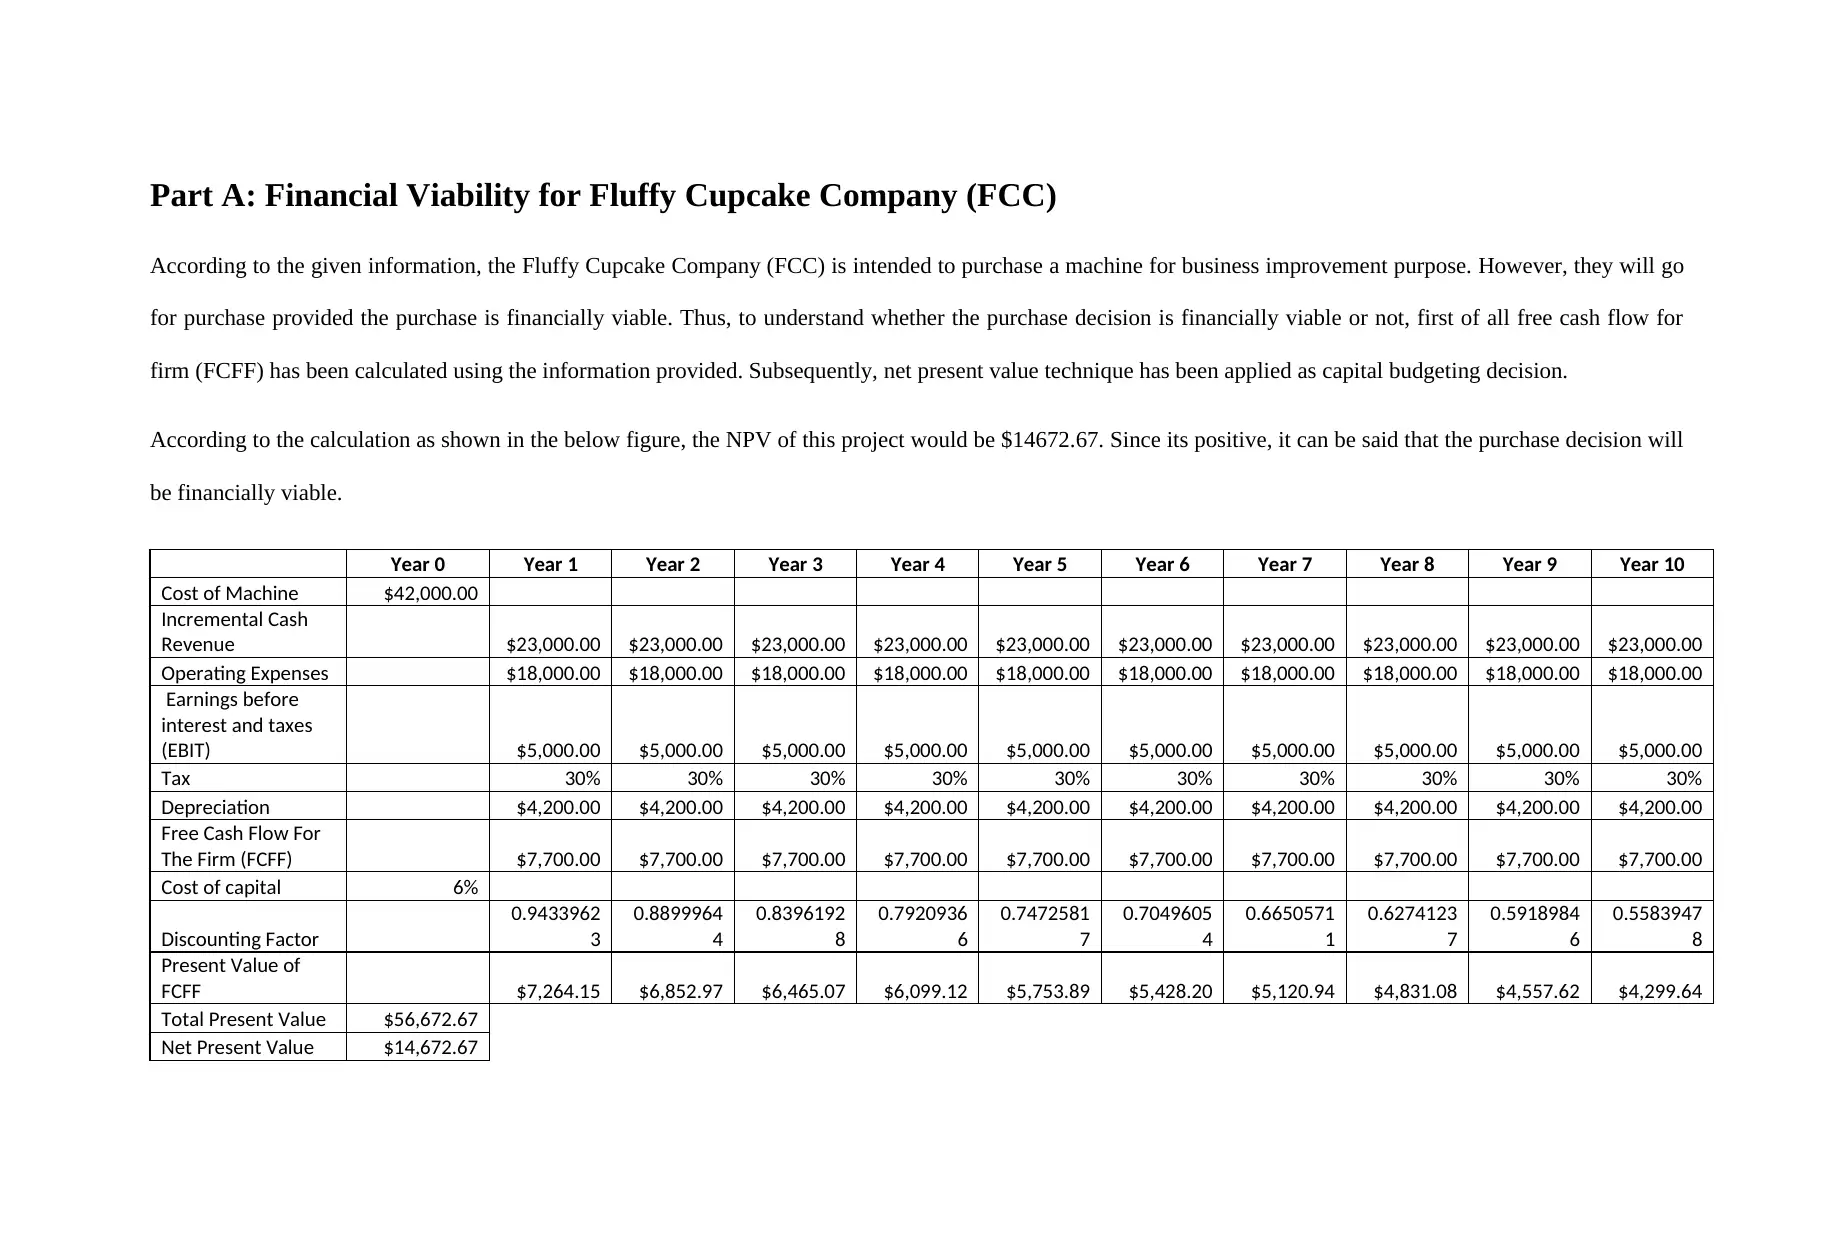
Part A: Financial Viability for Fluffy Cupcake Company (FCC)
According to the given information, the Fluffy Cupcake Company (FCC) is intended to purchase a machine for business improvement purpose. However, they will go
for purchase provided the purchase is financially viable. Thus, to understand whether the purchase decision is financially viable or not, first of all free cash flow for
firm (FCFF) has been calculated using the information provided. Subsequently, net present value technique has been applied as capital budgeting decision.
According to the calculation as shown in the below figure, the NPV of this project would be $14672.67. Since its positive, it can be said that the purchase decision will
be financially viable.
Year 0 Year 1 Year 2 Year 3 Year 4 Year 5 Year 6 Year 7 Year 8 Year 9 Year 10
Cost of Machine $42,000.00
Incremental Cash
Revenue $23,000.00 $23,000.00 $23,000.00 $23,000.00 $23,000.00 $23,000.00 $23,000.00 $23,000.00 $23,000.00 $23,000.00
Operating Expenses $18,000.00 $18,000.00 $18,000.00 $18,000.00 $18,000.00 $18,000.00 $18,000.00 $18,000.00 $18,000.00 $18,000.00
Earnings before
interest and taxes
(EBIT) $5,000.00 $5,000.00 $5,000.00 $5,000.00 $5,000.00 $5,000.00 $5,000.00 $5,000.00 $5,000.00 $5,000.00
Tax 30% 30% 30% 30% 30% 30% 30% 30% 30% 30%
Depreciation $4,200.00 $4,200.00 $4,200.00 $4,200.00 $4,200.00 $4,200.00 $4,200.00 $4,200.00 $4,200.00 $4,200.00
Free Cash Flow For
The Firm (FCFF) $7,700.00 $7,700.00 $7,700.00 $7,700.00 $7,700.00 $7,700.00 $7,700.00 $7,700.00 $7,700.00 $7,700.00
Cost of capital 6%
Discounting Factor
0.9433962
3
0.8899964
4
0.8396192
8
0.7920936
6
0.7472581
7
0.7049605
4
0.6650571
1
0.6274123
7
0.5918984
6
0.5583947
8
Present Value of
FCFF $7,264.15 $6,852.97 $6,465.07 $6,099.12 $5,753.89 $5,428.20 $5,120.94 $4,831.08 $4,557.62 $4,299.64
Total Present Value $56,672.67
Net Present Value $14,672.67
Paraphrase This Document
Need a fresh take? Get an instant paraphrase of this document with our AI Paraphraser
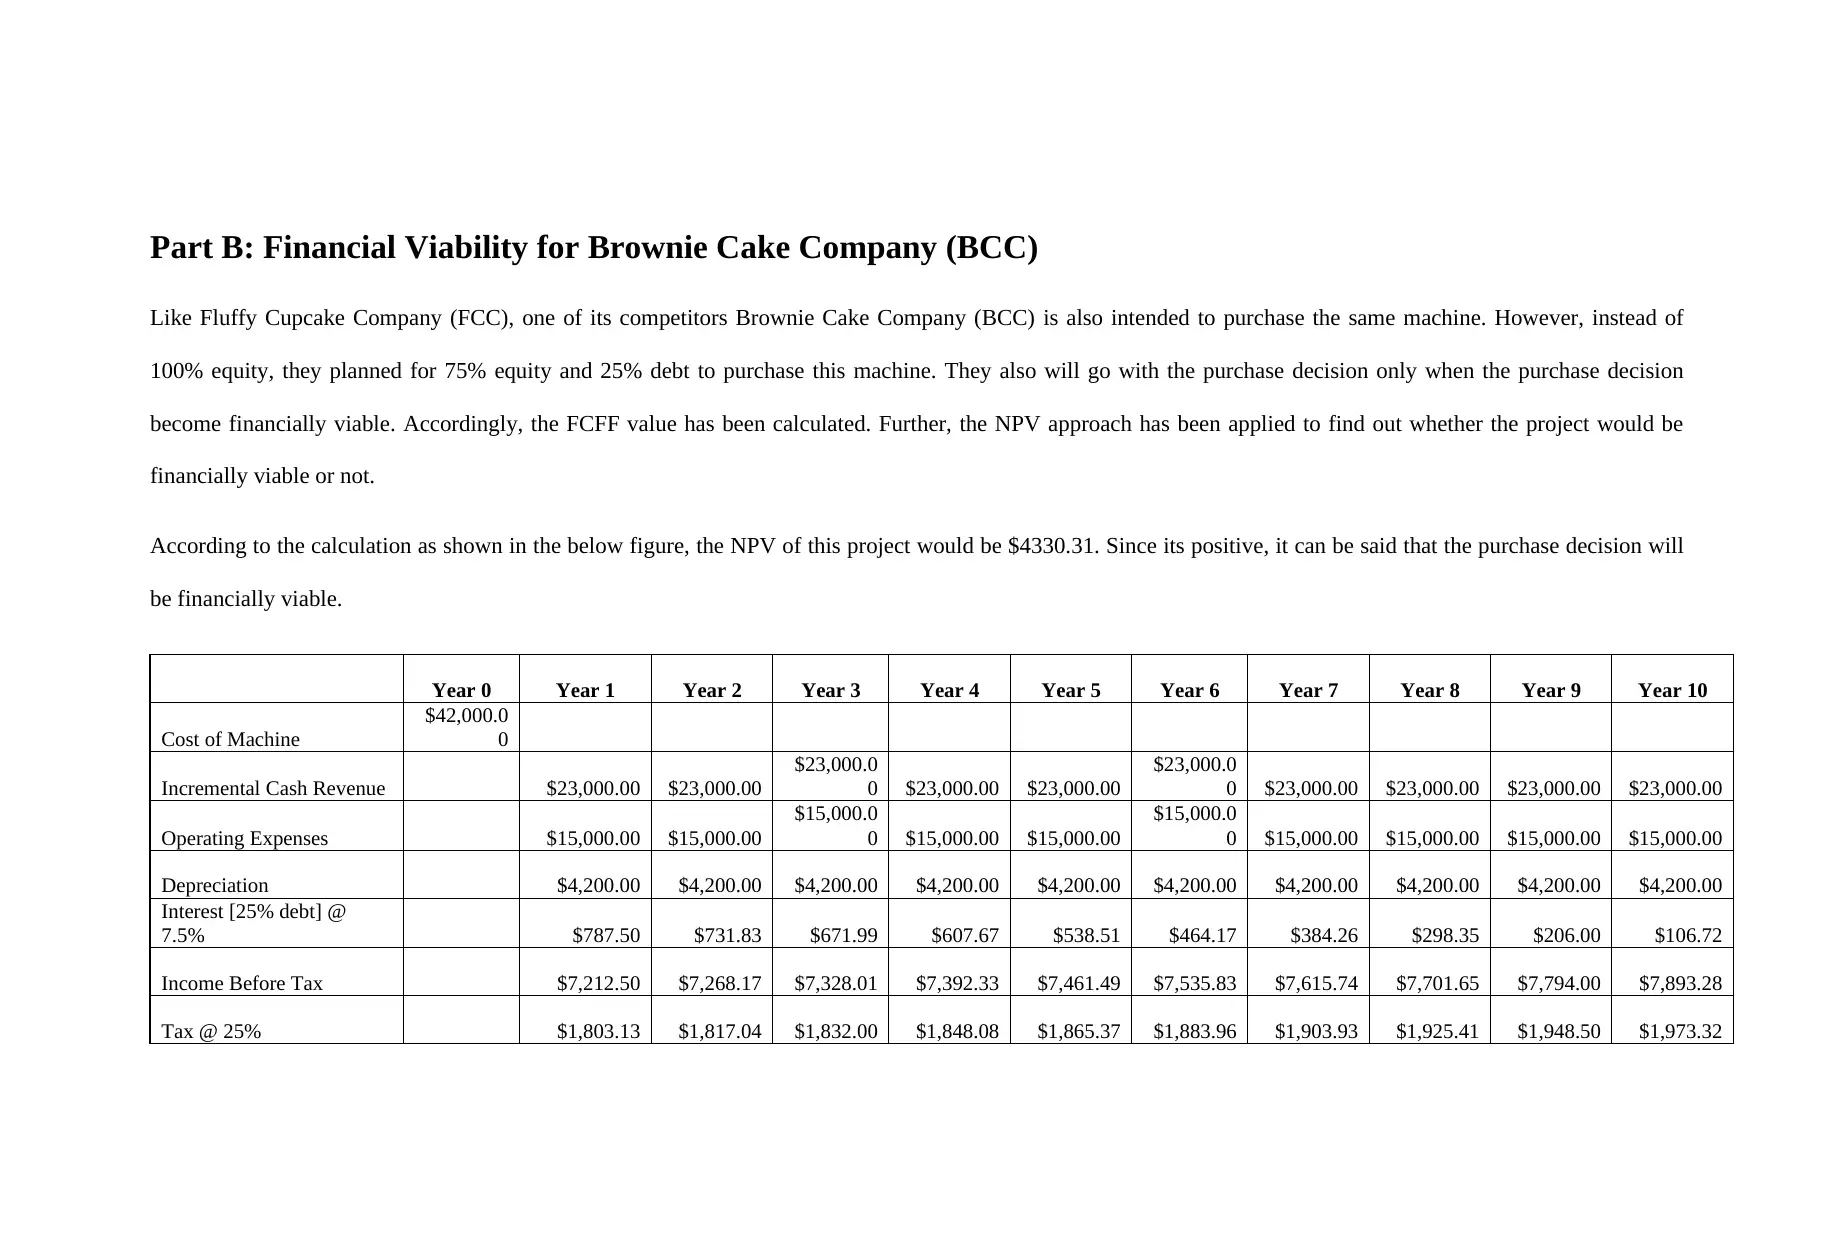
Part B: Financial Viability for Brownie Cake Company (BCC)
Like Fluffy Cupcake Company (FCC), one of its competitors Brownie Cake Company (BCC) is also intended to purchase the same machine. However, instead of
100% equity, they planned for 75% equity and 25% debt to purchase this machine. They also will go with the purchase decision only when the purchase decision
become financially viable. Accordingly, the FCFF value has been calculated. Further, the NPV approach has been applied to find out whether the project would be
financially viable or not.
According to the calculation as shown in the below figure, the NPV of this project would be $4330.31. Since its positive, it can be said that the purchase decision will
be financially viable.
Year 0 Year 1 Year 2 Year 3 Year 4 Year 5 Year 6 Year 7 Year 8 Year 9 Year 10
Cost of Machine
$42,000.0
0
Incremental Cash Revenue $23,000.00 $23,000.00
$23,000.0
0 $23,000.00 $23,000.00
$23,000.0
0 $23,000.00 $23,000.00 $23,000.00 $23,000.00
Operating Expenses $15,000.00 $15,000.00
$15,000.0
0 $15,000.00 $15,000.00
$15,000.0
0 $15,000.00 $15,000.00 $15,000.00 $15,000.00
Depreciation $4,200.00 $4,200.00 $4,200.00 $4,200.00 $4,200.00 $4,200.00 $4,200.00 $4,200.00 $4,200.00 $4,200.00
Interest [25% debt] @
7.5% $787.50 $731.83 $671.99 $607.67 $538.51 $464.17 $384.26 $298.35 $206.00 $106.72
Income Before Tax $7,212.50 $7,268.17 $7,328.01 $7,392.33 $7,461.49 $7,535.83 $7,615.74 $7,701.65 $7,794.00 $7,893.28
Tax @ 25% $1,803.13 $1,817.04 $1,832.00 $1,848.08 $1,865.37 $1,883.96 $1,903.93 $1,925.41 $1,948.50 $1,973.32
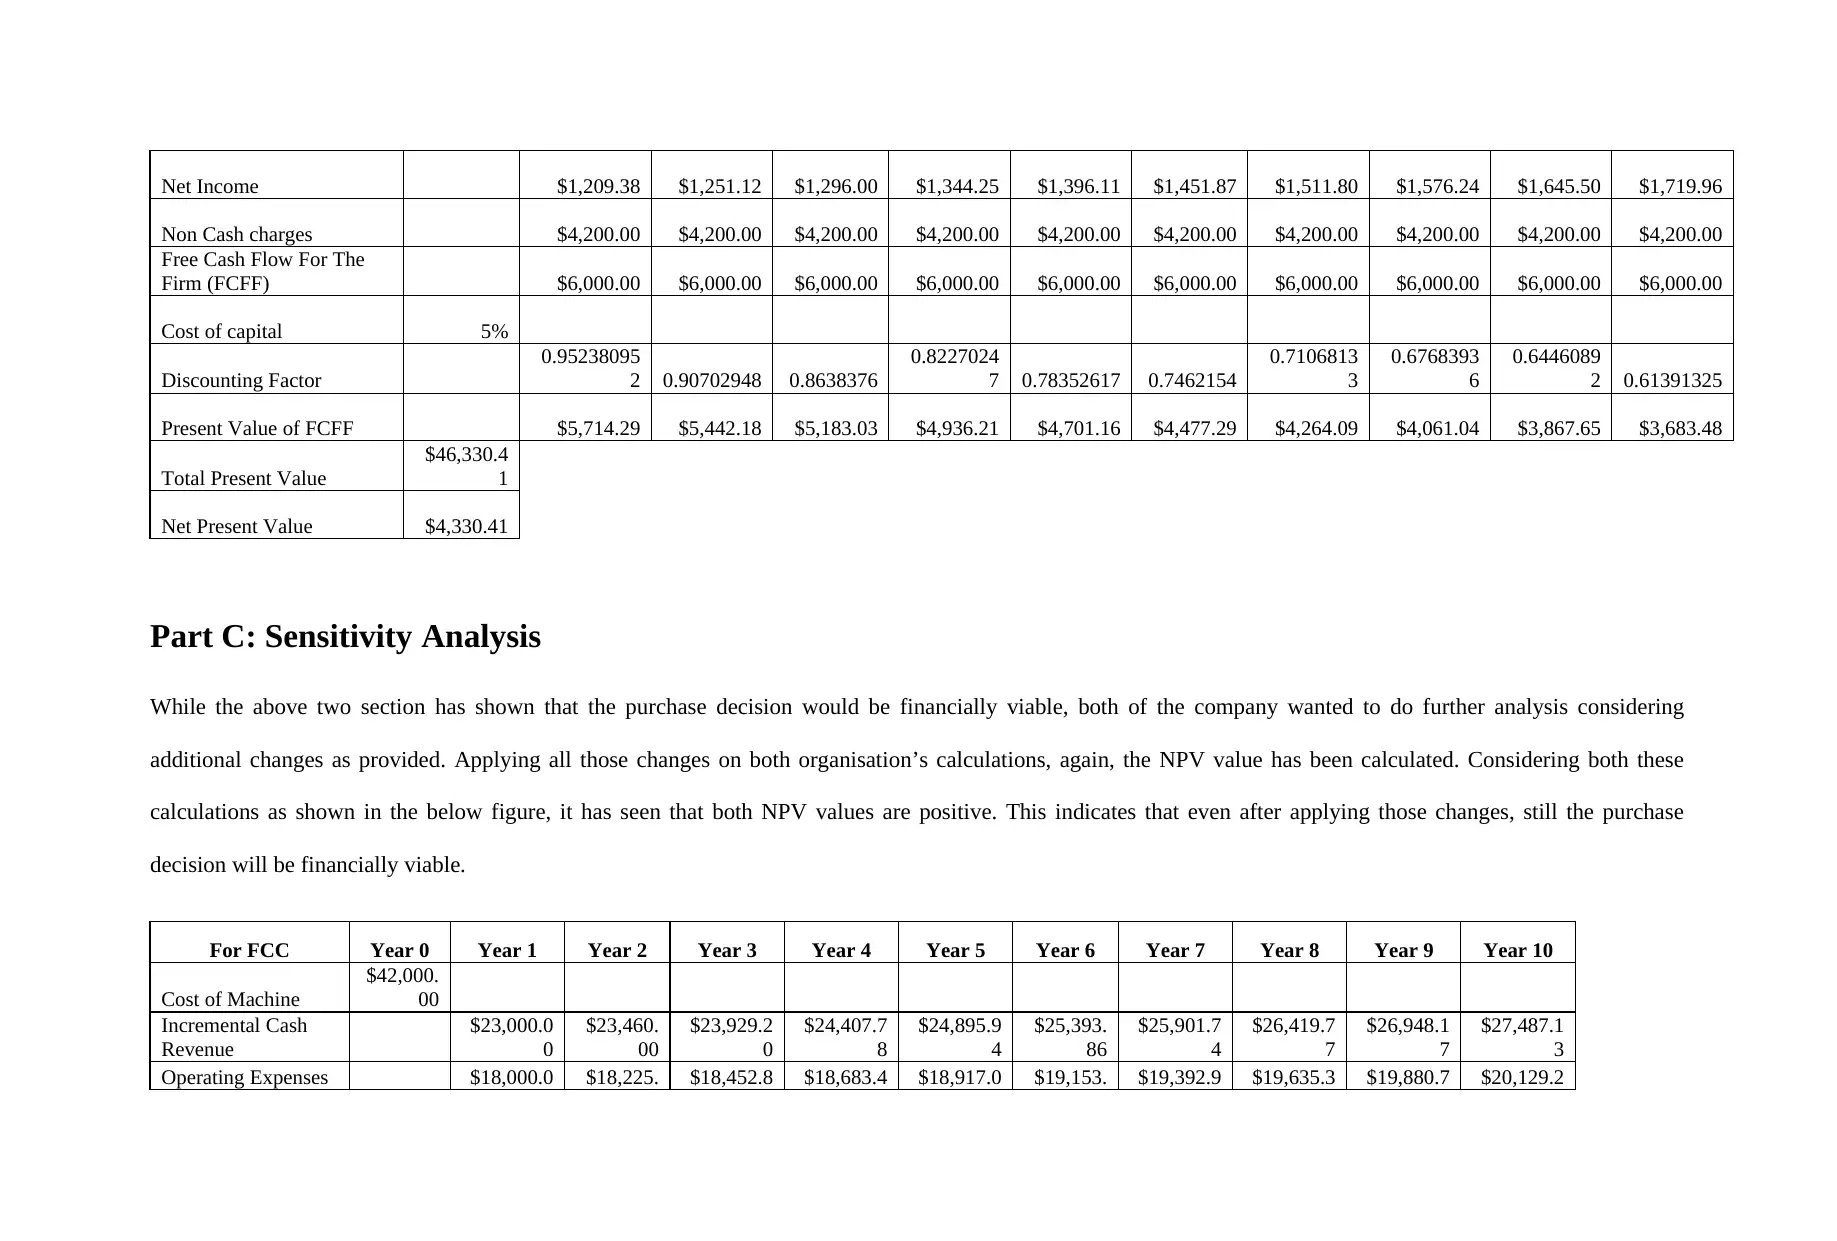
Net Income $1,209.38 $1,251.12 $1,296.00 $1,344.25 $1,396.11 $1,451.87 $1,511.80 $1,576.24 $1,645.50 $1,719.96
Non Cash charges $4,200.00 $4,200.00 $4,200.00 $4,200.00 $4,200.00 $4,200.00 $4,200.00 $4,200.00 $4,200.00 $4,200.00
Free Cash Flow For The
Firm (FCFF) $6,000.00 $6,000.00 $6,000.00 $6,000.00 $6,000.00 $6,000.00 $6,000.00 $6,000.00 $6,000.00 $6,000.00
Cost of capital 5%
Discounting Factor
0.95238095
2 0.90702948 0.8638376
0.8227024
7 0.78352617 0.7462154
0.7106813
3
0.6768393
6
0.6446089
2 0.61391325
Present Value of FCFF $5,714.29 $5,442.18 $5,183.03 $4,936.21 $4,701.16 $4,477.29 $4,264.09 $4,061.04 $3,867.65 $3,683.48
Total Present Value
$46,330.4
1
Net Present Value $4,330.41
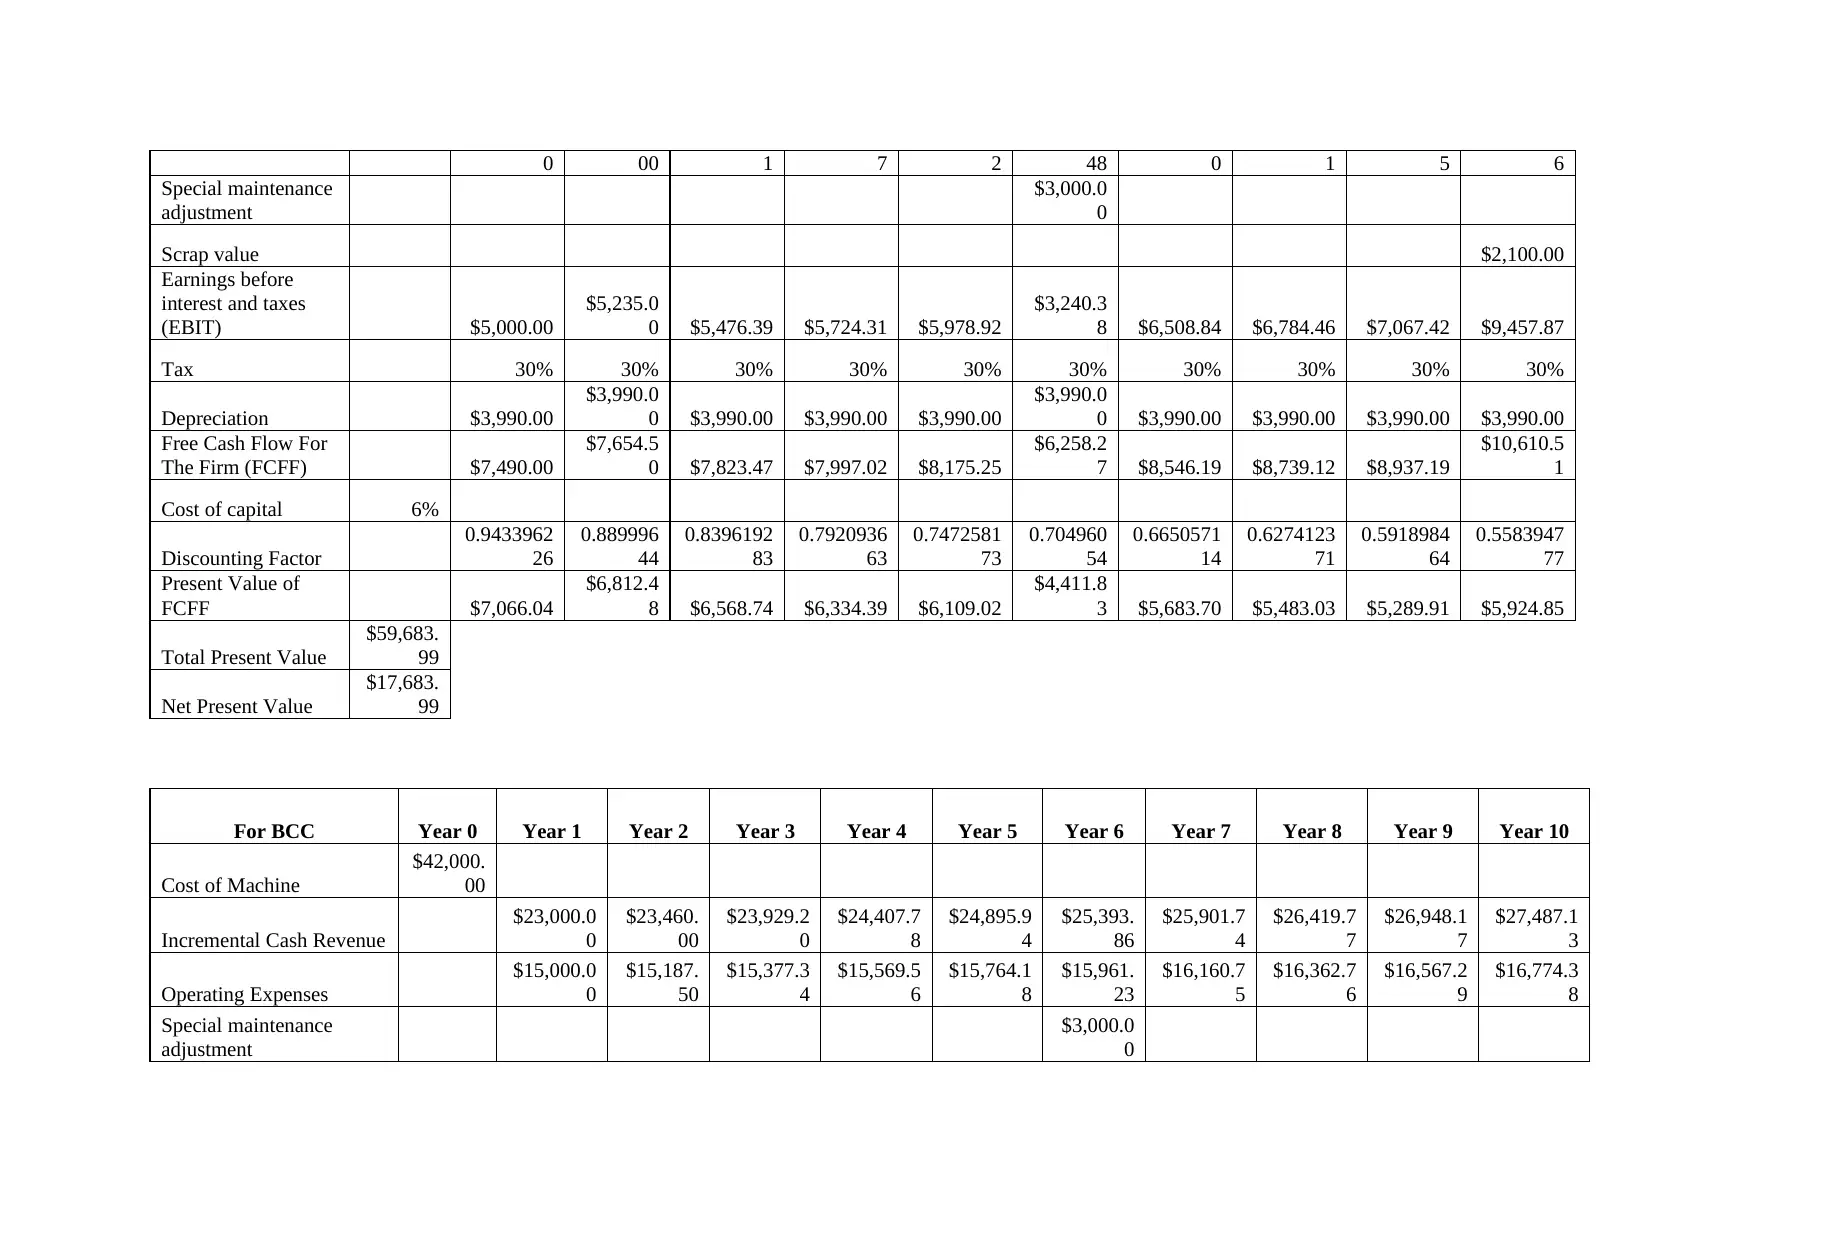
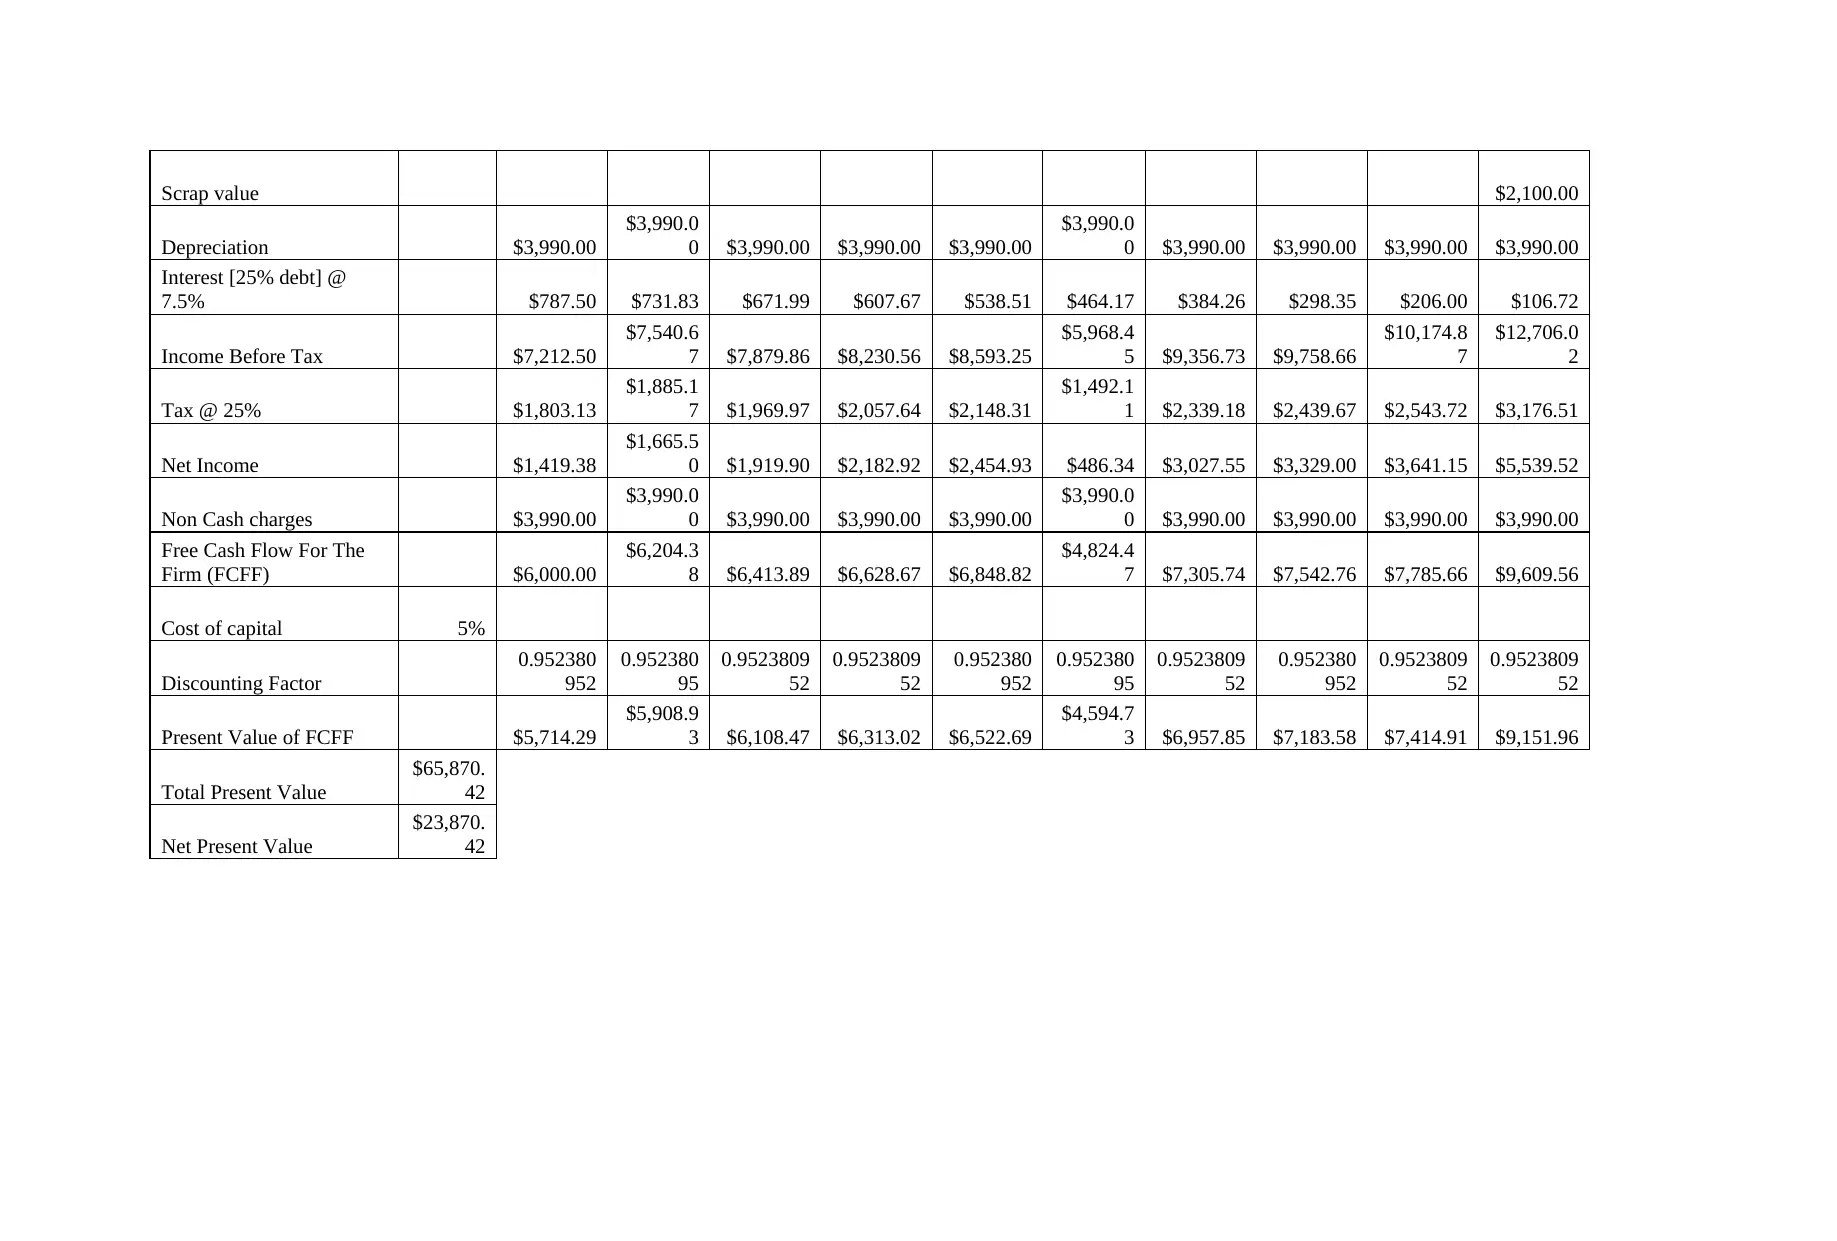
Part C: Sensitivity Analysis
While the above two section has shown that the purchase decision would be financially viable, both of the company wanted to do further analysis considering
additional changes as provided. Applying all those changes on both organisation’s calculations, again, the NPV value has been calculated. Considering both these
calculations as shown in the below figure, it has seen that both NPV values are positive. This indicates that even after applying those changes, still the purchase
decision will be financially viable.
For FCC Year 0 Year 1 Year 2 Year 3 Year 4 Year 5 Year 6 Year 7 Year 8 Year 9 Year 10
Cost of Machine
$42,000.
00
Incremental Cash
Revenue
$23,000.0
0
$23,460.
00
$23,929.2
0
$24,407.7
8
$24,895.9
4
$25,393.
86
$25,901.7
4
$26,419.7
7
$26,948.1
7
$27,487.1
3
Operating Expenses $18,000.0 $18,225. $18,452.8 $18,683.4 $18,917.0 $19,153. $19,392.9 $19,635.3 $19,880.7 $20,129.2
Non Cash charges $4,200.00 $4,200.00 $4,200.00 $4,200.00 $4,200.00 $4,200.00 $4,200.00 $4,200.00 $4,200.00 $4,200.00
Free Cash Flow For The
Firm (FCFF) $6,000.00 $6,000.00 $6,000.00 $6,000.00 $6,000.00 $6,000.00 $6,000.00 $6,000.00 $6,000.00 $6,000.00
Cost of capital 5%
Discounting Factor
0.95238095
2 0.90702948 0.8638376
0.8227024
7 0.78352617 0.7462154
0.7106813
3
0.6768393
6
0.6446089
2 0.61391325
Present Value of FCFF $5,714.29 $5,442.18 $5,183.03 $4,936.21 $4,701.16 $4,477.29 $4,264.09 $4,061.04 $3,867.65 $3,683.48
Total Present Value
$46,330.4
1
Net Present Value $4,330.41
Part C: Sensitivity Analysis
While the above two section has shown that the purchase decision would be financially viable, both of the company wanted to do further analysis considering
additional changes as provided. Applying all those changes on both organisation’s calculations, again, the NPV value has been calculated. Considering both these
calculations as shown in the below figure, it has seen that both NPV values are positive. This indicates that even after applying those changes, still the purchase
decision will be financially viable.
For FCC Year 0 Year 1 Year 2 Year 3 Year 4 Year 5 Year 6 Year 7 Year 8 Year 9 Year 10
Cost of Machine
$42,000.
00
Incremental Cash
Revenue
$23,000.0
0
$23,460.
00
$23,929.2
0
$24,407.7
8
$24,895.9
4
$25,393.
86
$25,901.7
4
$26,419.7
7
$26,948.1
7
$27,487.1
3
Operating Expenses $18,000.0 $18,225. $18,452.8 $18,683.4 $18,917.0 $19,153. $19,392.9 $19,635.3 $19,880.7 $20,129.2
⊘ This is a preview!⊘
Do you want full access?
Subscribe today to unlock all pages.
Trusted by 1+ million students worldwide
0 00 1 7 2 48 0 1 5 6
Special maintenance
adjustment
$3,000.0
0
Scrap value $2,100.00
Earnings before
interest and taxes
(EBIT) $5,000.00
$5,235.0
0 $5,476.39 $5,724.31 $5,978.92
$3,240.3
8 $6,508.84 $6,784.46 $7,067.42 $9,457.87
Tax 30% 30% 30% 30% 30% 30% 30% 30% 30% 30%
Depreciation $3,990.00
$3,990.0
0 $3,990.00 $3,990.00 $3,990.00
$3,990.0
0 $3,990.00 $3,990.00 $3,990.00 $3,990.00
Free Cash Flow For
The Firm (FCFF) $7,490.00
$7,654.5
0 $7,823.47 $7,997.02 $8,175.25
$6,258.2
7 $8,546.19 $8,739.12 $8,937.19
$10,610.5
1
Cost of capital 6%
Discounting Factor
0.9433962
26
0.889996
44
0.8396192
83
0.7920936
63
0.7472581
73
0.704960
54
0.6650571
14
0.6274123
71
0.5918984
64
0.5583947
77
Present Value of
FCFF $7,066.04
$6,812.4
8 $6,568.74 $6,334.39 $6,109.02
$4,411.8
3 $5,683.70 $5,483.03 $5,289.91 $5,924.85
Total Present Value
$59,683.
99
Net Present Value
$17,683.
99
For BCC Year 0 Year 1 Year 2 Year 3 Year 4 Year 5 Year 6 Year 7 Year 8 Year 9 Year 10
Cost of Machine
$42,000.
00
Incremental Cash Revenue
$23,000.0
0
$23,460.
00
$23,929.2
0
$24,407.7
8
$24,895.9
4
$25,393.
86
$25,901.7
4
$26,419.7
7
$26,948.1
7
$27,487.1
3
Operating Expenses
$15,000.0
0
$15,187.
50
$15,377.3
4
$15,569.5
6
$15,764.1
8
$15,961.
23
$16,160.7
5
$16,362.7
6
$16,567.2
9
$16,774.3
8
Special maintenance
adjustment
$3,000.0
0
Special maintenance
adjustment
$3,000.0
0
Scrap value $2,100.00
Earnings before
interest and taxes
(EBIT) $5,000.00
$5,235.0
0 $5,476.39 $5,724.31 $5,978.92
$3,240.3
8 $6,508.84 $6,784.46 $7,067.42 $9,457.87
Tax 30% 30% 30% 30% 30% 30% 30% 30% 30% 30%
Depreciation $3,990.00
$3,990.0
0 $3,990.00 $3,990.00 $3,990.00
$3,990.0
0 $3,990.00 $3,990.00 $3,990.00 $3,990.00
Free Cash Flow For
The Firm (FCFF) $7,490.00
$7,654.5
0 $7,823.47 $7,997.02 $8,175.25
$6,258.2
7 $8,546.19 $8,739.12 $8,937.19
$10,610.5
1
Cost of capital 6%
Discounting Factor
0.9433962
26
0.889996
44
0.8396192
83
0.7920936
63
0.7472581
73
0.704960
54
0.6650571
14
0.6274123
71
0.5918984
64
0.5583947
77
Present Value of
FCFF $7,066.04
$6,812.4
8 $6,568.74 $6,334.39 $6,109.02
$4,411.8
3 $5,683.70 $5,483.03 $5,289.91 $5,924.85
Total Present Value
$59,683.
99
Net Present Value
$17,683.
99
For BCC Year 0 Year 1 Year 2 Year 3 Year 4 Year 5 Year 6 Year 7 Year 8 Year 9 Year 10
Cost of Machine
$42,000.
00
Incremental Cash Revenue
$23,000.0
0
$23,460.
00
$23,929.2
0
$24,407.7
8
$24,895.9
4
$25,393.
86
$25,901.7
4
$26,419.7
7
$26,948.1
7
$27,487.1
3
Operating Expenses
$15,000.0
0
$15,187.
50
$15,377.3
4
$15,569.5
6
$15,764.1
8
$15,961.
23
$16,160.7
5
$16,362.7
6
$16,567.2
9
$16,774.3
8
Special maintenance
adjustment
$3,000.0
0
Paraphrase This Document
Need a fresh take? Get an instant paraphrase of this document with our AI Paraphraser
Scrap value $2,100.00
Depreciation $3,990.00
$3,990.0
0 $3,990.00 $3,990.00 $3,990.00
$3,990.0
0 $3,990.00 $3,990.00 $3,990.00 $3,990.00
Interest [25% debt] @
7.5% $787.50 $731.83 $671.99 $607.67 $538.51 $464.17 $384.26 $298.35 $206.00 $106.72
Income Before Tax $7,212.50
$7,540.6
7 $7,879.86 $8,230.56 $8,593.25
$5,968.4
5 $9,356.73 $9,758.66
$10,174.8
7
$12,706.0
2
Tax @ 25% $1,803.13
$1,885.1
7 $1,969.97 $2,057.64 $2,148.31
$1,492.1
1 $2,339.18 $2,439.67 $2,543.72 $3,176.51
Net Income $1,419.38
$1,665.5
0 $1,919.90 $2,182.92 $2,454.93 $486.34 $3,027.55 $3,329.00 $3,641.15 $5,539.52
Non Cash charges $3,990.00
$3,990.0
0 $3,990.00 $3,990.00 $3,990.00
$3,990.0
0 $3,990.00 $3,990.00 $3,990.00 $3,990.00
Free Cash Flow For The
Firm (FCFF) $6,000.00
$6,204.3
8 $6,413.89 $6,628.67 $6,848.82
$4,824.4
7 $7,305.74 $7,542.76 $7,785.66 $9,609.56
Cost of capital 5%
Discounting Factor
0.952380
952
0.952380
95
0.9523809
52
0.9523809
52
0.952380
952
0.952380
95
0.9523809
52
0.952380
952
0.9523809
52
0.9523809
52
Present Value of FCFF $5,714.29
$5,908.9
3 $6,108.47 $6,313.02 $6,522.69
$4,594.7
3 $6,957.85 $7,183.58 $7,414.91 $9,151.96
Total Present Value
$65,870.
42
Net Present Value
$23,870.
42
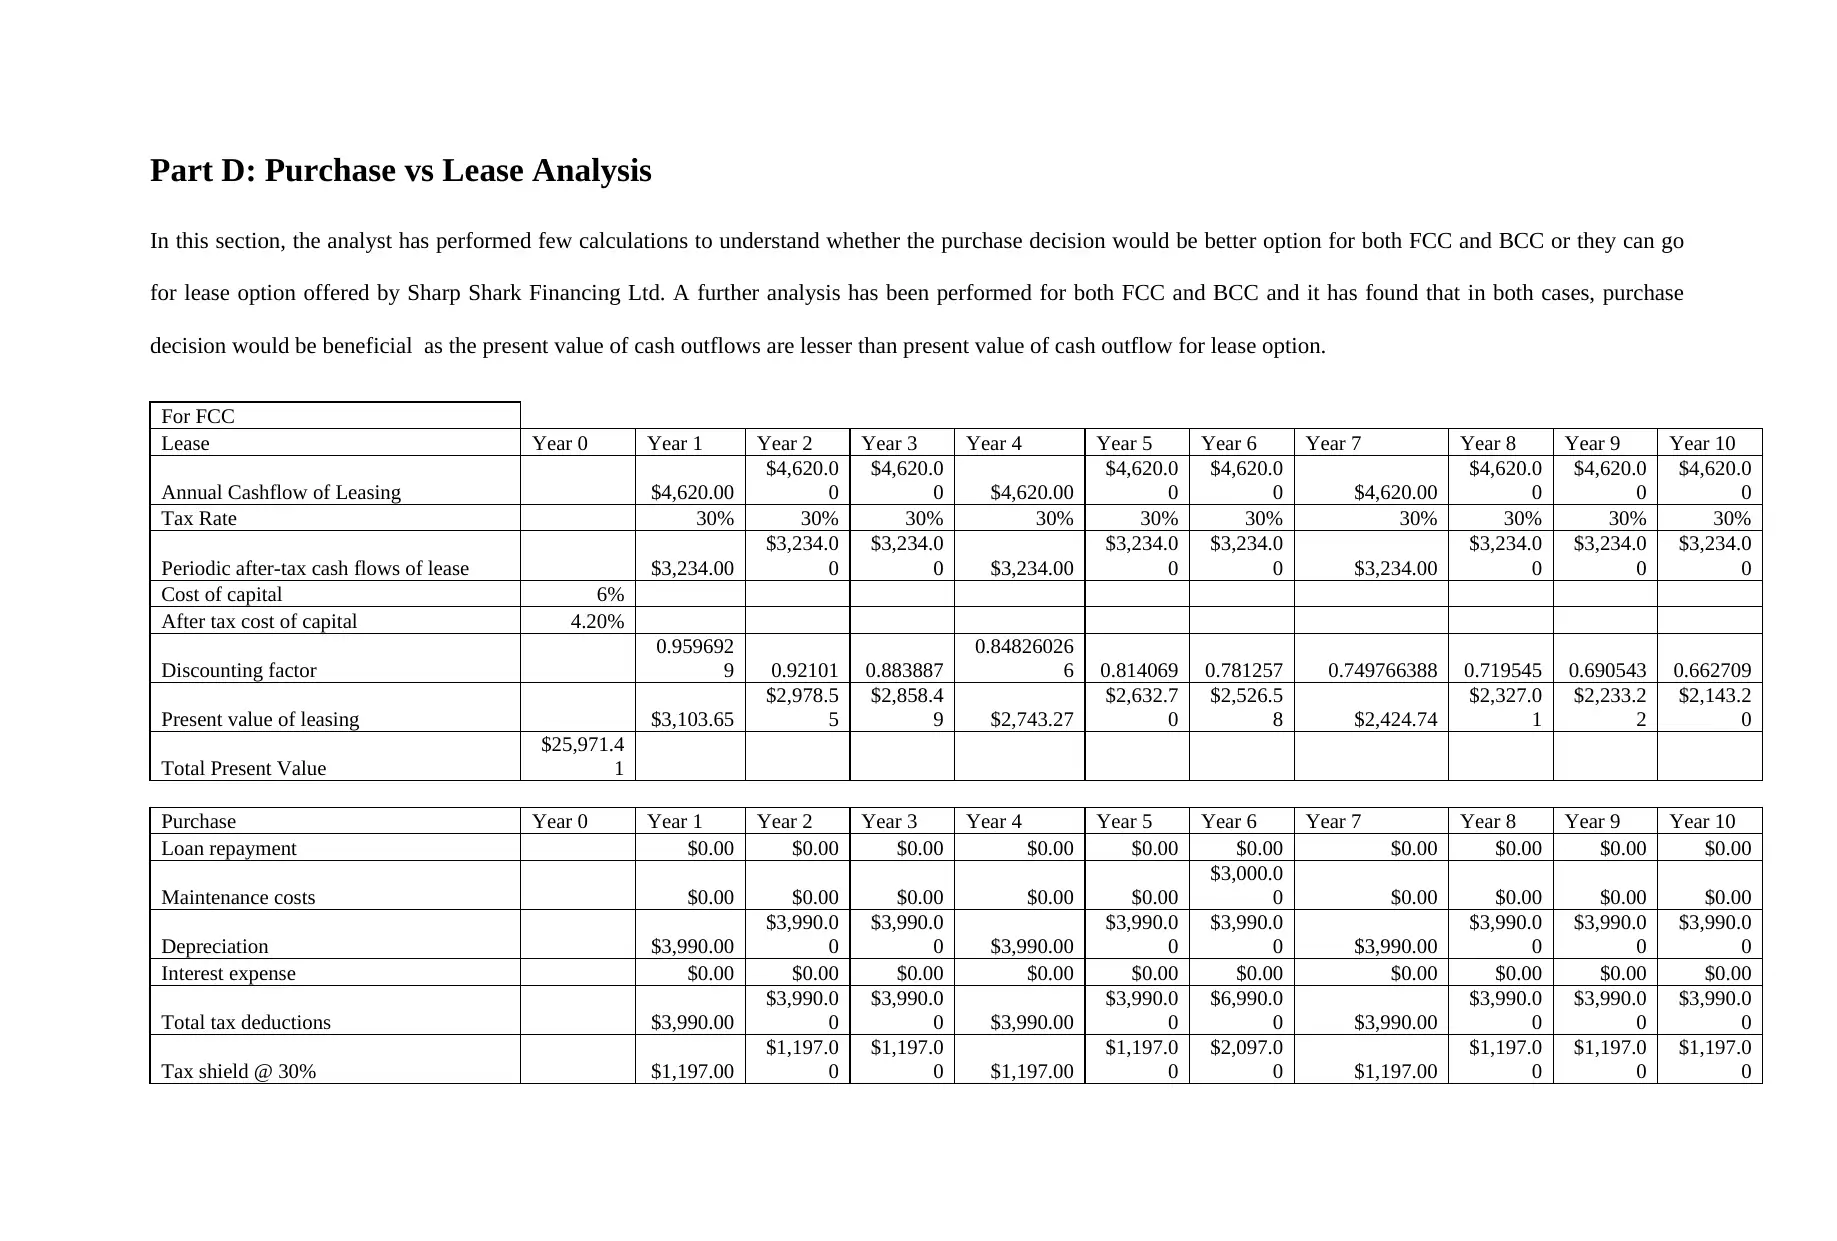
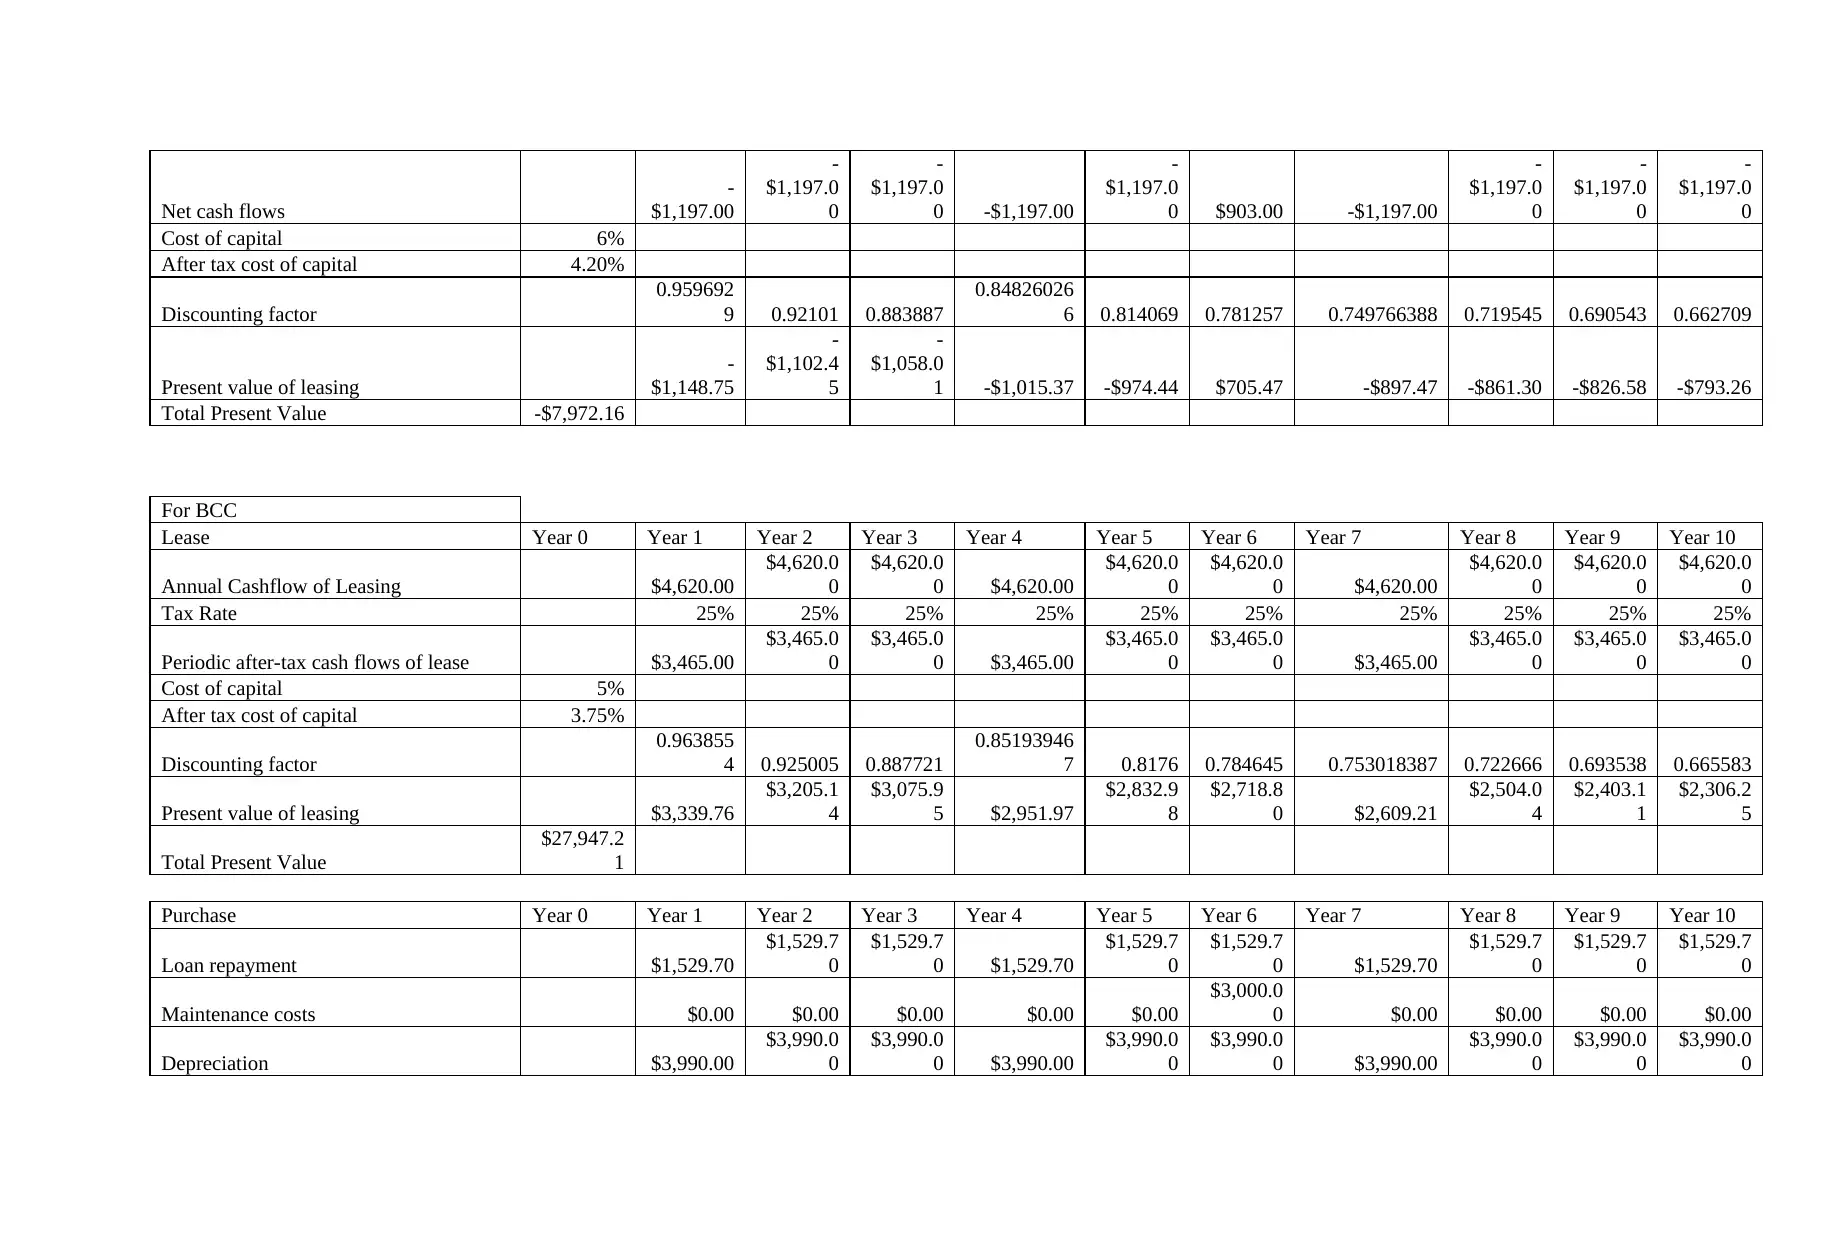
Part D: Purchase vs Lease Analysis
In this section, the analyst has performed few calculations to understand whether the purchase decision would be better option for both FCC and BCC or they can go
for lease option offered by Sharp Shark Financing Ltd. A further analysis has been performed for both FCC and BCC and it has found that in both cases, purchase
decision would be beneficial as the present value of cash outflows are lesser than present value of cash outflow for lease option.
For FCC
Lease Year 0 Year 1 Year 2 Year 3 Year 4 Year 5 Year 6 Year 7 Year 8 Year 9 Year 10
Annual Cashflow of Leasing $4,620.00
$4,620.0
0
$4,620.0
0 $4,620.00
$4,620.0
0
$4,620.0
0 $4,620.00
$4,620.0
0
$4,620.0
0
$4,620.0
0
Tax Rate 30% 30% 30% 30% 30% 30% 30% 30% 30% 30%
Periodic after-tax cash flows of lease $3,234.00
$3,234.0
0
$3,234.0
0 $3,234.00
$3,234.0
0
$3,234.0
0 $3,234.00
$3,234.0
0
$3,234.0
0
$3,234.0
0
Cost of capital 6%
After tax cost of capital 4.20%
Discounting factor
0.959692
9 0.92101 0.883887
0.84826026
6 0.814069 0.781257 0.749766388 0.719545 0.690543 0.662709
Present value of leasing $3,103.65
$2,978.5
5
$2,858.4
9 $2,743.27
$2,632.7
0
$2,526.5
8 $2,424.74
$2,327.0
1
$2,233.2
2
$2,143.2
0
Total Present Value
$25,971.4
1
Purchase Year 0 Year 1 Year 2 Year 3 Year 4 Year 5 Year 6 Year 7 Year 8 Year 9 Year 10
Loan repayment $0.00 $0.00 $0.00 $0.00 $0.00 $0.00 $0.00 $0.00 $0.00 $0.00
Maintenance costs $0.00 $0.00 $0.00 $0.00 $0.00
$3,000.0
0 $0.00 $0.00 $0.00 $0.00
Depreciation $3,990.00
$3,990.0
0
$3,990.0
0 $3,990.00
$3,990.0
0
$3,990.0
0 $3,990.00
$3,990.0
0
$3,990.0
0
$3,990.0
0
Interest expense $0.00 $0.00 $0.00 $0.00 $0.00 $0.00 $0.00 $0.00 $0.00 $0.00
Total tax deductions $3,990.00
$3,990.0
0
$3,990.0
0 $3,990.00
$3,990.0
0
$6,990.0
0 $3,990.00
$3,990.0
0
$3,990.0
0
$3,990.0
0
Tax shield @ 30% $1,197.00
$1,197.0
0
$1,197.0
0 $1,197.00
$1,197.0
0
$2,097.0
0 $1,197.00
$1,197.0
0
$1,197.0
0
$1,197.0
0
⊘ This is a preview!⊘
Do you want full access?
Subscribe today to unlock all pages.
Trusted by 1+ million students worldwide
Net cash flows
-
$1,197.00
-
$1,197.0
0
-
$1,197.0
0 -$1,197.00
-
$1,197.0
0 $903.00 -$1,197.00
-
$1,197.0
0
-
$1,197.0
0
-
$1,197.0
0
Cost of capital 6%
After tax cost of capital 4.20%
Discounting factor
0.959692
9 0.92101 0.883887
0.84826026
6 0.814069 0.781257 0.749766388 0.719545 0.690543 0.662709
Present value of leasing
-
$1,148.75
-
$1,102.4
5
-
$1,058.0
1 -$1,015.37 -$974.44 $705.47 -$897.47 -$861.30 -$826.58 -$793.26
Total Present Value -$7,972.16
For BCC
Lease Year 0 Year 1 Year 2 Year 3 Year 4 Year 5 Year 6 Year 7 Year 8 Year 9 Year 10
Annual Cashflow of Leasing $4,620.00
$4,620.0
0
$4,620.0
0 $4,620.00
$4,620.0
0
$4,620.0
0 $4,620.00
$4,620.0
0
$4,620.0
0
$4,620.0
0
Tax Rate 25% 25% 25% 25% 25% 25% 25% 25% 25% 25%
Periodic after-tax cash flows of lease $3,465.00
$3,465.0
0
$3,465.0
0 $3,465.00
$3,465.0
0
$3,465.0
0 $3,465.00
$3,465.0
0
$3,465.0
0
$3,465.0
0
Cost of capital 5%
After tax cost of capital 3.75%
Discounting factor
0.963855
4 0.925005 0.887721
0.85193946
7 0.8176 0.784645 0.753018387 0.722666 0.693538 0.665583
Present value of leasing $3,339.76
$3,205.1
4
$3,075.9
5 $2,951.97
$2,832.9
8
$2,718.8
0 $2,609.21
$2,504.0
4
$2,403.1
1
$2,306.2
5
Total Present Value
$27,947.2
1
Purchase Year 0 Year 1 Year 2 Year 3 Year 4 Year 5 Year 6 Year 7 Year 8 Year 9 Year 10
Loan repayment $1,529.70
$1,529.7
0
$1,529.7
0 $1,529.70
$1,529.7
0
$1,529.7
0 $1,529.70
$1,529.7
0
$1,529.7
0
$1,529.7
0
Maintenance costs $0.00 $0.00 $0.00 $0.00 $0.00
$3,000.0
0 $0.00 $0.00 $0.00 $0.00
Depreciation $3,990.00
$3,990.0
0
$3,990.0
0 $3,990.00
$3,990.0
0
$3,990.0
0 $3,990.00
$3,990.0
0
$3,990.0
0
$3,990.0
0
-
$1,197.00
-
$1,197.0
0
-
$1,197.0
0 -$1,197.00
-
$1,197.0
0 $903.00 -$1,197.00
-
$1,197.0
0
-
$1,197.0
0
-
$1,197.0
0
Cost of capital 6%
After tax cost of capital 4.20%
Discounting factor
0.959692
9 0.92101 0.883887
0.84826026
6 0.814069 0.781257 0.749766388 0.719545 0.690543 0.662709
Present value of leasing
-
$1,148.75
-
$1,102.4
5
-
$1,058.0
1 -$1,015.37 -$974.44 $705.47 -$897.47 -$861.30 -$826.58 -$793.26
Total Present Value -$7,972.16
For BCC
Lease Year 0 Year 1 Year 2 Year 3 Year 4 Year 5 Year 6 Year 7 Year 8 Year 9 Year 10
Annual Cashflow of Leasing $4,620.00
$4,620.0
0
$4,620.0
0 $4,620.00
$4,620.0
0
$4,620.0
0 $4,620.00
$4,620.0
0
$4,620.0
0
$4,620.0
0
Tax Rate 25% 25% 25% 25% 25% 25% 25% 25% 25% 25%
Periodic after-tax cash flows of lease $3,465.00
$3,465.0
0
$3,465.0
0 $3,465.00
$3,465.0
0
$3,465.0
0 $3,465.00
$3,465.0
0
$3,465.0
0
$3,465.0
0
Cost of capital 5%
After tax cost of capital 3.75%
Discounting factor
0.963855
4 0.925005 0.887721
0.85193946
7 0.8176 0.784645 0.753018387 0.722666 0.693538 0.665583
Present value of leasing $3,339.76
$3,205.1
4
$3,075.9
5 $2,951.97
$2,832.9
8
$2,718.8
0 $2,609.21
$2,504.0
4
$2,403.1
1
$2,306.2
5
Total Present Value
$27,947.2
1
Purchase Year 0 Year 1 Year 2 Year 3 Year 4 Year 5 Year 6 Year 7 Year 8 Year 9 Year 10
Loan repayment $1,529.70
$1,529.7
0
$1,529.7
0 $1,529.70
$1,529.7
0
$1,529.7
0 $1,529.70
$1,529.7
0
$1,529.7
0
$1,529.7
0
Maintenance costs $0.00 $0.00 $0.00 $0.00 $0.00
$3,000.0
0 $0.00 $0.00 $0.00 $0.00
Depreciation $3,990.00
$3,990.0
0
$3,990.0
0 $3,990.00
$3,990.0
0
$3,990.0
0 $3,990.00
$3,990.0
0
$3,990.0
0
$3,990.0
0
Paraphrase This Document
Need a fresh take? Get an instant paraphrase of this document with our AI Paraphraser
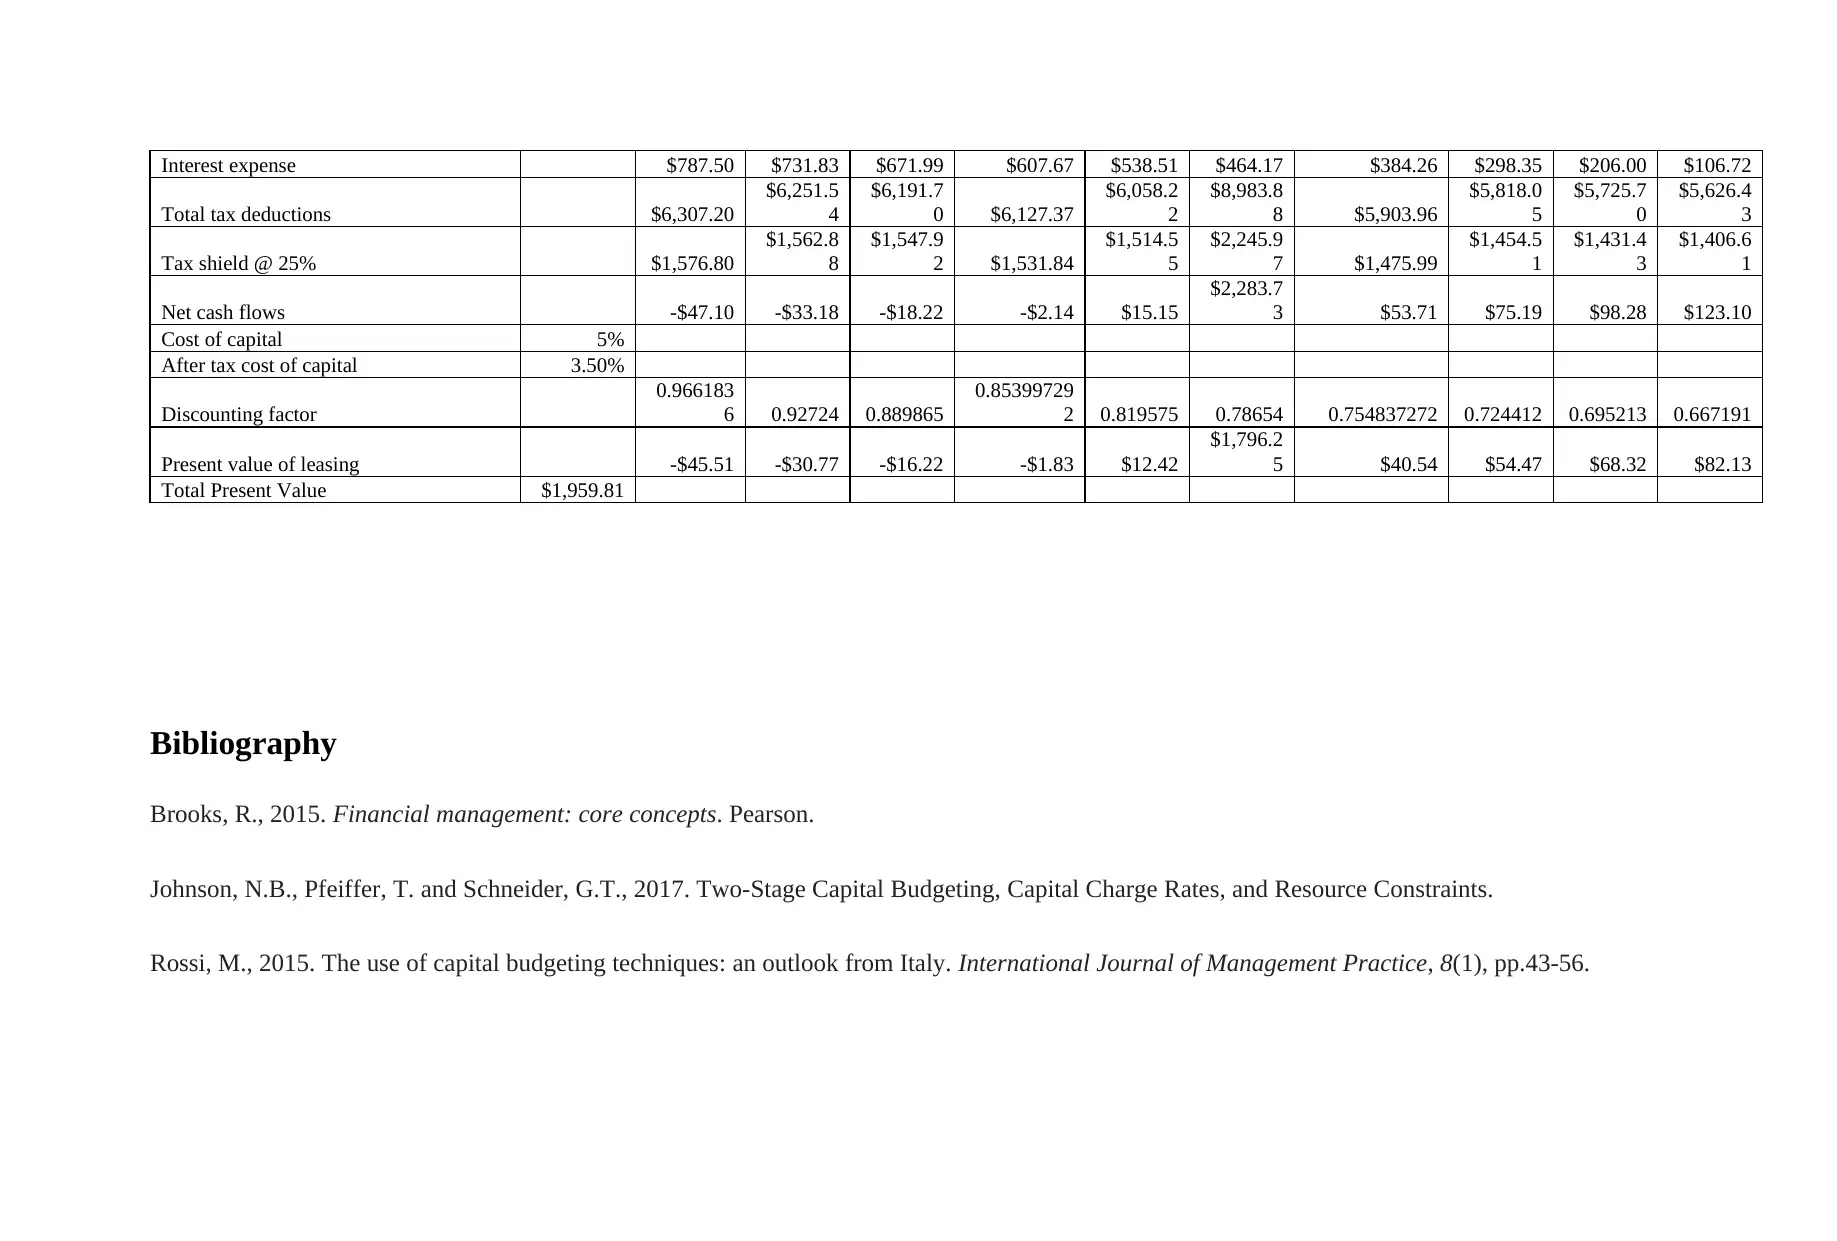
Interest expense $787.50 $731.83 $671.99 $607.67 $538.51 $464.17 $384.26 $298.35 $206.00 $106.72
Total tax deductions $6,307.20
$6,251.5
4
$6,191.7
0 $6,127.37
$6,058.2
2
$8,983.8
8 $5,903.96
$5,818.0
5
$5,725.7
0
$5,626.4
3
Tax shield @ 25% $1,576.80
$1,562.8
8
$1,547.9
2 $1,531.84
$1,514.5
5
$2,245.9
7 $1,475.99
$1,454.5
1
$1,431.4
3
$1,406.6
1
Net cash flows -$47.10 -$33.18 -$18.22 -$2.14 $15.15
$2,283.7
3 $53.71 $75.19 $98.28 $123.10
Cost of capital 5%
After tax cost of capital 3.50%
Discounting factor
0.966183
6 0.92724 0.889865
0.85399729
2 0.819575 0.78654 0.754837272 0.724412 0.695213 0.667191
Present value of leasing -$45.51 -$30.77 -$16.22 -$1.83 $12.42
$1,796.2
5 $40.54 $54.47 $68.32 $82.13
Total Present Value $1,959.81
Bibliography
Brooks, R., 2015. Financial management: core concepts. Pearson.
Johnson, N.B., Pfeiffer, T. and Schneider, G.T., 2017. Two-Stage Capital Budgeting, Capital Charge Rates, and Resource Constraints.
Rossi, M., 2015. The use of capital budgeting techniques: an outlook from Italy. International Journal of Management Practice, 8(1), pp.43-56.
Schlegel, D., Frank, F. and Britzelmaier, B., 2016. Investment decisions and capital budgeting practices in German manufacturing
companies. International Journal of Business and Globalisation, 16(1), pp.66-78.
companies. International Journal of Business and Globalisation, 16(1), pp.66-78.
⊘ This is a preview!⊘
Do you want full access?
Subscribe today to unlock all pages.
Trusted by 1+ million students worldwide
1 out of 12
Your All-in-One AI-Powered Toolkit for Academic Success.
+13062052269
info@desklib.com
Available 24*7 on WhatsApp / Email
![[object Object]](/_next/static/media/star-bottom.7253800d.svg)
Unlock your academic potential
Copyright © 2020–2026 A2Z Services. All Rights Reserved. Developed and managed by ZUCOL.