Understanding Fiscal Administration: Importance, Reports, and Ratios
VerifiedAdded on 2023/06/08
|13
|2901
|473
AI Summary
This study explains the importance of fiscal administration, its obligations, and the role of a fiscal supervisor. It covers financial reports, including income statements, balance sheets, cash flow statements, and notes to accounts. The study also explains various ratios, such as liquidity, profitability, and efficiency ratios, and provides insights into the profitability, efficiency, and liquidity of a business. The study concludes with recommendations for improving the assets turnover ratio and enhancing the business's financial health.
Contribute Materials
Your contribution can guide someone’s learning journey. Share your
documents today.

Business
Secure Best Marks with AI Grader
Need help grading? Try our AI Grader for instant feedback on your assignments.
Contents
Contents...........................................................................................................................................2
INTRODUCTION...........................................................................................................................1
SECTION 1.....................................................................................................................................1
SECTION 2.....................................................................................................................................2
SECTION 3:....................................................................................................................................4
SECTION: 4....................................................................................................................................5
CONCLUSION................................................................................................................................5
REFERENCES................................................................................................................................7
APPENDIX......................................................................................................................................8

INTRODUCTION
The prepared study's purpose is to clarify and describe fiscal administration and to
demonstrate for its necessity (Bouveret, 2018). To think about the obligations and tasks of a
fiscal supervisor. To analyze monetary accounts and clarify the function of ratios. The numerous
kinds of fiscal reports would be covered in detail, along with their uses in monetary planning. A
few instances would also be provided. The study's practical section would be shown together
with an income statement, balance sheet, and an analysis of the profitability, liquidity, and
efficiency of the company depending on the ratio findings. The recommended monetary
recommendations for enhancement would be accompanied by a conclusion.
SECTION 1
Our contemporary society is financially orientated and continually changing, therefore
financing is the foundation of commercial activities and offers accessibility to all the resources
needed by corporate firms. Making a gain requires funds, however this requirement only holds
true when there is good fiscal administration. Without funding, there could be no industry or
company. Finance management is a complicated procedure which engages with making the best
utilisation of a corporation's monetary funds. It involves giving a corporate investment decisions,
keeping up corporate ties with shareholders, bookkeeping, disclosing, budgetary control, and
handling costs and earnings. It also involves task evaluation, preparing, predicting, and inventory
control. Consequently, finance management in a firm encompasses everything which has to do
with cash or funds in general. Across a whole company' life span and in all aspects of its
operations, irrespective of its stage, this monetary mechanism is important (Eka, 2018).
Acquisitions, funding, and assets control are the 3 primary purposes of fiscal management,
and corporate purposes are reflected in such procedures. A finance supervisor should keep track
of financial statements, create projections, and consider the monetary implications. Prior to
investing any assets that may be accessible, it is essential to assess their potential and determine
how best to use them. The following phase is to acquire finance and determine where and how to
get funding for anticipated budgetary demands. The final step is to allocate funds in a corporate
entity in a way that will maximise their worth.
Secure Best Marks with AI Grader
Need help grading? Try our AI Grader for instant feedback on your assignments.
SECTION 2
Every commercial firm typically prepares income accounts, which cover all fiscal activities
which have occurred over a certain duration of time. Yearly findings are most frequently
generated. They have 5 primary components; the initial 3 are, assets, liabilities, and equity,
reflect the monetary finance stance of a venture; the other 2, income and expenditure, display the
fiscal outcome of the company; and these 2 components are characterised in the "income
statement" or "statement of profit or loss."
Assets: It is a tool used by an organisation. It is dependent on the result of a previous
occurrence, is owned by someone, and anticipated to provide advantages in the coming.
As an illustration, the acquisition of a machinery which would be utilised to make goods
which would be marketed and bring in money in the near term is a historical occurrence.
Liabilities: It is the responsibility which resulted from historical actions and exists in the
current. It pertains to a company, and it would gain economically if the institution's funds
are used to pay this obligation. A mortgage from a banking institution is perhaps the most
typical type of obligation (Foyeke, Olusola and Aderemi, 2016).
Equities: It is the value that stays in assets after all business obligations have been
subtracted, hence it implies that Equity = Assets- Liabilities
Income: It is a result of financial gains realised within a certain accountancy term due to
enhanced holdings or decreased obligations that raise ownership. For instance, if a
product vendor lowers its pricing, the firm will obviously experience an improvement in
revenue.
Expenditure: It occurs from a decline in the economical advantage throughout the
course of an accountancy term due to diminished holdings or the influence of
obligations that lowers ownership. As an illustration, paying for power is an expenditure.
Income statement: It is a report whose goal is to provide monetary information for a
particular fiscal quarter. This statement details the revenue, costs, and profit or loss. A
customer should go for the income statement if they want to see how much revenue a
company makes.
Balance sheet: Assets, liabilities, and ownership are generated by the balance sheet,
which implies it provides information about the fiscal situation throughout a given year.
Obligations could be simply subtracted from overall assets to determine aggregate value.
The variation between this and an income statement is that here, rather than an income
statement for a particular fiscal year, the accounts balances being presented (Ivanovich,
2020).
Understanding the stakeholders' contributions, the equity's flow, and its total at the
conclusion of the accounting year are the two main goals of the Statements of Shift in Equities.
Here, the shareholder equity, overall capital, retained earnings, and dividend payments are all
displayed.
Cash flow statement: It is a fiscal report whose purpose is to show the movements of
cash flows in an organisation over a predetermined temporal frame. Cash flows are broken down
into 3 categories: operating, investing, and financial activity. For instance, operating cash flows
demonstrate how much money a certain business operations generate.
Notes to accounts: Global Monetary Accounting Rules mandate that a note be included
with the monetary statements; nevertheless, most individuals fail to do so. In intended to
facilitate clients, such comments provide improved, clearer, and comprehensive details regarding
fiscal reports. This study goes into great depth about all the data which is lacking in the
preceding studies (Kwilinskyi, Shteingauz and Maslov, 2020).
Ratio analysis: It is mathematically defined as a number split by a fraction, expresses the
interrelationship among 2 things. The ratio is employed to assess a procedure' efficiency in fiscal
administration. The efficiency measurement is calculated by dividing the outcome by the inputs.
Such figures are extracted from the fiscal reports in order to provide a company with important
data. Liquidity ratios, profitability, efficiency, market value ratios, solvency, and other
subcategories are some of the major ratio types.
Liquidity ratios: It demonstrates a company's ability to pay both brief as well as longer
run obligations. It can be broken down into a few other liquidity ratios, including the
current, quick, and cash ratios. Assets which are projected to be turned into money during
the course of one fiscal term are referred to as current assets. A higher ratio indicates
great liquidity for the organisation. Since stocks are harder to turn into money, these are
not included in current assets in the calculation of quick ratio, which is different from the
current ratio. Just monetary assets or their substitutes are used in cash ratio calculations.
Shorter run obligations' liquidity is unhindered if the ratio is substantial.
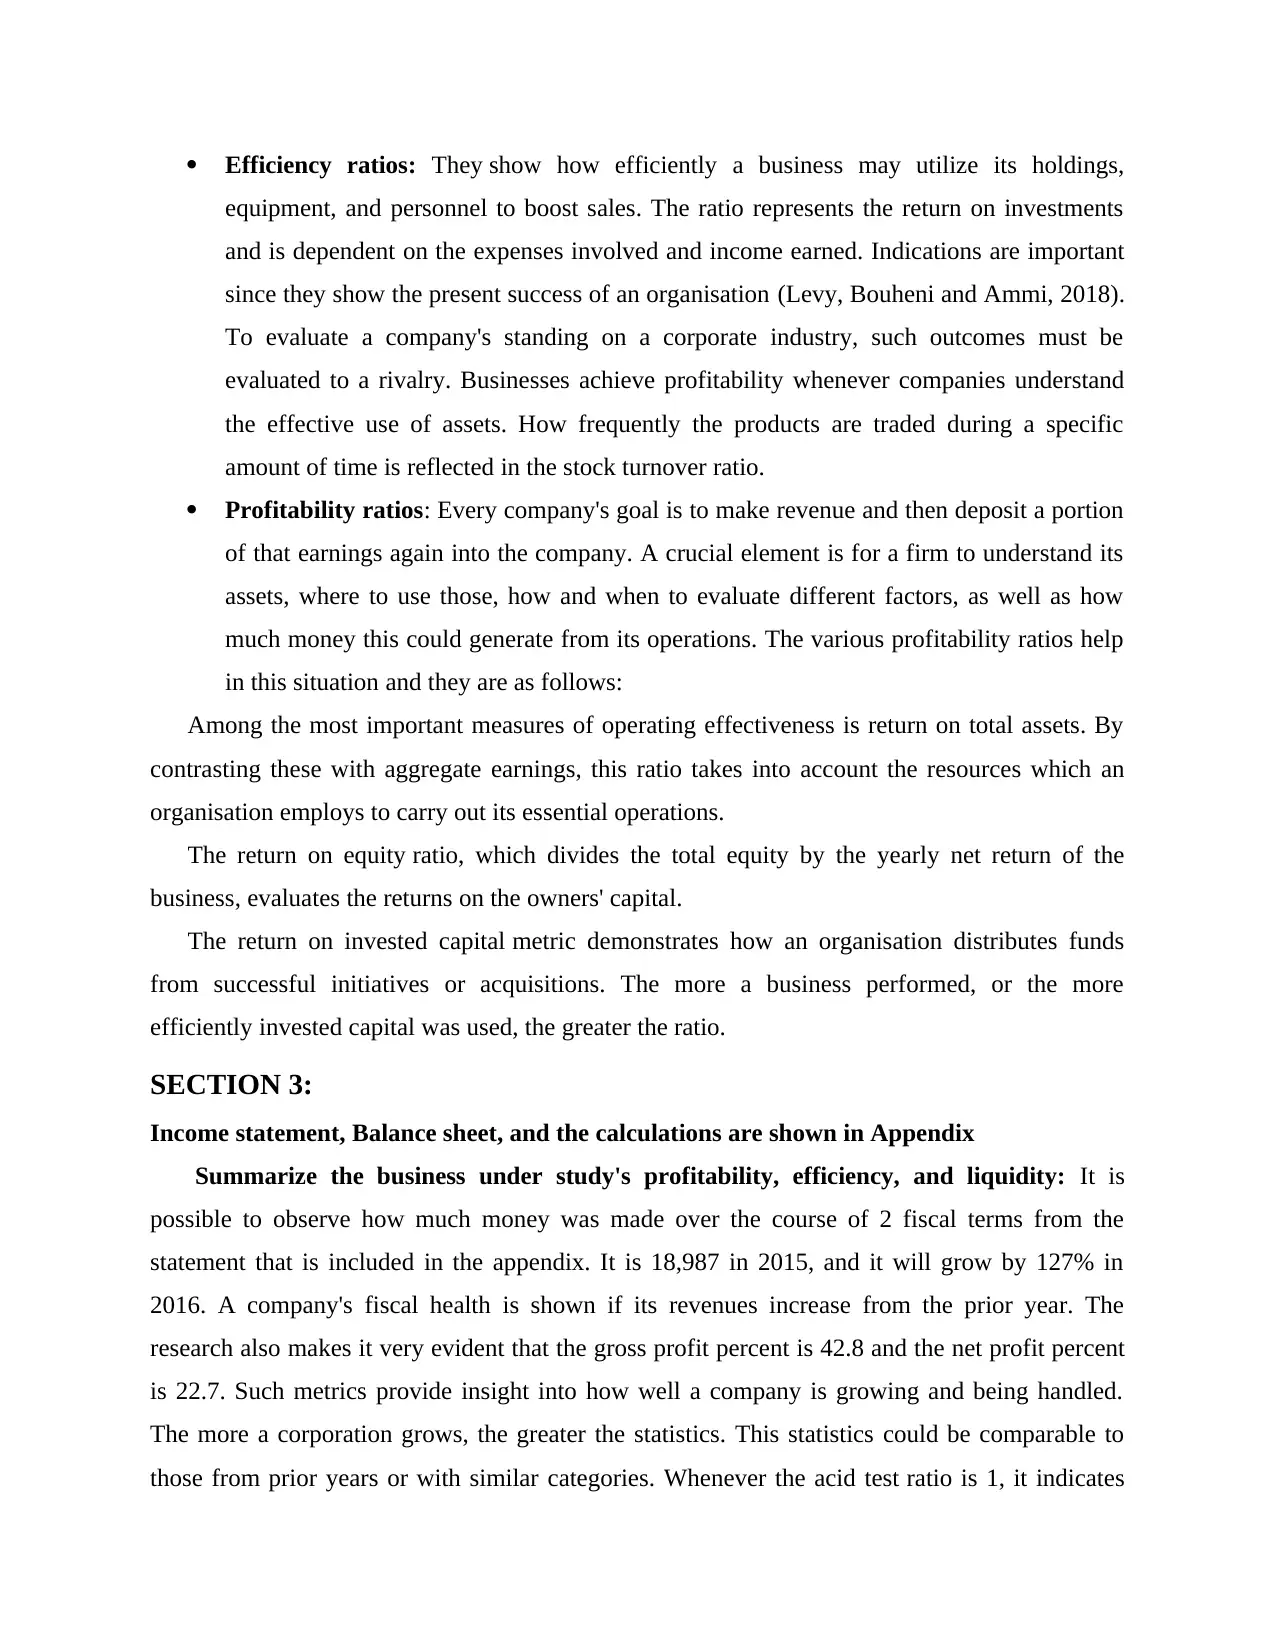
Efficiency ratios: They show how efficiently a business may utilize its holdings,
equipment, and personnel to boost sales. The ratio represents the return on investments
and is dependent on the expenses involved and income earned. Indications are important
since they show the present success of an organisation (Levy, Bouheni and Ammi, 2018).
To evaluate a company's standing on a corporate industry, such outcomes must be
evaluated to a rivalry. Businesses achieve profitability whenever companies understand
the effective use of assets. How frequently the products are traded during a specific
amount of time is reflected in the stock turnover ratio.
Profitability ratios: Every company's goal is to make revenue and then deposit a portion
of that earnings again into the company. A crucial element is for a firm to understand its
assets, where to use those, how and when to evaluate different factors, as well as how
much money this could generate from its operations. The various profitability ratios help
in this situation and they are as follows:
Among the most important measures of operating effectiveness is return on total assets. By
contrasting these with aggregate earnings, this ratio takes into account the resources which an
organisation employs to carry out its essential operations.
The return on equity ratio, which divides the total equity by the yearly net return of the
business, evaluates the returns on the owners' capital.
The return on invested capital metric demonstrates how an organisation distributes funds
from successful initiatives or acquisitions. The more a business performed, or the more
efficiently invested capital was used, the greater the ratio.
SECTION 3:
Income statement, Balance sheet, and the calculations are shown in Appendix
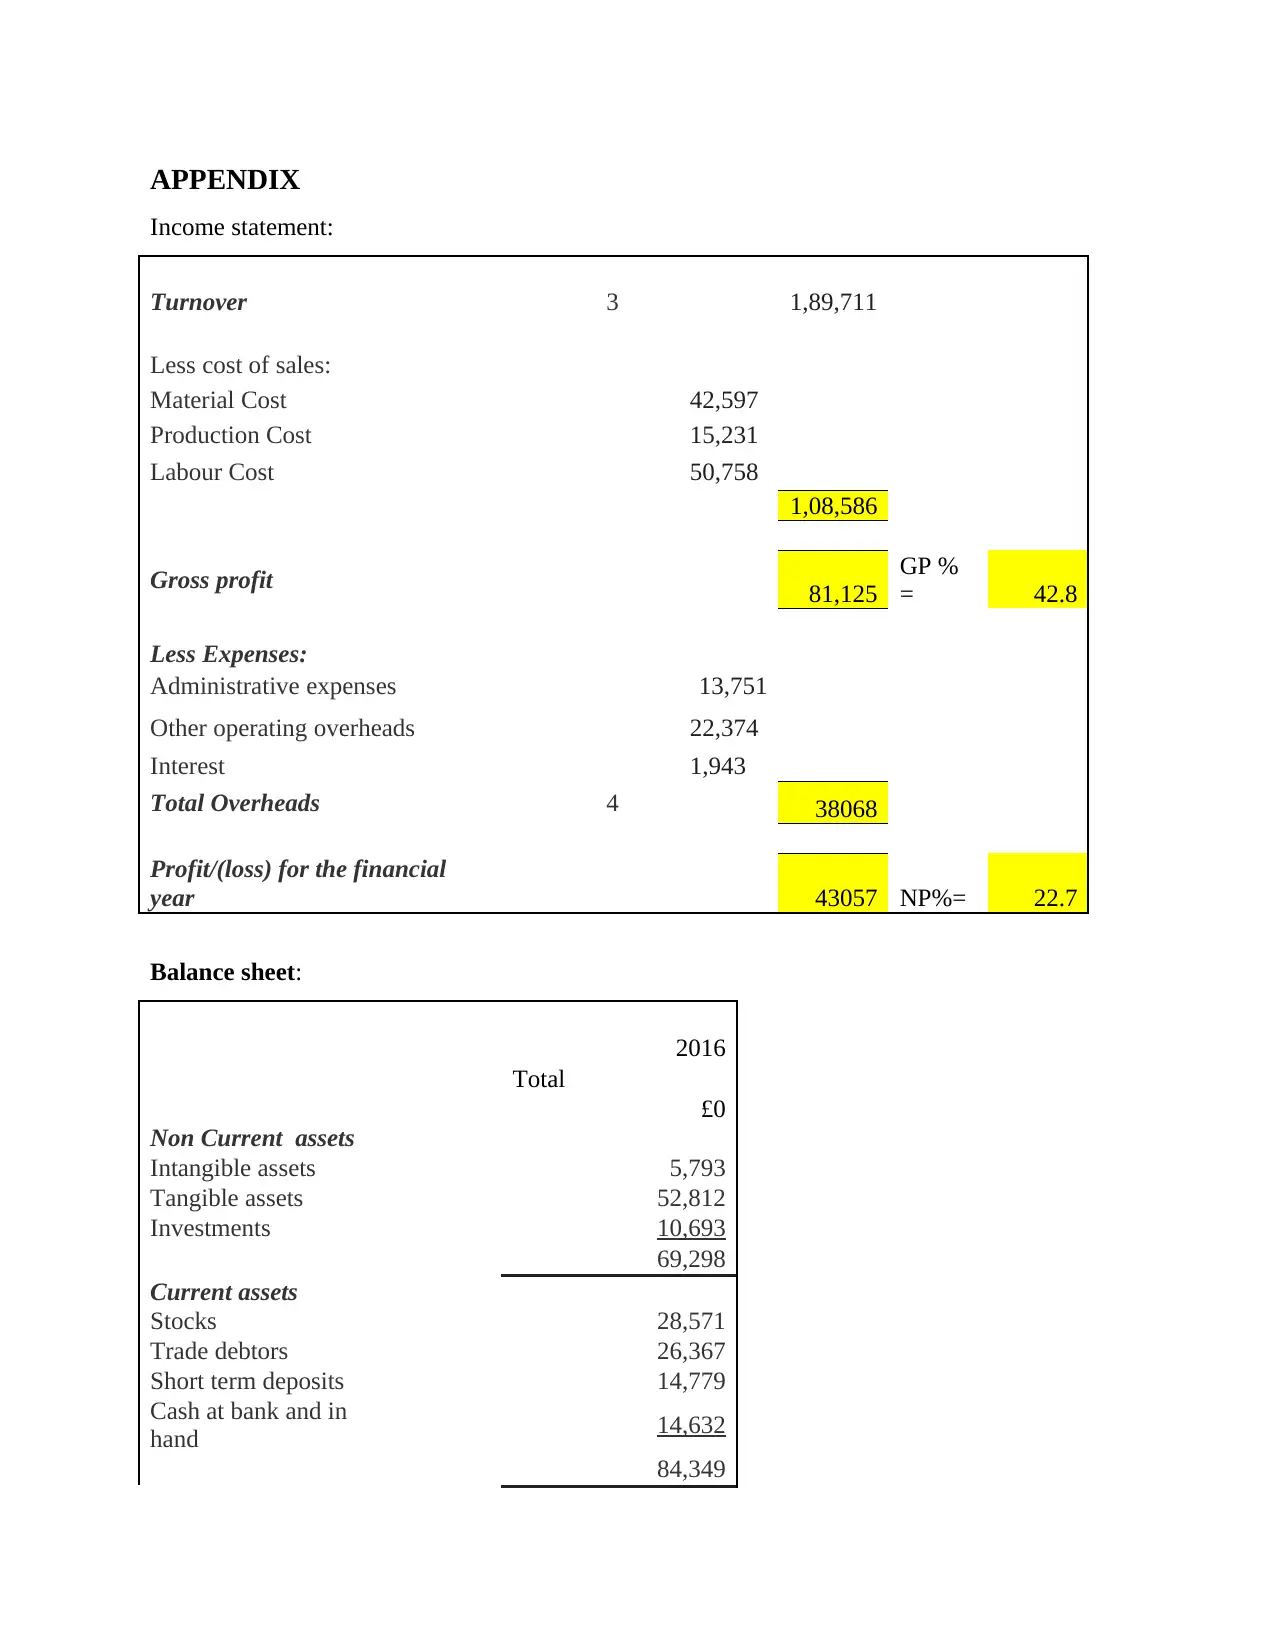
Summarize the business under study's profitability, efficiency, and liquidity: It is
possible to observe how much money was made over the course of 2 fiscal terms from the
statement that is included in the appendix. It is 18,987 in 2015, and it will grow by 127% in
2016. A company's fiscal health is shown if its revenues increase from the prior year. The
research also makes it very evident that the gross profit percent is 42.8 and the net profit percent
is 22.7. Such metrics provide insight into how well a company is growing and being handled.
The more a corporation grows, the greater the statistics. This statistics could be comparable to
those from prior years or with similar categories. Whenever the acid test ratio is 1, it indicates
equipment, and personnel to boost sales. The ratio represents the return on investments
and is dependent on the expenses involved and income earned. Indications are important
since they show the present success of an organisation (Levy, Bouheni and Ammi, 2018).
To evaluate a company's standing on a corporate industry, such outcomes must be
evaluated to a rivalry. Businesses achieve profitability whenever companies understand
the effective use of assets. How frequently the products are traded during a specific
amount of time is reflected in the stock turnover ratio.
Profitability ratios: Every company's goal is to make revenue and then deposit a portion
of that earnings again into the company. A crucial element is for a firm to understand its
assets, where to use those, how and when to evaluate different factors, as well as how
much money this could generate from its operations. The various profitability ratios help
in this situation and they are as follows:
Among the most important measures of operating effectiveness is return on total assets. By
contrasting these with aggregate earnings, this ratio takes into account the resources which an
organisation employs to carry out its essential operations.
The return on equity ratio, which divides the total equity by the yearly net return of the
business, evaluates the returns on the owners' capital.
The return on invested capital metric demonstrates how an organisation distributes funds
from successful initiatives or acquisitions. The more a business performed, or the more
efficiently invested capital was used, the greater the ratio.
SECTION 3:
Income statement, Balance sheet, and the calculations are shown in Appendix
Summarize the business under study's profitability, efficiency, and liquidity: It is
possible to observe how much money was made over the course of 2 fiscal terms from the
statement that is included in the appendix. It is 18,987 in 2015, and it will grow by 127% in
2016. A company's fiscal health is shown if its revenues increase from the prior year. The
research also makes it very evident that the gross profit percent is 42.8 and the net profit percent
is 22.7. Such metrics provide insight into how well a company is growing and being handled.
The more a corporation grows, the greater the statistics. This statistics could be comparable to
those from prior years or with similar categories. Whenever the acid test ratio is 1, it indicates
Paraphrase This Document
Need a fresh take? Get an instant paraphrase of this document with our AI Paraphraser
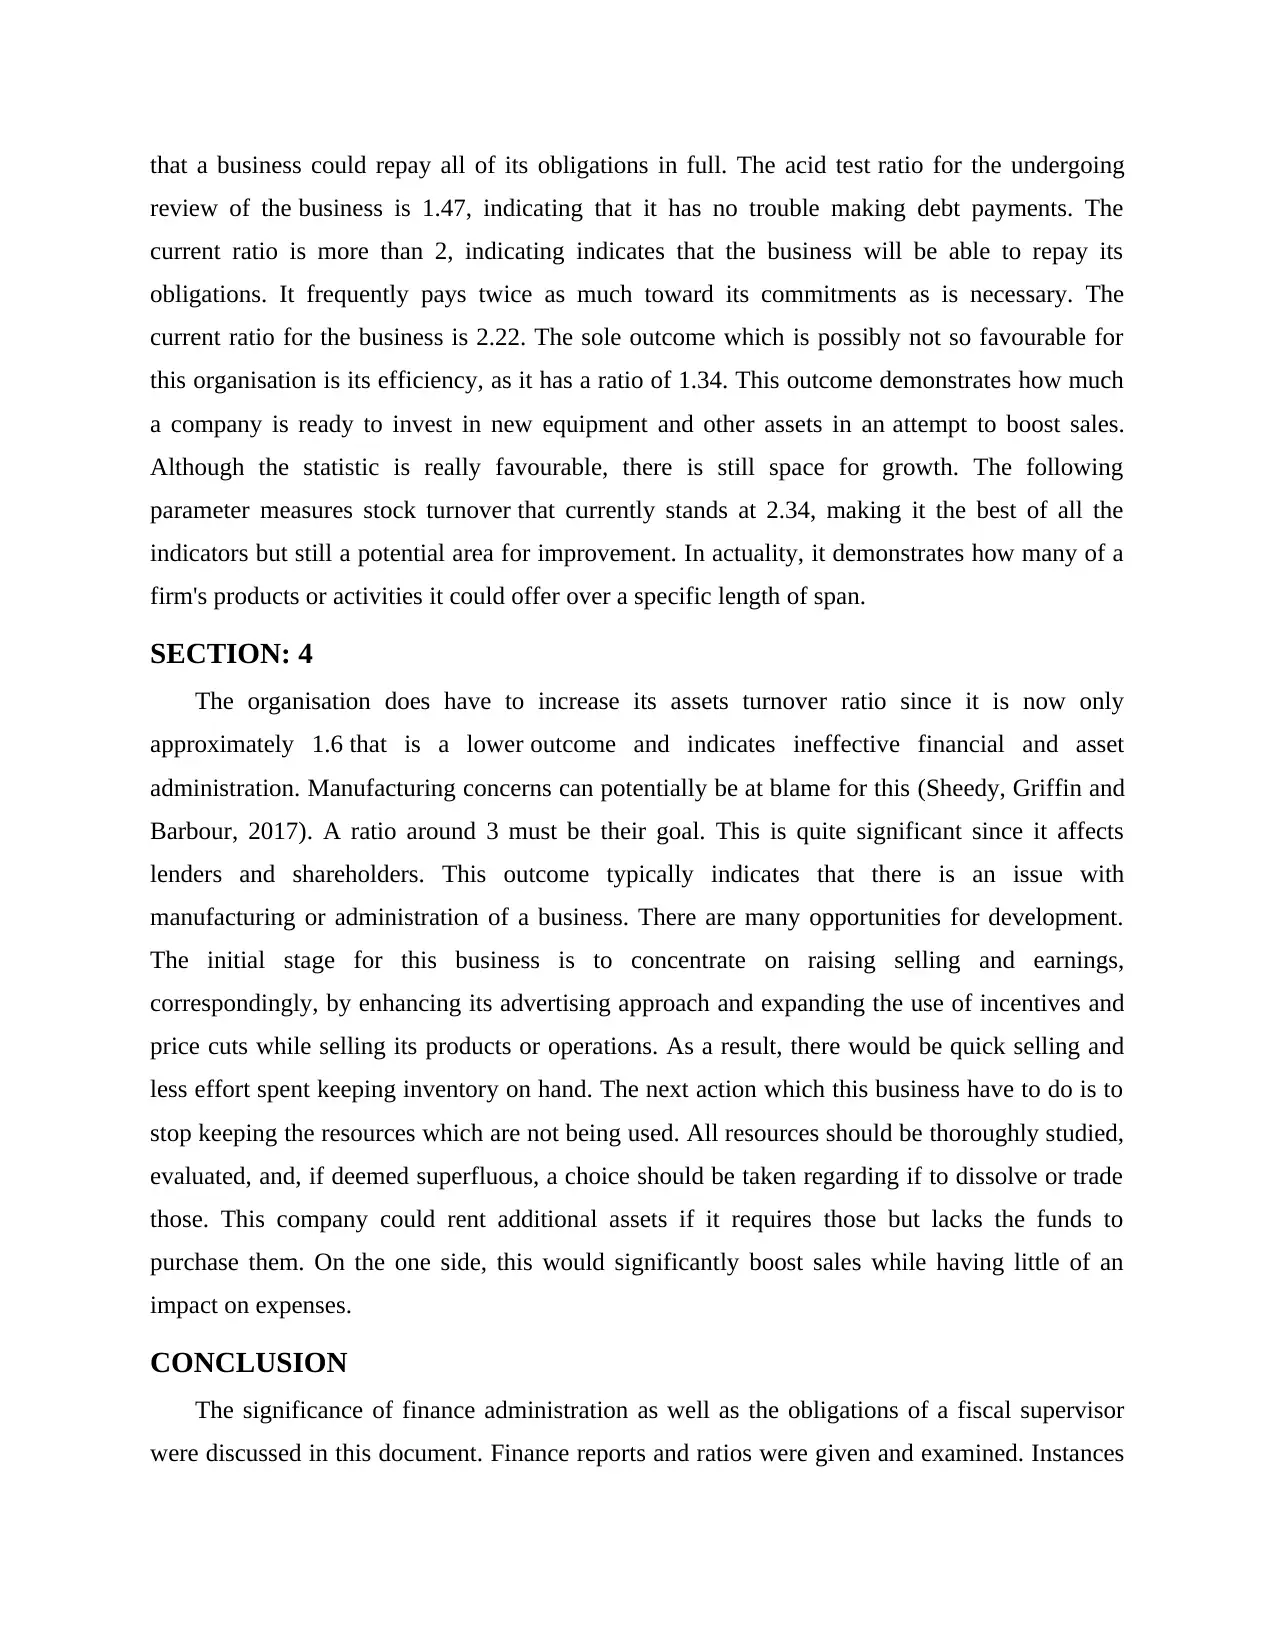
that a business could repay all of its obligations in full. The acid test ratio for the undergoing
review of the business is 1.47, indicating that it has no trouble making debt payments. The
current ratio is more than 2, indicating indicates that the business will be able to repay its
obligations. It frequently pays twice as much toward its commitments as is necessary. The
current ratio for the business is 2.22. The sole outcome which is possibly not so favourable for
this organisation is its efficiency, as it has a ratio of 1.34. This outcome demonstrates how much
a company is ready to invest in new equipment and other assets in an attempt to boost sales.
Although the statistic is really favourable, there is still space for growth. The following
parameter measures stock turnover that currently stands at 2.34, making it the best of all the
indicators but still a potential area for improvement. In actuality, it demonstrates how many of a
firm's products or activities it could offer over a specific length of span.
SECTION: 4
The organisation does have to increase its assets turnover ratio since it is now only
approximately 1.6 that is a lower outcome and indicates ineffective financial and asset
administration. Manufacturing concerns can potentially be at blame for this (Sheedy, Griffin and
Barbour, 2017). A ratio around 3 must be their goal. This is quite significant since it affects
lenders and shareholders. This outcome typically indicates that there is an issue with
manufacturing or administration of a business. There are many opportunities for development.
The initial stage for this business is to concentrate on raising selling and earnings,
correspondingly, by enhancing its advertising approach and expanding the use of incentives and
price cuts while selling its products or operations. As a result, there would be quick selling and
less effort spent keeping inventory on hand. The next action which this business have to do is to
stop keeping the resources which are not being used. All resources should be thoroughly studied,
evaluated, and, if deemed superfluous, a choice should be taken regarding if to dissolve or trade
those. This company could rent additional assets if it requires those but lacks the funds to
purchase them. On the one side, this would significantly boost sales while having little of an
impact on expenses.
CONCLUSION
The significance of finance administration as well as the obligations of a fiscal supervisor
were discussed in this document. Finance reports and ratios were given and examined. Instances

are provided as well as consideration of other categories. All evaluations have been finished, and
spreadsheets with the information have been provided. There were recommendations made for
the assessed firm's enhancements.
spreadsheets with the information have been provided. There were recommendations made for
the assessed firm's enhancements.
REFERENCES
Books and journals
Bouveret, A., 2018. Cyber risk for the financial sector: A framework for quantitative assessment.
International Monetary Fund.
Eka, H., 2018. Corporate finance and firm value in the Indonesian manufacturing
companies. BUSINESS STUDIES. 11(2). pp.113-127.
Foyeke, O.I., Olusola, F.S. and Aderemi, A.K., 2016. Financial structure and the profitability of
manufacturing companies in Nigeria.
Ivanovich, K.K., 2020. About some questions of classification of institutional conditions
determining the structure of doing business in Uzbekistan. South Asian Journal of
Marketing & Management Research. 10(5). pp.17-28.
Kwilinskyi, O., Shteingauz, D. and Maslov, V., 2020. Financial and credit instruments for
ensuring effective functioning of the residential real estate market.
Levy, A., Bouheni, F.B. and Ammi, C., 2018. Financial management: USGAAP and IFRS
Standards. John Wiley & Sons.
Sheedy, E.A., Griffin, B. and Barbour, J.P., 2017. A framework and measure for examining risk
climate in financial institutions. Journal of Business and Psychology. 32(1). pp.101-116.
Secure Best Marks with AI Grader
Need help grading? Try our AI Grader for instant feedback on your assignments.
APPENDIX
Income statement:
Turnover 3 1,89,711
Less cost of sales:
Material Cost 42,597
Production Cost 15,231
Labour Cost 50,758
1,08,586
Gross profit 81,125
GP %
= 42.8
Less Expenses:
Administrative expenses 13,751
Other operating overheads 22,374
Interest 1,943
Total Overheads 4 38068
Profit/(loss) for the financial
year 43057 NP%= 22.7
Balance sheet:
2016
Total
£0
Non Current assets
Intangible assets 5,793
Tangible assets 52,812
Investments 10,693
69,298
Current assets
Stocks 28,571
Trade debtors 26,367
Short term deposits 14,779
Cash at bank and in
hand 14,632
84,349
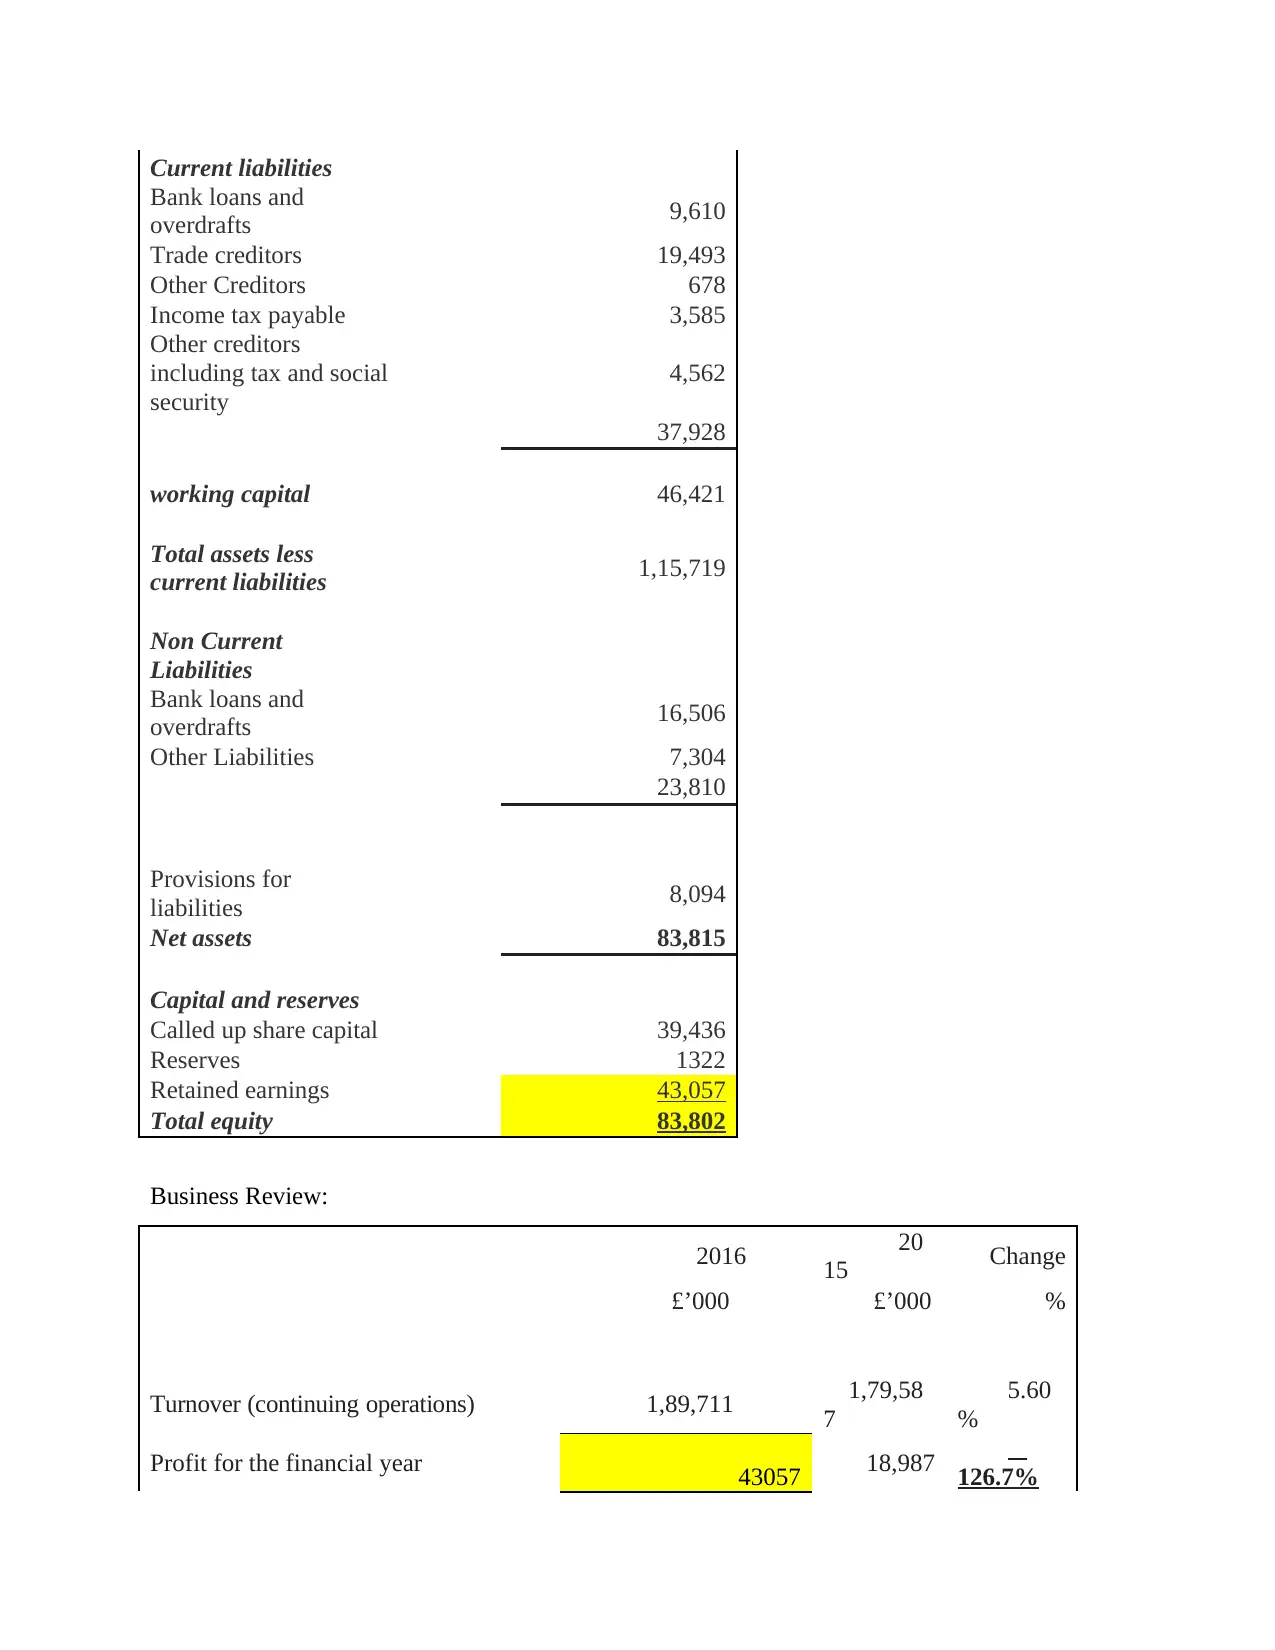
Current liabilities
Bank loans and
overdrafts 9,610
Trade creditors 19,493
Other Creditors 678
Income tax payable 3,585
Other creditors
including tax and social
security
4,562
37,928
working capital 46,421
Total assets less
current liabilities 1,15,719
Non Current
Liabilities
Bank loans and
overdrafts 16,506
Other Liabilities 7,304
23,810
Provisions for
liabilities 8,094
Net assets 83,815
Capital and reserves
Called up share capital 39,436
Reserves 1322
Retained earnings 43,057
Total equity 83,802
Business Review:
2016 20
15 Change
£’000 £’000 %
Turnover (continuing operations) 1,89,711 1,79,58
7
5.60
%
Profit for the financial year 43057 18,987 126.7%
Bank loans and
overdrafts 9,610
Trade creditors 19,493
Other Creditors 678
Income tax payable 3,585
Other creditors
including tax and social
security
4,562
37,928
working capital 46,421
Total assets less
current liabilities 1,15,719
Non Current
Liabilities
Bank loans and
overdrafts 16,506
Other Liabilities 7,304
23,810
Provisions for
liabilities 8,094
Net assets 83,815
Capital and reserves
Called up share capital 39,436
Reserves 1322
Retained earnings 43,057
Total equity 83,802
Business Review:
2016 20
15 Change
£’000 £’000 %
Turnover (continuing operations) 1,89,711 1,79,58
7
5.60
%
Profit for the financial year 43057 18,987 126.7%
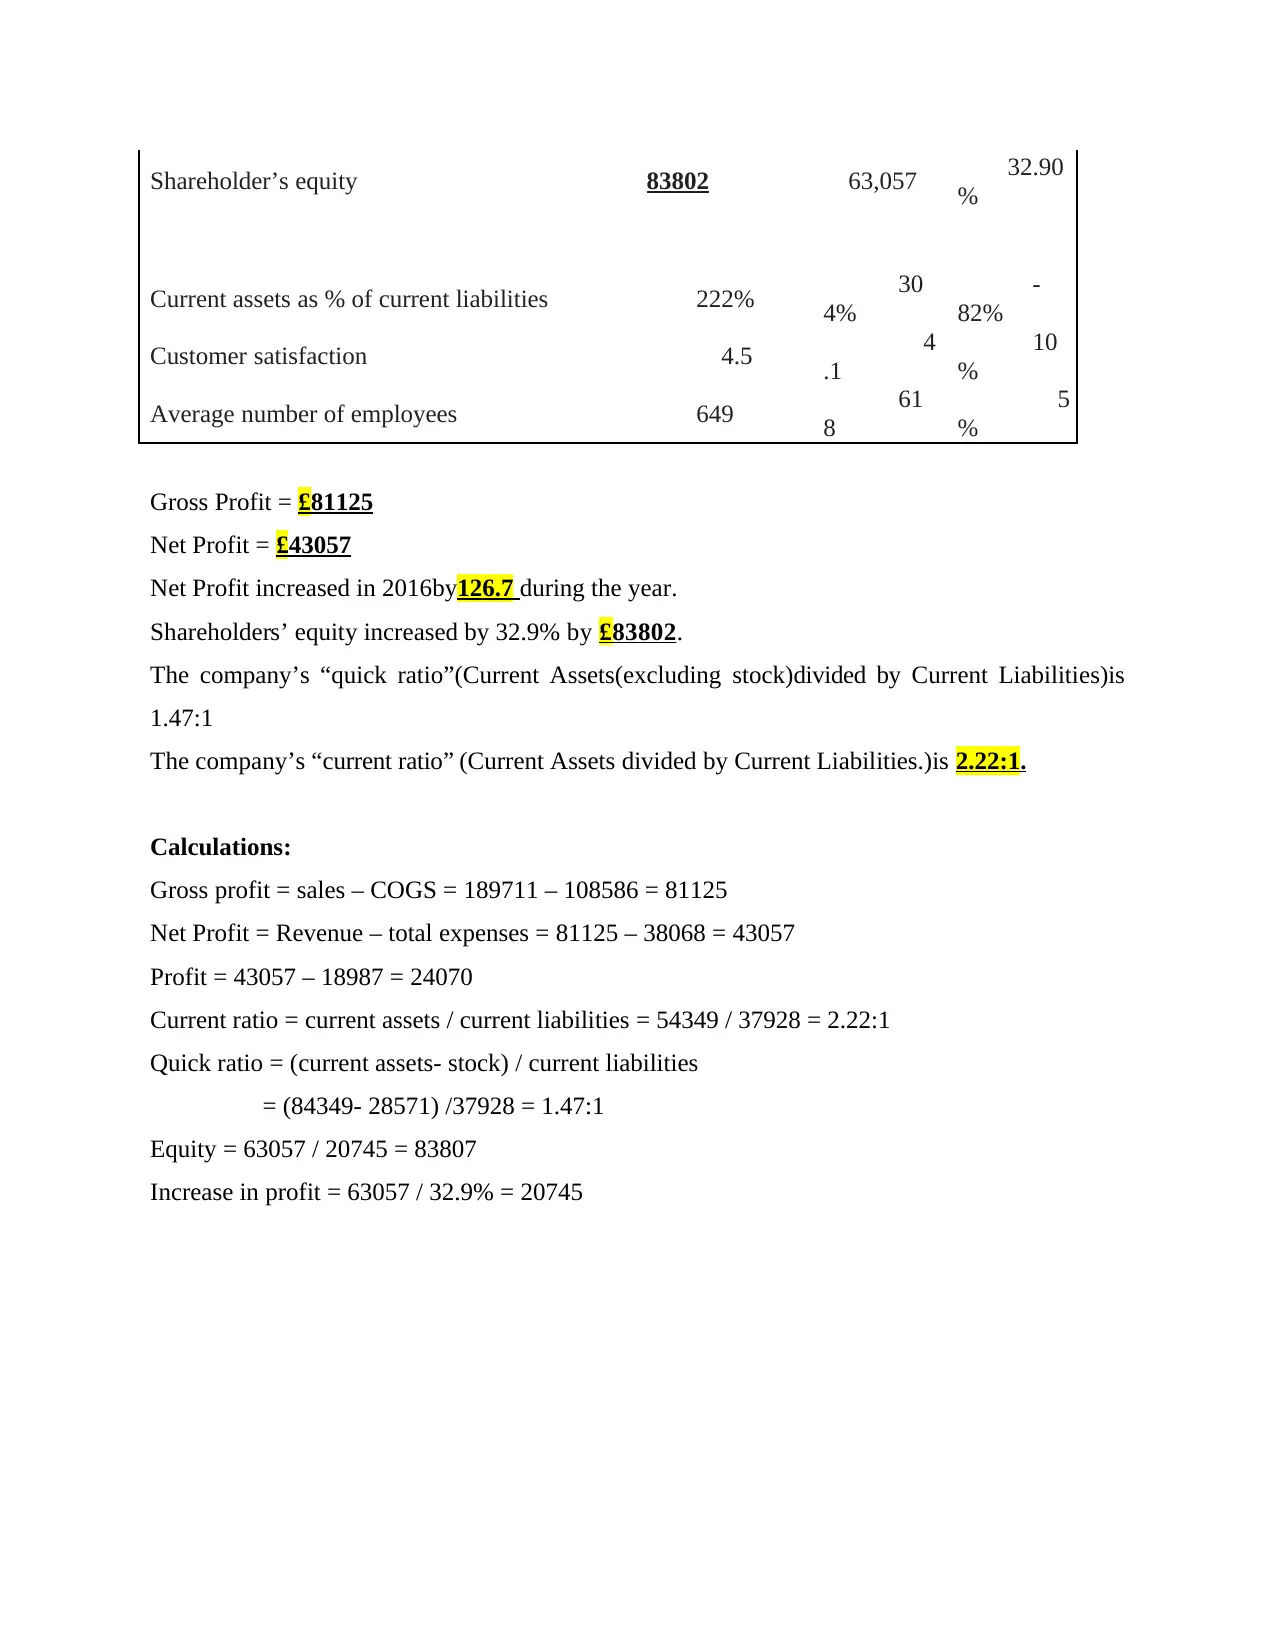
Shareholder’s equity 83802 63,057 32.90
%
Current assets as % of current liabilities 222% 30
4%
-
82%
Customer satisfaction 4.5 4
.1
10
%
Average number of employees 649 61
8
5
%
Gross Profit = £81125
Net Profit = £43057
Net Profit increased in 2016by126.7 during the year.
Shareholders’ equity increased by 32.9% by £83802.
The company’s “quick ratio”(Current Assets(excluding stock)divided by Current Liabilities)is
1.47:1
The company’s “current ratio” (Current Assets divided by Current Liabilities.)is 2.22:1.
Calculations:
Gross profit = sales – COGS = 189711 – 108586 = 81125
Net Profit = Revenue – total expenses = 81125 – 38068 = 43057
Profit = 43057 – 18987 = 24070
Current ratio = current assets / current liabilities = 54349 / 37928 = 2.22:1
Quick ratio = (current assets- stock) / current liabilities
= (84349- 28571) /37928 = 1.47:1
Equity = 63057 / 20745 = 83807
Increase in profit = 63057 / 32.9% = 20745
%
Current assets as % of current liabilities 222% 30
4%
-
82%
Customer satisfaction 4.5 4
.1
10
%
Average number of employees 649 61
8
5
%
Gross Profit = £81125
Net Profit = £43057
Net Profit increased in 2016by126.7 during the year.
Shareholders’ equity increased by 32.9% by £83802.
The company’s “quick ratio”(Current Assets(excluding stock)divided by Current Liabilities)is
1.47:1
The company’s “current ratio” (Current Assets divided by Current Liabilities.)is 2.22:1.
Calculations:
Gross profit = sales – COGS = 189711 – 108586 = 81125
Net Profit = Revenue – total expenses = 81125 – 38068 = 43057
Profit = 43057 – 18987 = 24070
Current ratio = current assets / current liabilities = 54349 / 37928 = 2.22:1
Quick ratio = (current assets- stock) / current liabilities
= (84349- 28571) /37928 = 1.47:1
Equity = 63057 / 20745 = 83807
Increase in profit = 63057 / 32.9% = 20745
1 out of 13
Related Documents


Your All-in-One AI-Powered Toolkit for Academic Success.
+13062052269
info@desklib.com
Available 24*7 on WhatsApp / Email
![[object Object]](/_next/static/media/star-bottom.7253800d.svg)
Unlock your academic potential
© 2024 | Zucol Services PVT LTD | All rights reserved.