Comprehensive Analysis: Measurement Systems, Fits, Errors, Instruments
VerifiedAdded on 2023/06/12
|13
|3303
|128
Homework Assignment
AI Summary
This assignment solution covers fundamental concepts of measurement systems, including types of fits (clearance, interference, and transition), definitions of precision, accuracy, and uncertainty, and the differences between repeatability and reproducibility. It also details various types of errors in measurement, such as gross, systematic, and random errors. Furthermore, the solution explains tolerance and its classification, illustrates a measurement system block diagram with explanations of each element, and describes different types of instruments based on input signals and measurement quantities. The sensitivity of an instrument is also discussed, accompanied by a practical example involving a platinum resistance thermometer. Desklib offers this and many other solved assignments for students seeking comprehensive study resources.
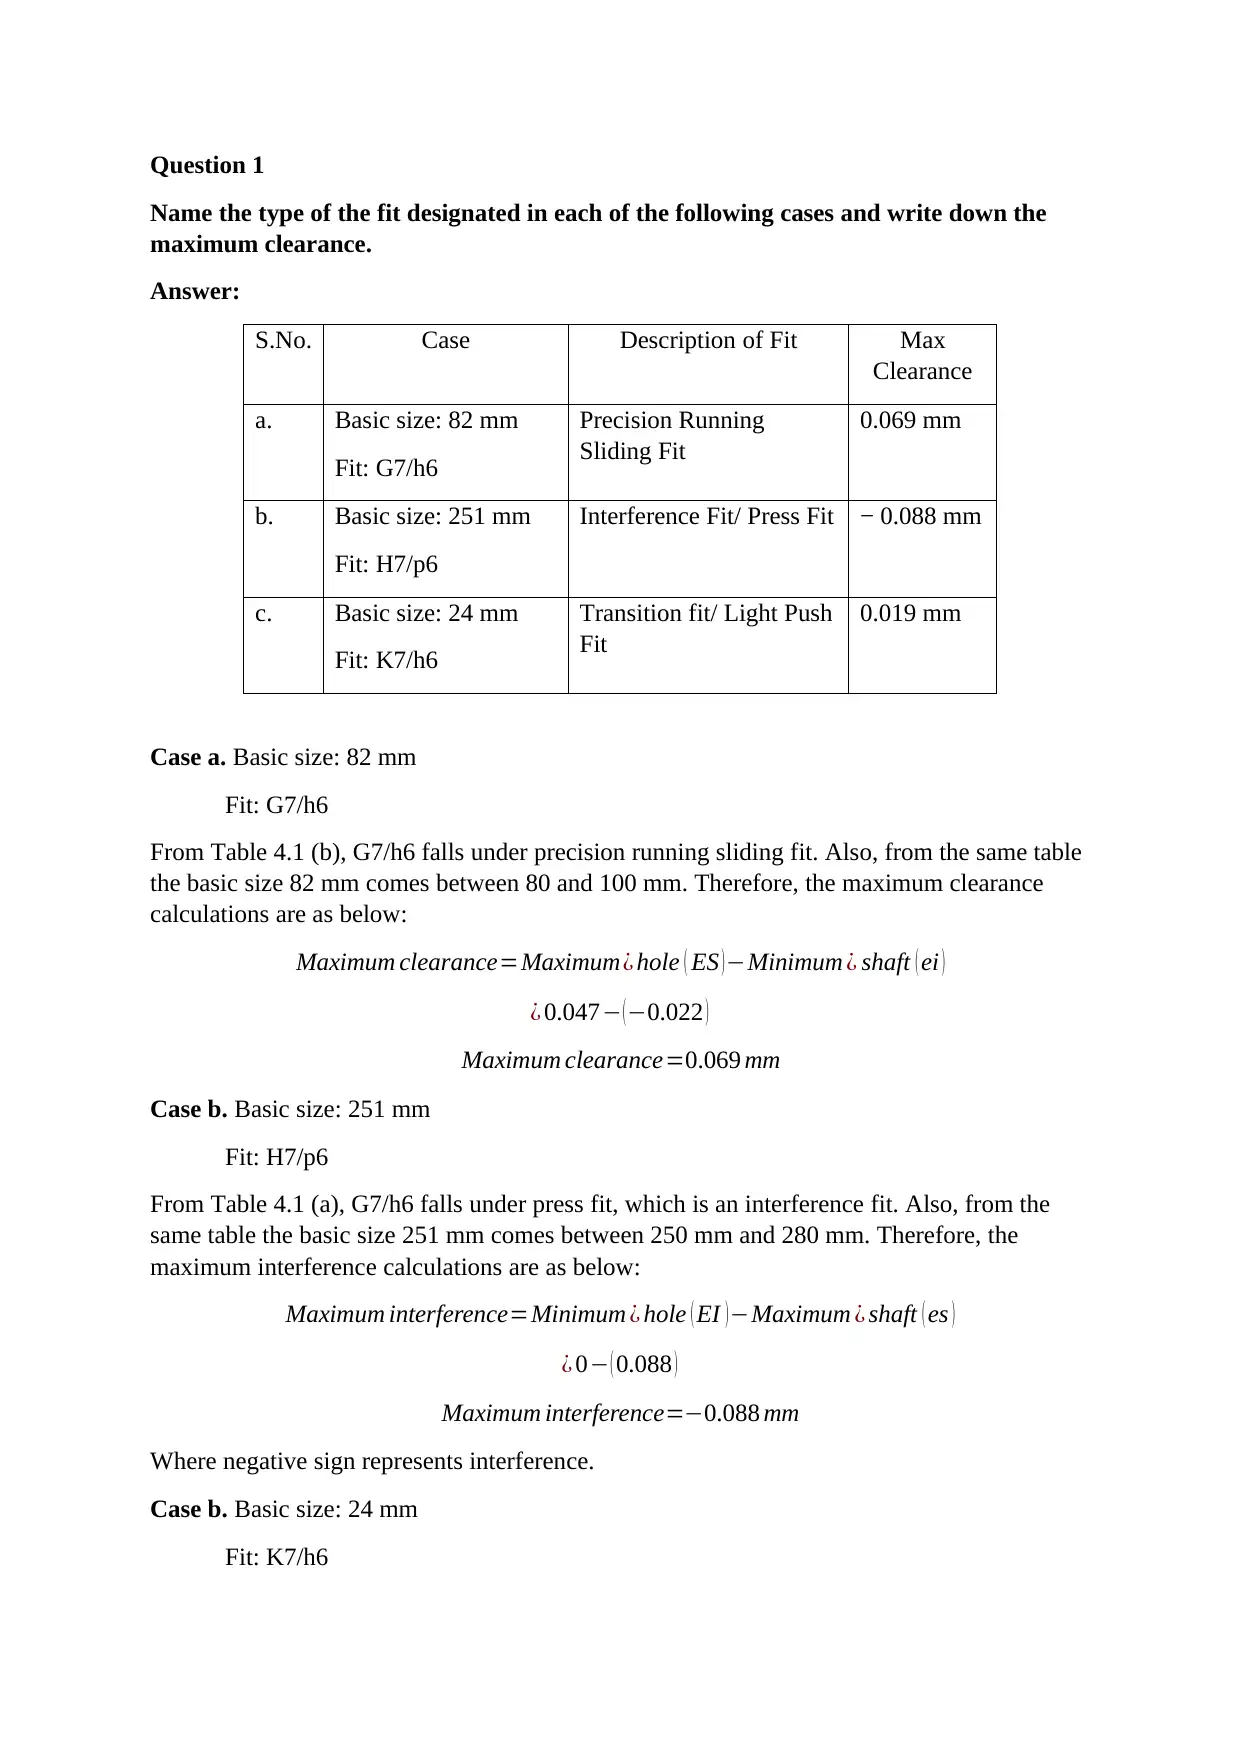
Question 1
Name the type of the fit designated in each of the following cases and write down the
maximum clearance.
Answer:
S.No. Case Description of Fit Max
Clearance
a. Basic size: 82 mm
Fit: G7/h6
Precision Running
Sliding Fit
0.069 mm
b. Basic size: 251 mm
Fit: H7/p6
Interference Fit/ Press Fit − 0.088 mm
c. Basic size: 24 mm
Fit: K7/h6
Transition fit/ Light Push
Fit
0.019 mm
Case a. Basic size: 82 mm
Fit: G7/h6
From Table 4.1 (b), G7/h6 falls under precision running sliding fit. Also, from the same table
the basic size 82 mm comes between 80 and 100 mm. Therefore, the maximum clearance
calculations are as below:
Maximum clearance=Maximum¿ hole ( ES )−Minimum ¿ shaft ( ei )
¿ 0.047− (−0.022 )
Maximum clearance=0.069 mm
Case b. Basic size: 251 mm
Fit: H7/p6
From Table 4.1 (a), G7/h6 falls under press fit, which is an interference fit. Also, from the
same table the basic size 251 mm comes between 250 mm and 280 mm. Therefore, the
maximum interference calculations are as below:
Maximum interference=Minimum ¿ hole ( EI )−Maximum ¿ shaft ( es )
¿ 0− ( 0.088 )
Maximum interference=−0.088 mm
Where negative sign represents interference.
Case b. Basic size: 24 mm
Fit: K7/h6
Paraphrase This Document
Need a fresh take? Get an instant paraphrase of this document with our AI Paraphraser
From Table 4.1 (b), K7/h6 falls under push fit, which is an interference fit. Also, from the
same table the basic size 24 mm comes between 18 mm and 30 mm. Therefore, the maximum
clearance calculations are as below:
Maximum clearance=Maximum¿ hole ( ES )−Minimum ¿ shaft ( ei )
¿ 0.006− (−0.013 )
Maximum clearance=0.019 mm
Question 2
Define precision, accuracy and uncertainty.
Answer:
Precision: In measurements, precision refers to the exactness of two or more consecutive
readings to each other. An instrument with good precision will have less statistical variations.
Accuracy: It represents the conformity of a measured value of an instrument with the
standard or true value of the instrument.
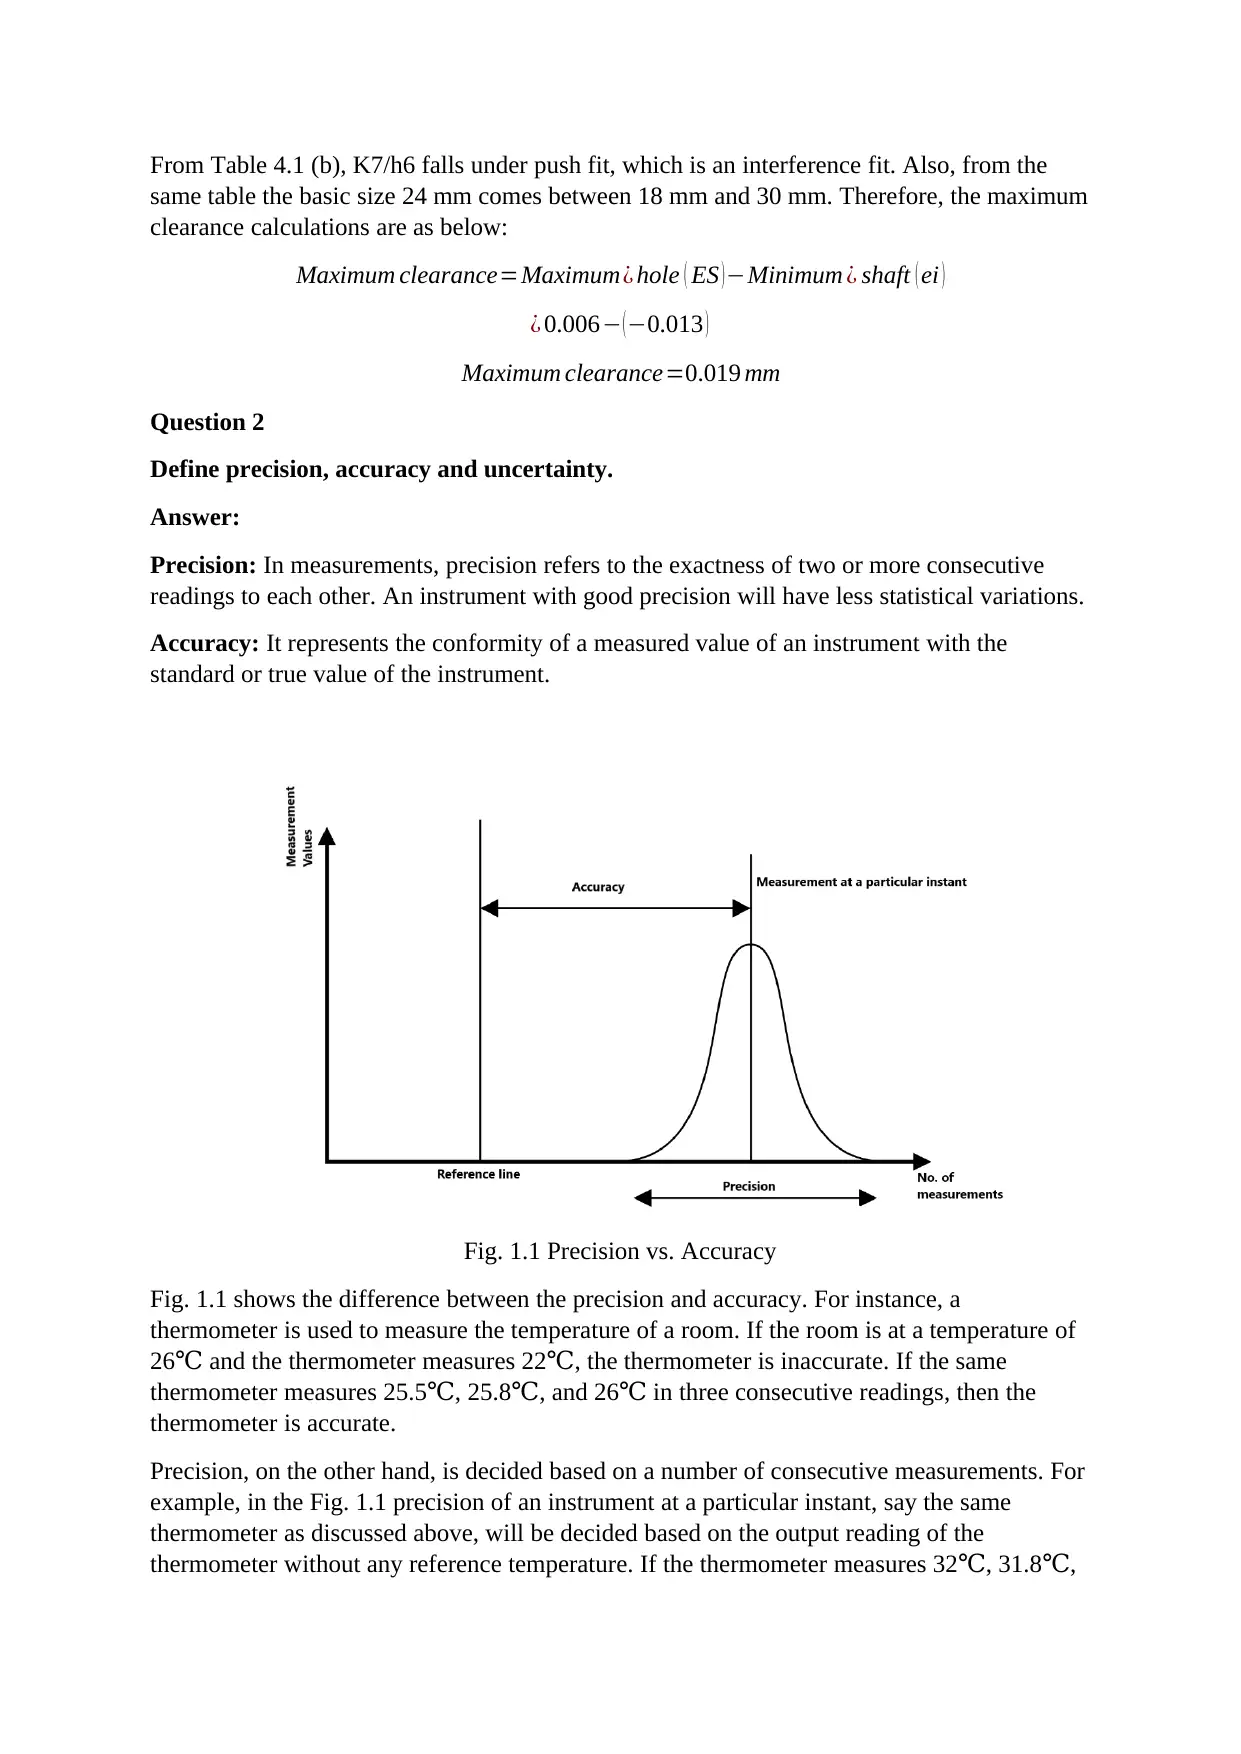
Fig. 1.1 Precision vs. Accuracy
Fig. 1.1 shows the difference between the precision and accuracy. For instance, a
thermometer is used to measure the temperature of a room. If the room is at a temperature of
26 and the thermometer measures 22 , the thermometer is inaccurate. If the same℃ ℃
thermometer measures 25.5 , 25.8 , and 26 in three consecutive readings, then the℃ ℃ ℃
thermometer is accurate.
Precision, on the other hand, is decided based on a number of consecutive measurements. For
example, in the Fig. 1.1 precision of an instrument at a particular instant, say the same
thermometer as discussed above, will be decided based on the output reading of the
thermometer without any reference temperature. If the thermometer measures 32 , 31.8 ,℃ ℃
same table the basic size 24 mm comes between 18 mm and 30 mm. Therefore, the maximum
clearance calculations are as below:
Maximum clearance=Maximum¿ hole ( ES )−Minimum ¿ shaft ( ei )
¿ 0.006− (−0.013 )
Maximum clearance=0.019 mm
Question 2
Define precision, accuracy and uncertainty.
Answer:
Precision: In measurements, precision refers to the exactness of two or more consecutive
readings to each other. An instrument with good precision will have less statistical variations.
Accuracy: It represents the conformity of a measured value of an instrument with the
standard or true value of the instrument.
Fig. 1.1 Precision vs. Accuracy
Fig. 1.1 shows the difference between the precision and accuracy. For instance, a
thermometer is used to measure the temperature of a room. If the room is at a temperature of
26 and the thermometer measures 22 , the thermometer is inaccurate. If the same℃ ℃
thermometer measures 25.5 , 25.8 , and 26 in three consecutive readings, then the℃ ℃ ℃
thermometer is accurate.
Precision, on the other hand, is decided based on a number of consecutive measurements. For
example, in the Fig. 1.1 precision of an instrument at a particular instant, say the same
thermometer as discussed above, will be decided based on the output reading of the
thermometer without any reference temperature. If the thermometer measures 32 , 31.8 ,℃ ℃
and 31.5 respectively, the thermometer is precise for a temperature of 32 . But the℃ ℃
thermometer is not accurate as the actual temperature is 26 .℃
Uncertainty: The aim of any measuring instrument is to measure values that are close to the
refence reading or true value obtained through certain experiments. But, due to real-world
conditions such as resistance in the electronic circuits, hysteresis, etc., the measured values
deviate from the true value. The deviation is limited by a range of values with true value as
the reference. This limit containing a range of values is called uncertainty of the
measurement.
Generally, the uncertainty is measured using techniques such as standard deviation and
probability.
Question 3
Explain the difference between reproducibility and repeatability.
Answer:
Repeatability: It is the term used to estimate the precision of an instrument when the
techniques, equipment, operator, conditions, and specimens used for the measurements are
identical.
Reproducibility: It is the term used to estimate the precision of an instrument when the same
techniques and specimens, but a different operator, equipment, and conditions are used for
the measurements.
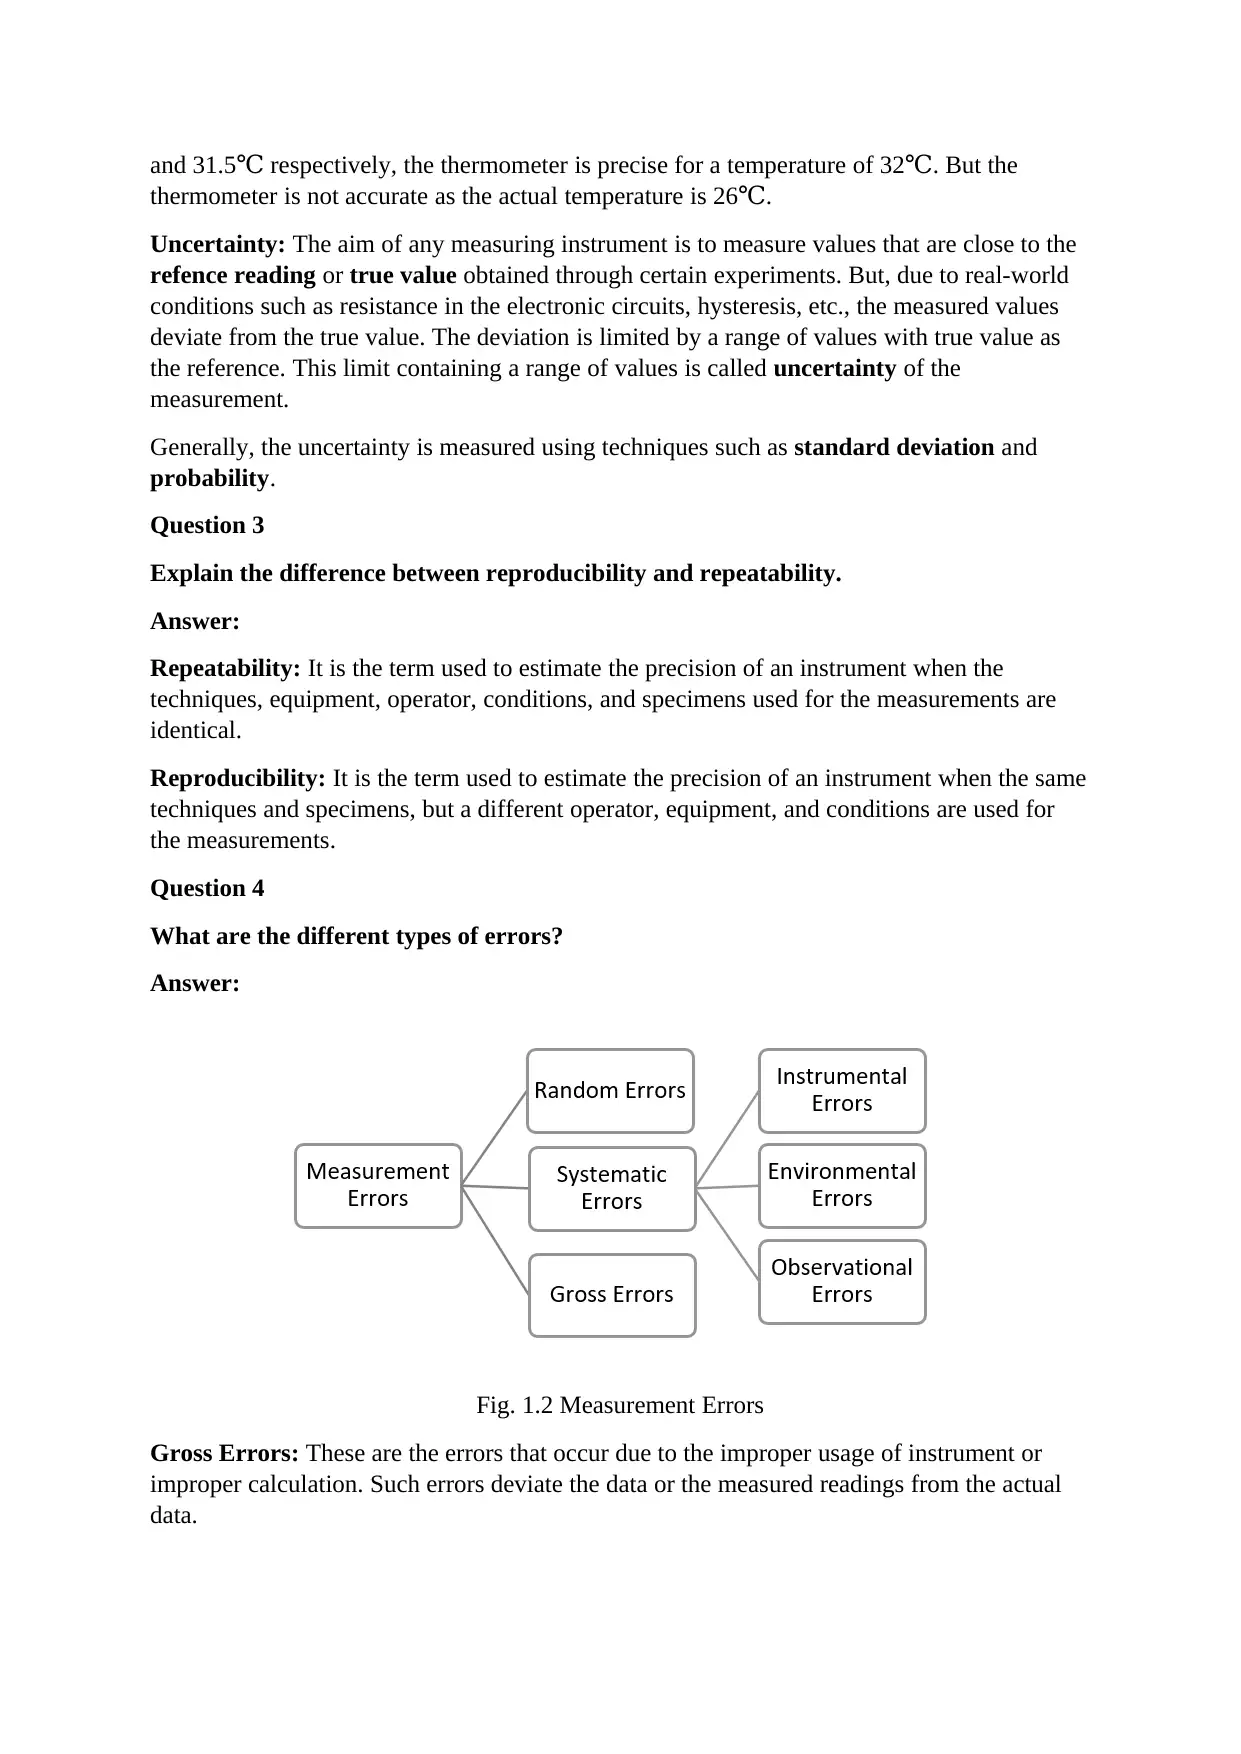
Question 4
What are the different types of errors?
Answer:
Fig. 1.2 Measurement Errors
Gross Errors: These are the errors that occur due to the improper usage of instrument or
improper calculation. Such errors deviate the data or the measured readings from the actual
data.
thermometer is not accurate as the actual temperature is 26 .℃
Uncertainty: The aim of any measuring instrument is to measure values that are close to the
refence reading or true value obtained through certain experiments. But, due to real-world
conditions such as resistance in the electronic circuits, hysteresis, etc., the measured values
deviate from the true value. The deviation is limited by a range of values with true value as
the reference. This limit containing a range of values is called uncertainty of the
measurement.
Generally, the uncertainty is measured using techniques such as standard deviation and
probability.
Question 3
Explain the difference between reproducibility and repeatability.
Answer:
Repeatability: It is the term used to estimate the precision of an instrument when the
techniques, equipment, operator, conditions, and specimens used for the measurements are
identical.
Reproducibility: It is the term used to estimate the precision of an instrument when the same
techniques and specimens, but a different operator, equipment, and conditions are used for
the measurements.
Question 4
What are the different types of errors?
Answer:
Fig. 1.2 Measurement Errors
Gross Errors: These are the errors that occur due to the improper usage of instrument or
improper calculation. Such errors deviate the data or the measured readings from the actual
data.
⊘ This is a preview!⊘
Do you want full access?
Subscribe today to unlock all pages.
Trusted by 1+ million students worldwide
Systematic errors: These are the measurement errors that arise from the instrument itself
due to malfunction, environmental effects, and observation of the operator. Based on these
effects, the system errors classified as below:
1. Instrumental errors
2. Environmental errors
3. Observational errors
Random Errors: These are the errors that are present in the instrument due to unknown
reasons, unlike gross and systematic errors. These errors are cannot be completely removed
from the instrument.
Question 5
What is tolerance? Explain clearance, interference, and transitional fits.
Answer:
Tolerance: It refers to the maximum permissible variation in measurements from the true
value. Tolerance is based on the hole and shaft measurements and mathematically, it is the
difference between the upper and lower limits of a measurement. Based on the measurement
direction, tolerance is classified as unilateral and bilateral.
The limits obtained from tolerance are used to decide the type of fit required for a hole and
shaft assembly. The term fit refers to the difference between the size of hole and shaft, and it
gives an idea of how loose or tight the joint or assembly should be. Based on the hole and
shaft basis system, the fits are classified into the following types:
1. Clearance fit: In this type of fit, the size of the hole is always greater than the size of
the shaft. Hence, there will always be clearance between two mating parts, in this case
the shaft and hole. Generally, clearance fit is the difference between the limits of the
hole and shaft. For clearance fit, the difference is always positive. The differences are
either minimum or maximum. Maximum difference is the difference between upper
limit of the hole and lower limit of the shaft. Similarly, he minimum clearance is the
difference is the difference between lower limit of the hole and upper limit of the
shaft. Clearance fit is further divided into the following typed:
a. Loose Fit
b. Running Fit
c. Sliding Fit
2. Interference fit: It is the type of fit in which the size of the hole is less than the size
of the shaft. Hence, the mating of the two parts does not occur. For this reason, the fit
is called interference fit. In interference fit, the difference between the limits of hole
and shaft is always negative. The difference between the lower limit of hole and upper
limit of shaft is the maximum interference. The difference between the maximum size
of hole and minimum size of shaft is the minimum interface. The interference fit is
further divide into the following types:
a. Shrink Fit or Heavy Force Fit
b. Medium Force Fit
c. Tight Fit or Press Fit
Paraphrase This Document
Need a fresh take? Get an instant paraphrase of this document with our AI Paraphraser
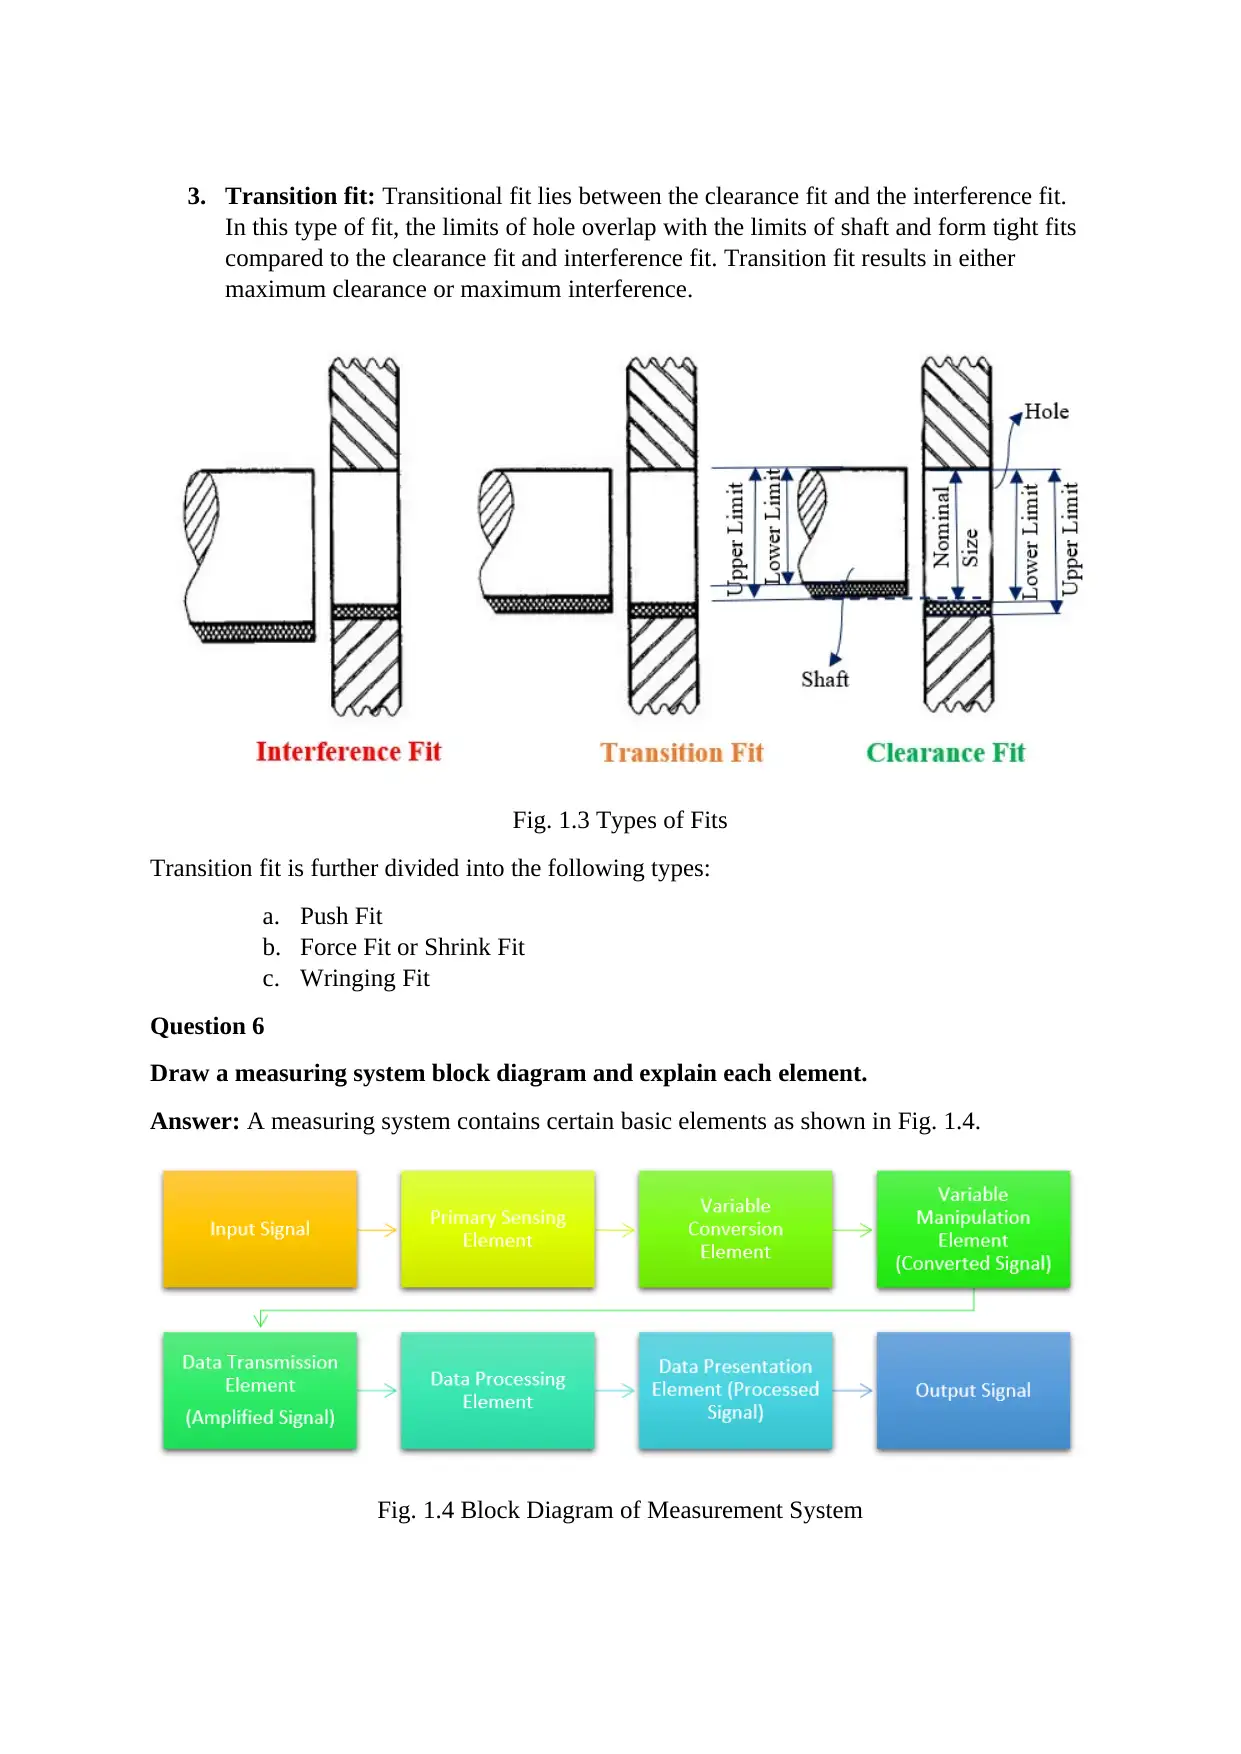
3. Transition fit: Transitional fit lies between the clearance fit and the interference fit.
In this type of fit, the limits of hole overlap with the limits of shaft and form tight fits
compared to the clearance fit and interference fit. Transition fit results in either
maximum clearance or maximum interference.
Fig. 1.3 Types of Fits
Transition fit is further divided into the following types:
a. Push Fit
b. Force Fit or Shrink Fit
c. Wringing Fit
Question 6
Draw a measuring system block diagram and explain each element.
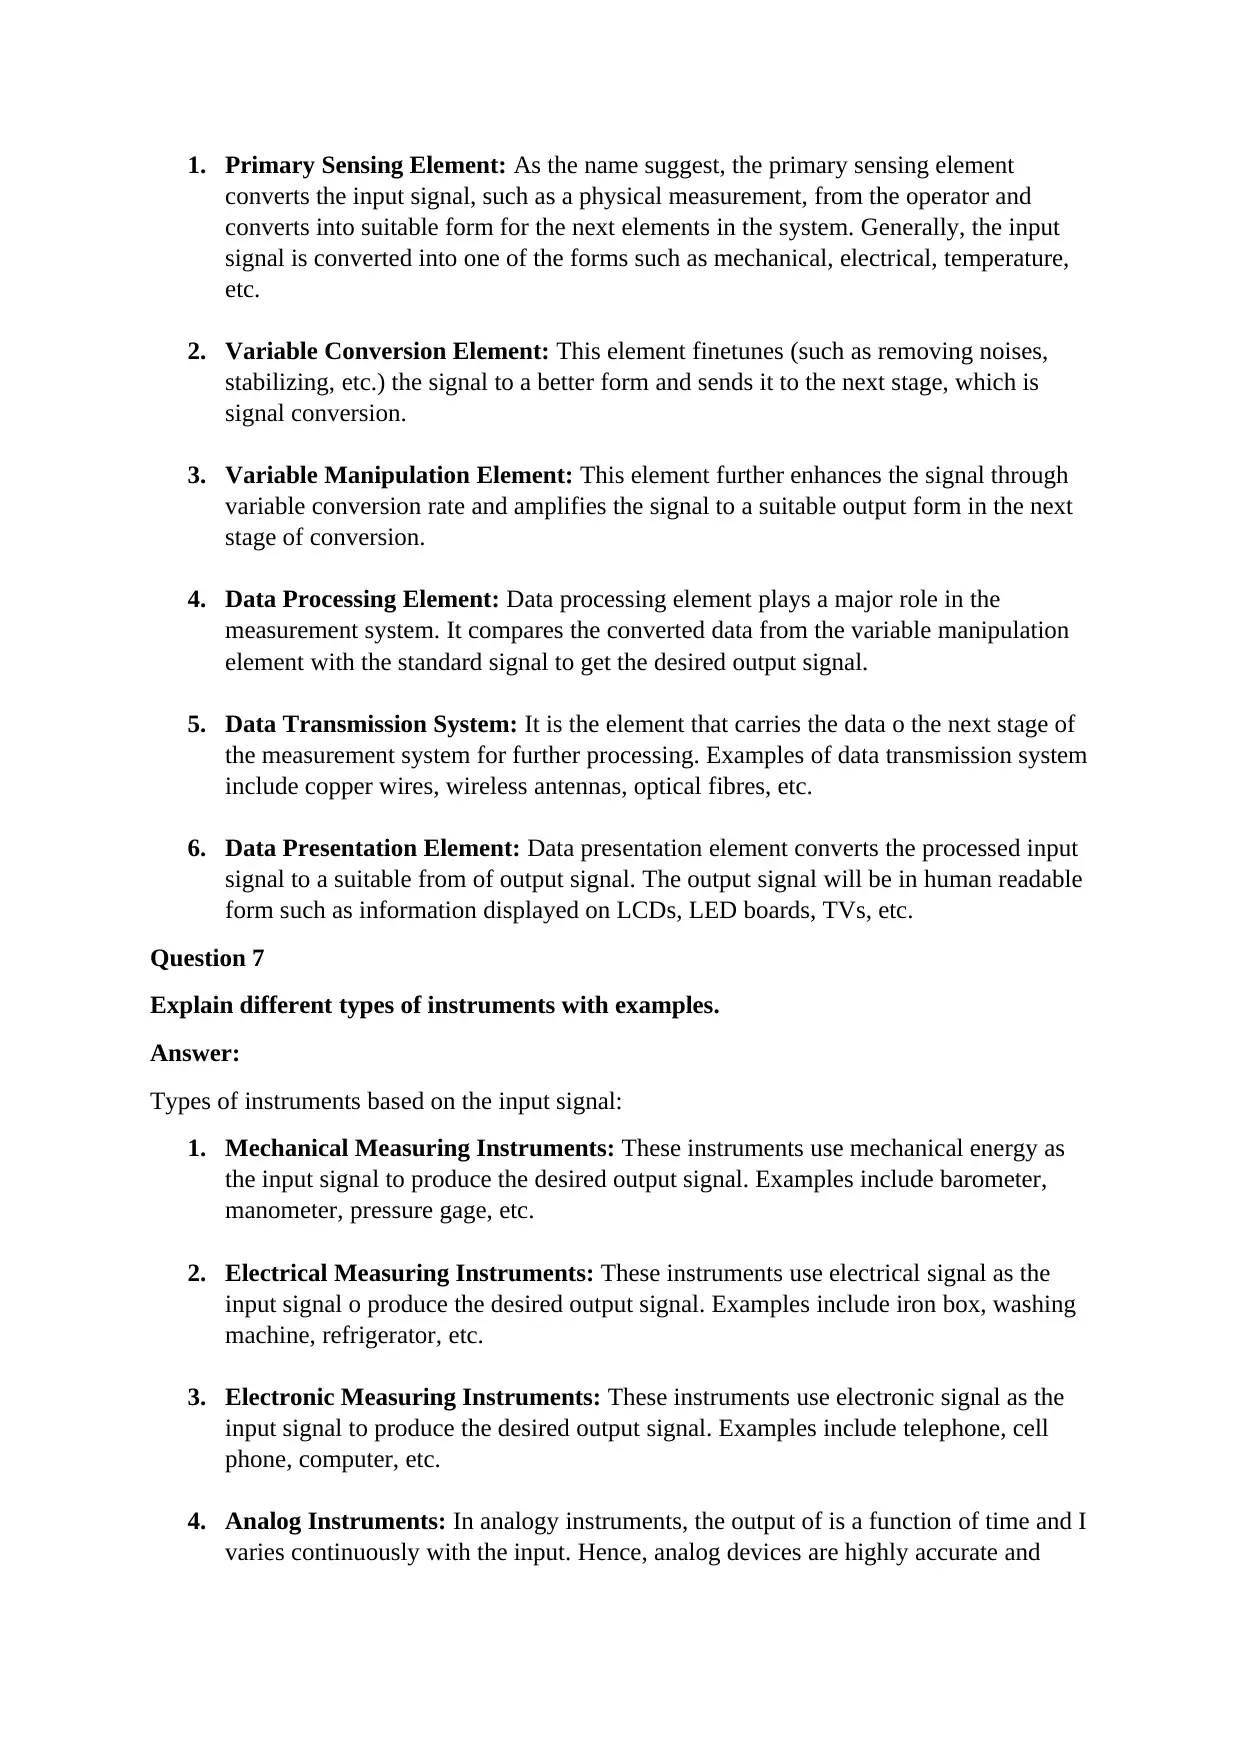
Answer: A measuring system contains certain basic elements as shown in Fig. 1.4.
Fig. 1.4 Block Diagram of Measurement System
In this type of fit, the limits of hole overlap with the limits of shaft and form tight fits
compared to the clearance fit and interference fit. Transition fit results in either
maximum clearance or maximum interference.
Fig. 1.3 Types of Fits
Transition fit is further divided into the following types:
a. Push Fit
b. Force Fit or Shrink Fit
c. Wringing Fit
Question 6
Draw a measuring system block diagram and explain each element.
Answer: A measuring system contains certain basic elements as shown in Fig. 1.4.
Fig. 1.4 Block Diagram of Measurement System
1. Primary Sensing Element: As the name suggest, the primary sensing element
converts the input signal, such as a physical measurement, from the operator and
converts into suitable form for the next elements in the system. Generally, the input
signal is converted into one of the forms such as mechanical, electrical, temperature,
etc.
2. Variable Conversion Element: This element finetunes (such as removing noises,
stabilizing, etc.) the signal to a better form and sends it to the next stage, which is
signal conversion.
3. Variable Manipulation Element: This element further enhances the signal through
variable conversion rate and amplifies the signal to a suitable output form in the next
stage of conversion.
4. Data Processing Element: Data processing element plays a major role in the
measurement system. It compares the converted data from the variable manipulation
element with the standard signal to get the desired output signal.
5. Data Transmission System: It is the element that carries the data o the next stage of
the measurement system for further processing. Examples of data transmission system
include copper wires, wireless antennas, optical fibres, etc.
6. Data Presentation Element: Data presentation element converts the processed input
signal to a suitable from of output signal. The output signal will be in human readable
form such as information displayed on LCDs, LED boards, TVs, etc.
Question 7
Explain different types of instruments with examples.
Answer:
Types of instruments based on the input signal:
1. Mechanical Measuring Instruments: These instruments use mechanical energy as
the input signal to produce the desired output signal. Examples include barometer,
manometer, pressure gage, etc.
2. Electrical Measuring Instruments: These instruments use electrical signal as the
input signal o produce the desired output signal. Examples include iron box, washing
machine, refrigerator, etc.
3. Electronic Measuring Instruments: These instruments use electronic signal as the
input signal to produce the desired output signal. Examples include telephone, cell
phone, computer, etc.
4. Analog Instruments: In analogy instruments, the output of is a function of time and I
varies continuously with the input. Hence, analog devices are highly accurate and
⊘ This is a preview!⊘
Do you want full access?
Subscribe today to unlock all pages.
Trusted by 1+ million students worldwide
sensitive to the input. These instruments can be electrical or non-electrical. Examples
include mechanical clock, governors in engines, telegraphs, and analog computers.
5. Digital Instruments: These instruments process data in discrete manner and the
output is in the form of binary digits, i.e., 0 and 1. The data is processed and displayed
in electronic devices such as computers, cell phones, etc. Digital devices require more
time to process the input signal and are less accurate compared to analog devices.
Types of instruments based on the quantity of signal being measured:
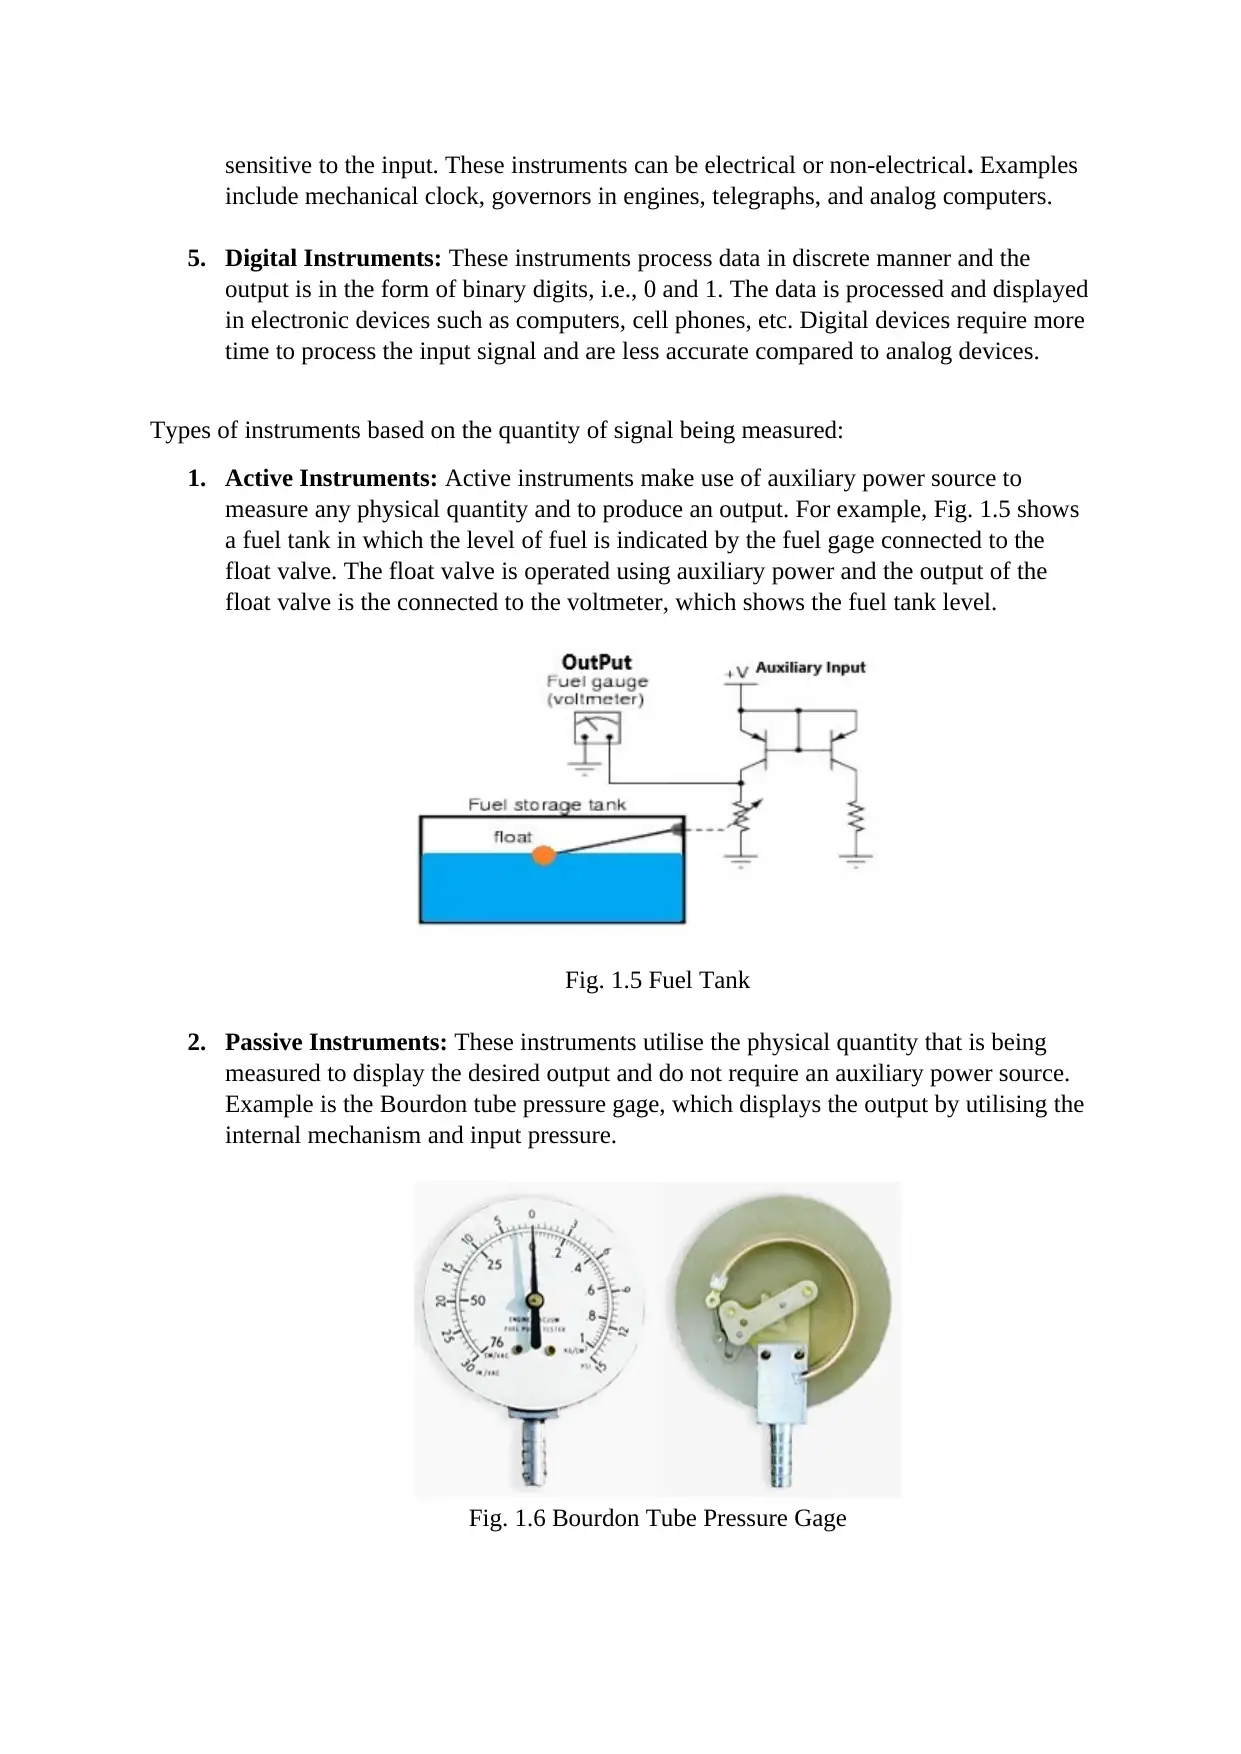
1. Active Instruments: Active instruments make use of auxiliary power source to
measure any physical quantity and to produce an output. For example, Fig. 1.5 shows
a fuel tank in which the level of fuel is indicated by the fuel gage connected to the
float valve. The float valve is operated using auxiliary power and the output of the
float valve is the connected to the voltmeter, which shows the fuel tank level.
Fig. 1.5 Fuel Tank
2. Passive Instruments: These instruments utilise the physical quantity that is being
measured to display the desired output and do not require an auxiliary power source.
Example is the Bourdon tube pressure gage, which displays the output by utilising the
internal mechanism and input pressure.
Fig. 1.6 Bourdon Tube Pressure Gage
include mechanical clock, governors in engines, telegraphs, and analog computers.
5. Digital Instruments: These instruments process data in discrete manner and the
output is in the form of binary digits, i.e., 0 and 1. The data is processed and displayed
in electronic devices such as computers, cell phones, etc. Digital devices require more
time to process the input signal and are less accurate compared to analog devices.
Types of instruments based on the quantity of signal being measured:
1. Active Instruments: Active instruments make use of auxiliary power source to
measure any physical quantity and to produce an output. For example, Fig. 1.5 shows
a fuel tank in which the level of fuel is indicated by the fuel gage connected to the
float valve. The float valve is operated using auxiliary power and the output of the
float valve is the connected to the voltmeter, which shows the fuel tank level.
Fig. 1.5 Fuel Tank
2. Passive Instruments: These instruments utilise the physical quantity that is being
measured to display the desired output and do not require an auxiliary power source.
Example is the Bourdon tube pressure gage, which displays the output by utilising the
internal mechanism and input pressure.
Fig. 1.6 Bourdon Tube Pressure Gage
Paraphrase This Document
Need a fresh take? Get an instant paraphrase of this document with our AI Paraphraser
Types of instruments based on the output signal:
1. Deflection-Type Instruments: These instruments use movement of a needle or
pointer to display the output of the input quantity. For instance, pressure gage
shown in Fig. 1.6 uses movement of a needle to display the amount of pressure
being measured.
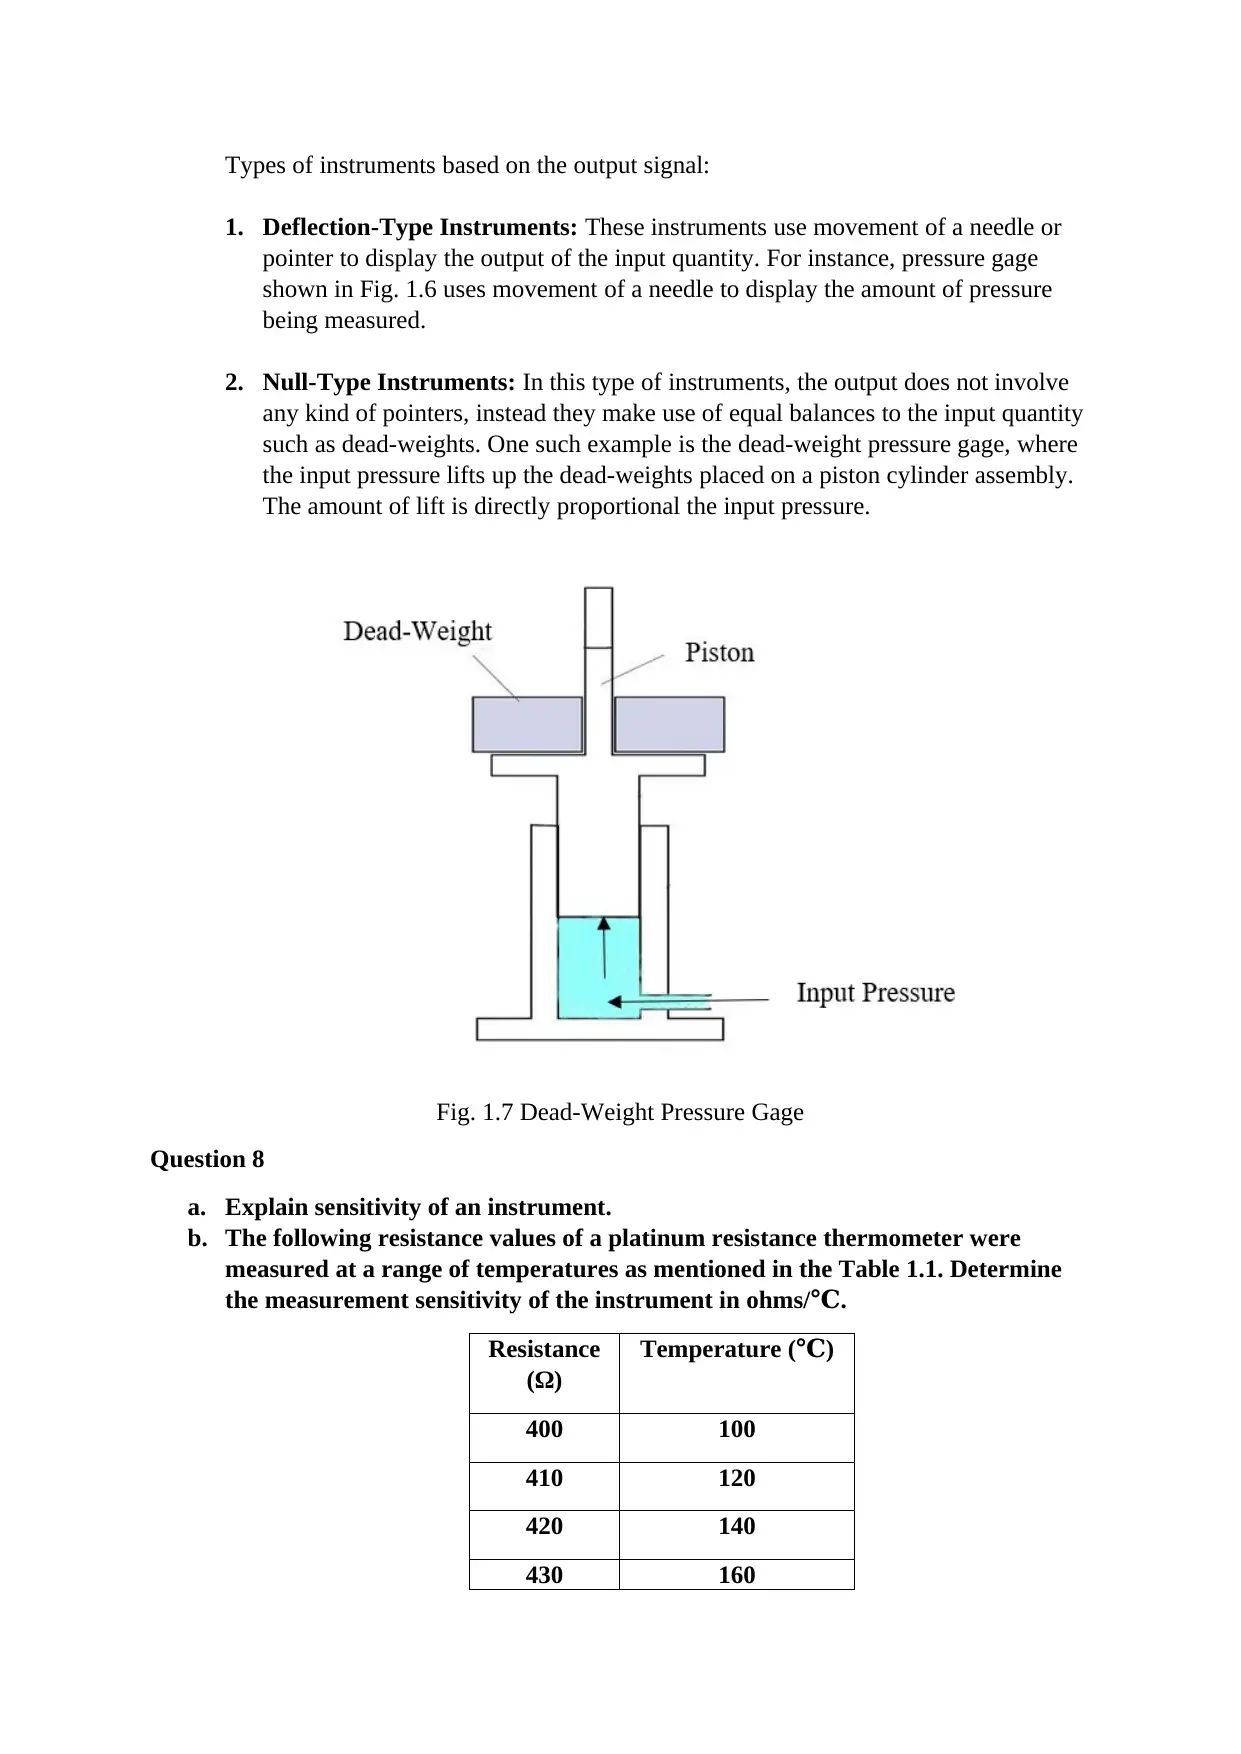
2. Null-Type Instruments: In this type of instruments, the output does not involve
any kind of pointers, instead they make use of equal balances to the input quantity
such as dead-weights. One such example is the dead-weight pressure gage, where
the input pressure lifts up the dead-weights placed on a piston cylinder assembly.
The amount of lift is directly proportional the input pressure.
Fig. 1.7 Dead-Weight Pressure Gage
Question 8
a. Explain sensitivity of an instrument.
b. The following resistance values of a platinum resistance thermometer were
measured at a range of temperatures as mentioned in the Table 1.1. Determine
the measurement sensitivity of the instrument in ohms/℃.
Resistance
(Ω)
Temperature ( )℃
400 100
410 120
420 140
430 160
1. Deflection-Type Instruments: These instruments use movement of a needle or
pointer to display the output of the input quantity. For instance, pressure gage
shown in Fig. 1.6 uses movement of a needle to display the amount of pressure
being measured.
2. Null-Type Instruments: In this type of instruments, the output does not involve
any kind of pointers, instead they make use of equal balances to the input quantity
such as dead-weights. One such example is the dead-weight pressure gage, where
the input pressure lifts up the dead-weights placed on a piston cylinder assembly.
The amount of lift is directly proportional the input pressure.
Fig. 1.7 Dead-Weight Pressure Gage
Question 8
a. Explain sensitivity of an instrument.
b. The following resistance values of a platinum resistance thermometer were
measured at a range of temperatures as mentioned in the Table 1.1. Determine
the measurement sensitivity of the instrument in ohms/℃.
Resistance
(Ω)
Temperature ( )℃
400 100
410 120
420 140
430 160
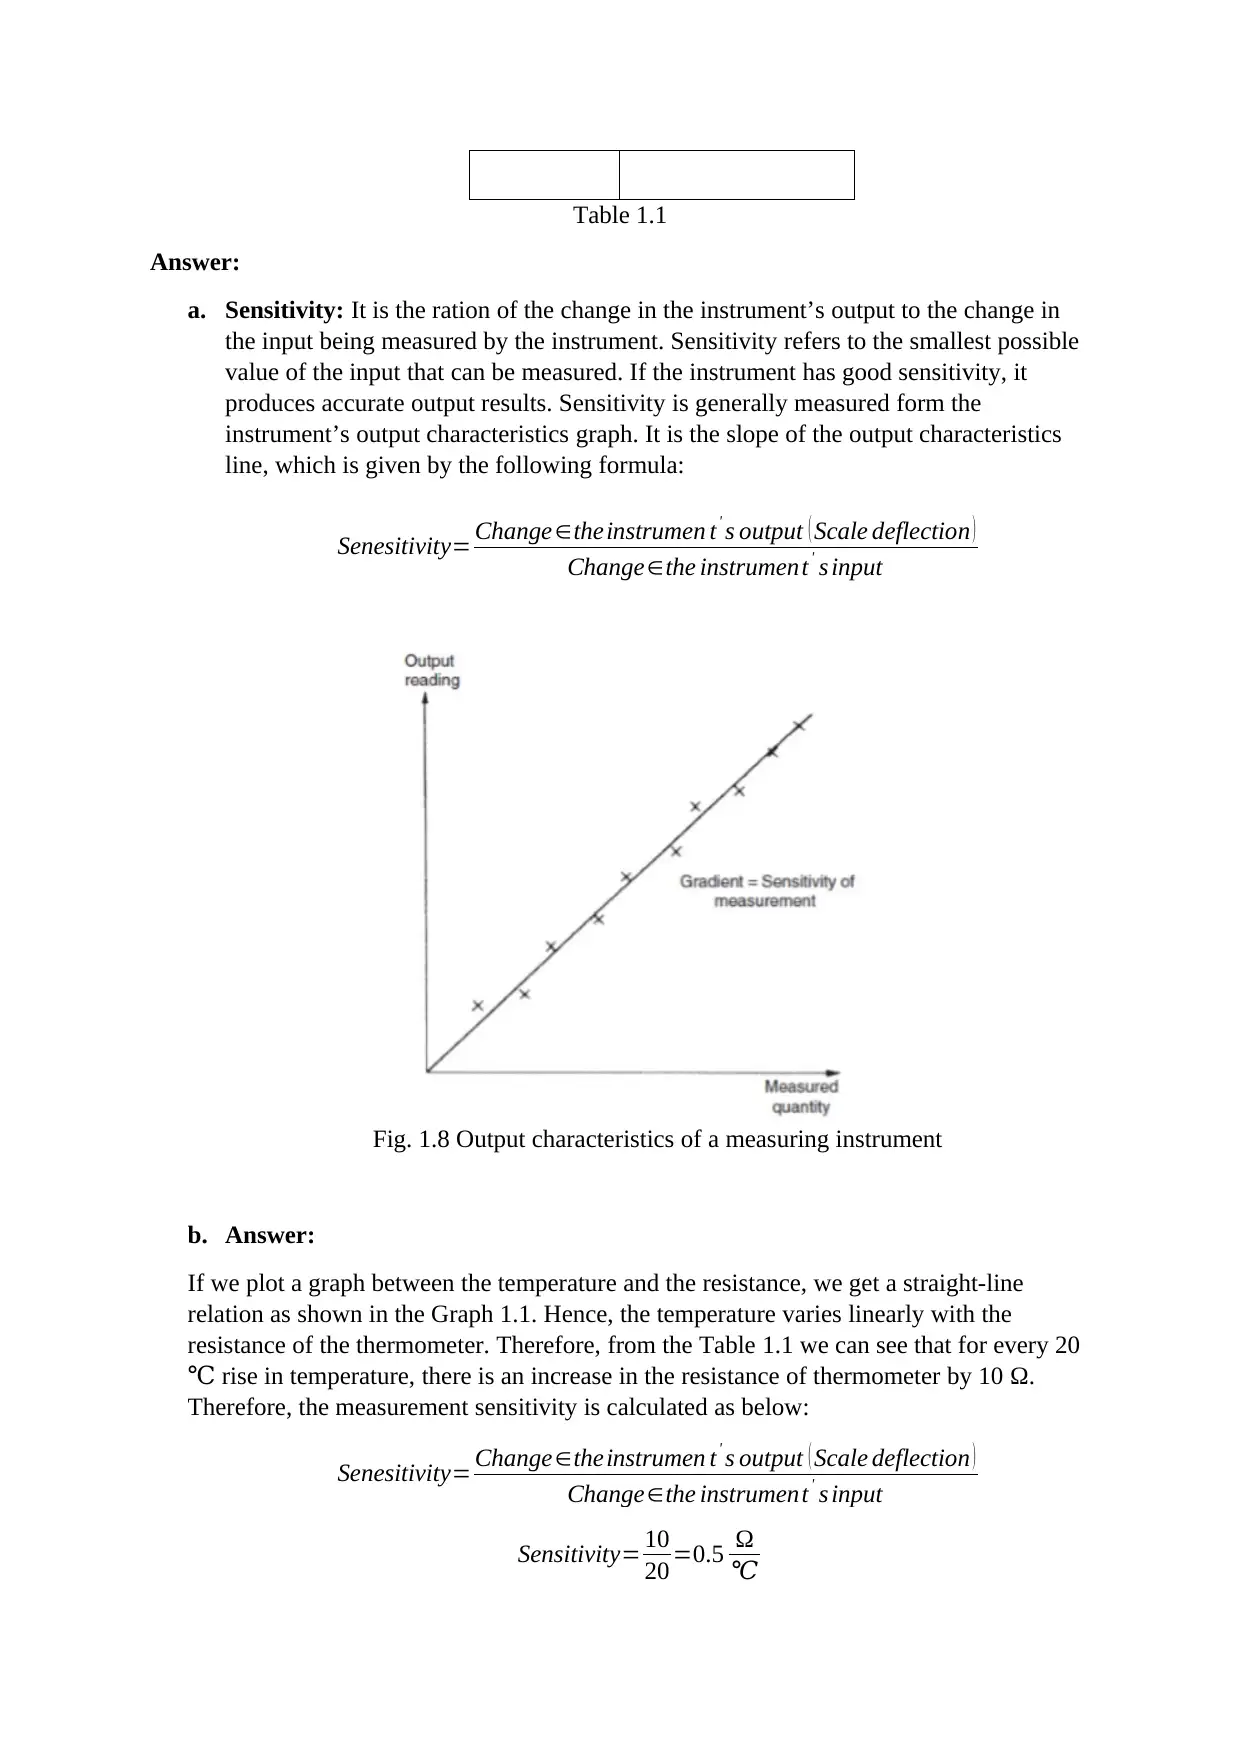
Table 1.1
Answer:
a. Sensitivity: It is the ration of the change in the instrument’s output to the change in
the input being measured by the instrument. Sensitivity refers to the smallest possible
value of the input that can be measured. If the instrument has good sensitivity, it
produces accurate output results. Sensitivity is generally measured form the
instrument’s output characteristics graph. It is the slope of the output characteristics
line, which is given by the following formula:
Senesitivity= Change∈theinstrumen t' s output ( Scale deflection )
Change∈the instrument' s input
Fig. 1.8 Output characteristics of a measuring instrument
b. Answer:
If we plot a graph between the temperature and the resistance, we get a straight-line
relation as shown in the Graph 1.1. Hence, the temperature varies linearly with the
resistance of the thermometer. Therefore, from the Table 1.1 we can see that for every 20
rise in temperature, there is an increase in the resistance of thermometer by 10℃ Ω.
Therefore, the measurement sensitivity is calculated as below:
Senesitivity= Change∈theinstrumen t' s output ( Scale deflection )
Change∈the instrument' s input
Sensitivity= 10
20 =0.5 Ω
℃
⊘ This is a preview!⊘
Do you want full access?
Subscribe today to unlock all pages.
Trusted by 1+ million students worldwide
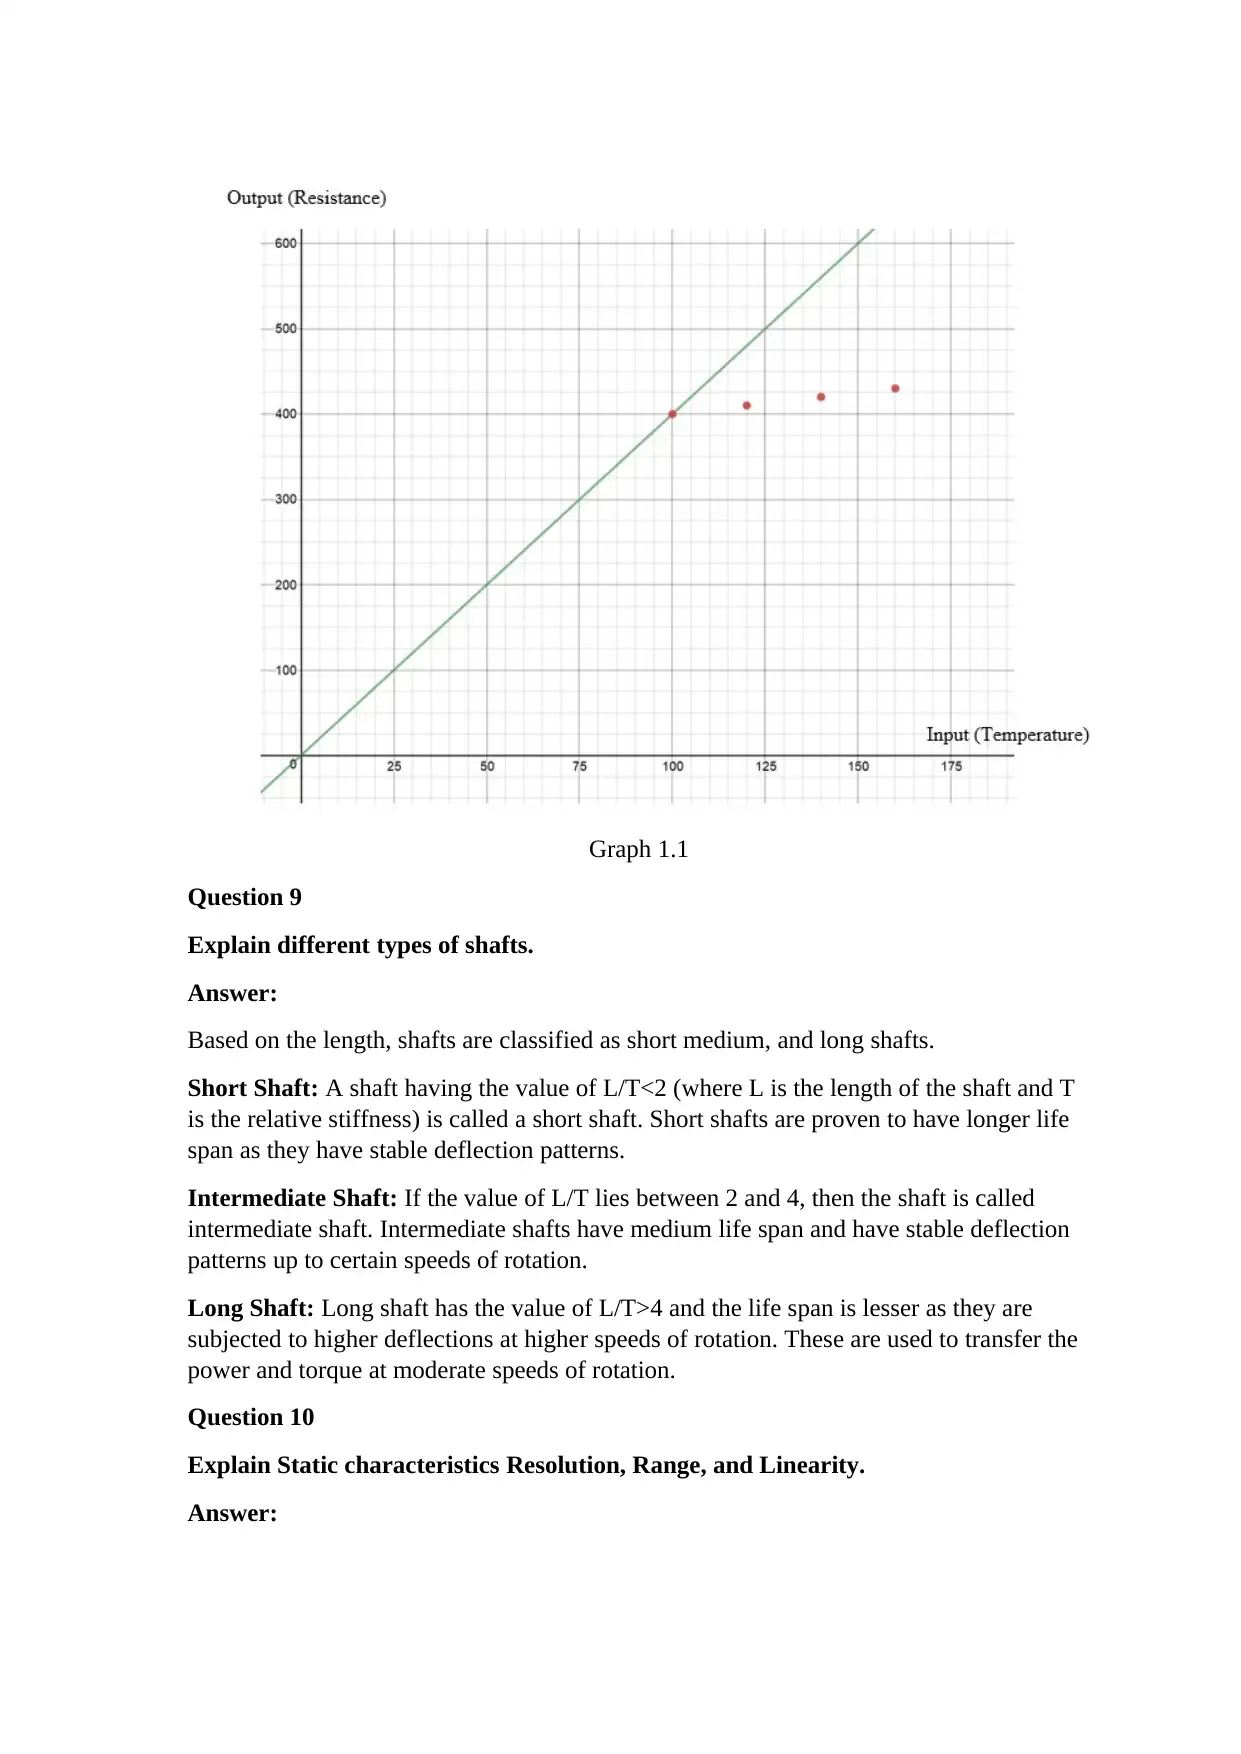
Graph 1.1
Question 9
Explain different types of shafts.
Answer:
Based on the length, shafts are classified as short medium, and long shafts.
Short Shaft: A shaft having the value of L/T<2 (where L is the length of the shaft and T
is the relative stiffness) is called a short shaft. Short shafts are proven to have longer life
span as they have stable deflection patterns.
Intermediate Shaft: If the value of L/T lies between 2 and 4, then the shaft is called
intermediate shaft. Intermediate shafts have medium life span and have stable deflection
patterns up to certain speeds of rotation.
Long Shaft: Long shaft has the value of L/T>4 and the life span is lesser as they are
subjected to higher deflections at higher speeds of rotation. These are used to transfer the
power and torque at moderate speeds of rotation.
Question 10
Explain Static characteristics Resolution, Range, and Linearity.
Answer:
Paraphrase This Document
Need a fresh take? Get an instant paraphrase of this document with our AI Paraphraser
Resolution: Resolution of an instrument refers to the smallest input value it can measure
to give an accurate output. For example, with a light microscope we can view particles of
200 nm (Nano meters). Hence, 200 nm is the resolution of the telescope.
Range: It is the range of values of a measuring instrument for which the instrument can
safely operate and produce accurate output results. For instance, the multimeter will have
a range of 0-20V. That means, the multimeter can safely operate between a voltage range
of 0-20V and produces accurate output.
Linearity: This characteristic of an instrument is desirable to maintain the linear
relationship between the input and the output measurements. Linearity also ensures the
consistency of measurements over a range of repeated experiments. For instance, Fig 1.8
shows output characteristics of an instrument for a range of measurements. The straight
line passing through various marks shows that the output readings are linear with the
input readings. The reduction in linearity is the sign of faulty components instrument or
the instrument itself.
Question 11
The instruments have been performed with the following results:
8.45, 8.49, 8.43, 8.41, 8.40, 8.49, 8.48,8.45,8.44,8.51. Calculate uncertainty.
Answer:
Average= 8.45+ 8.49+8.43+8.41+8.40+8.49+8.48+8.45+ 8.44+8.51
10
Average= 84.55
10 =8.455
Mean deviaion ¿ mean= 0.45+0.49+ 0.43+ 0.41+0.40+0.49+0.48+0.45+0.44+ 0.51
10
Mean deviaion ¿ mean= 4.55
10 =0.455
Therefore, the uncertainty of the measurement is as follows:
8.455−0.455 ≤ Measurement ≤ 8.455+0.455
8.0 ≤ Measurement ≤8.91
Question 12
The hole is assembled on the pin as shown in Fig. 1.9.
a) Determine the maximum and minimum distance X
b) The maximum and minimum distance between surfaces A and B
Answer:
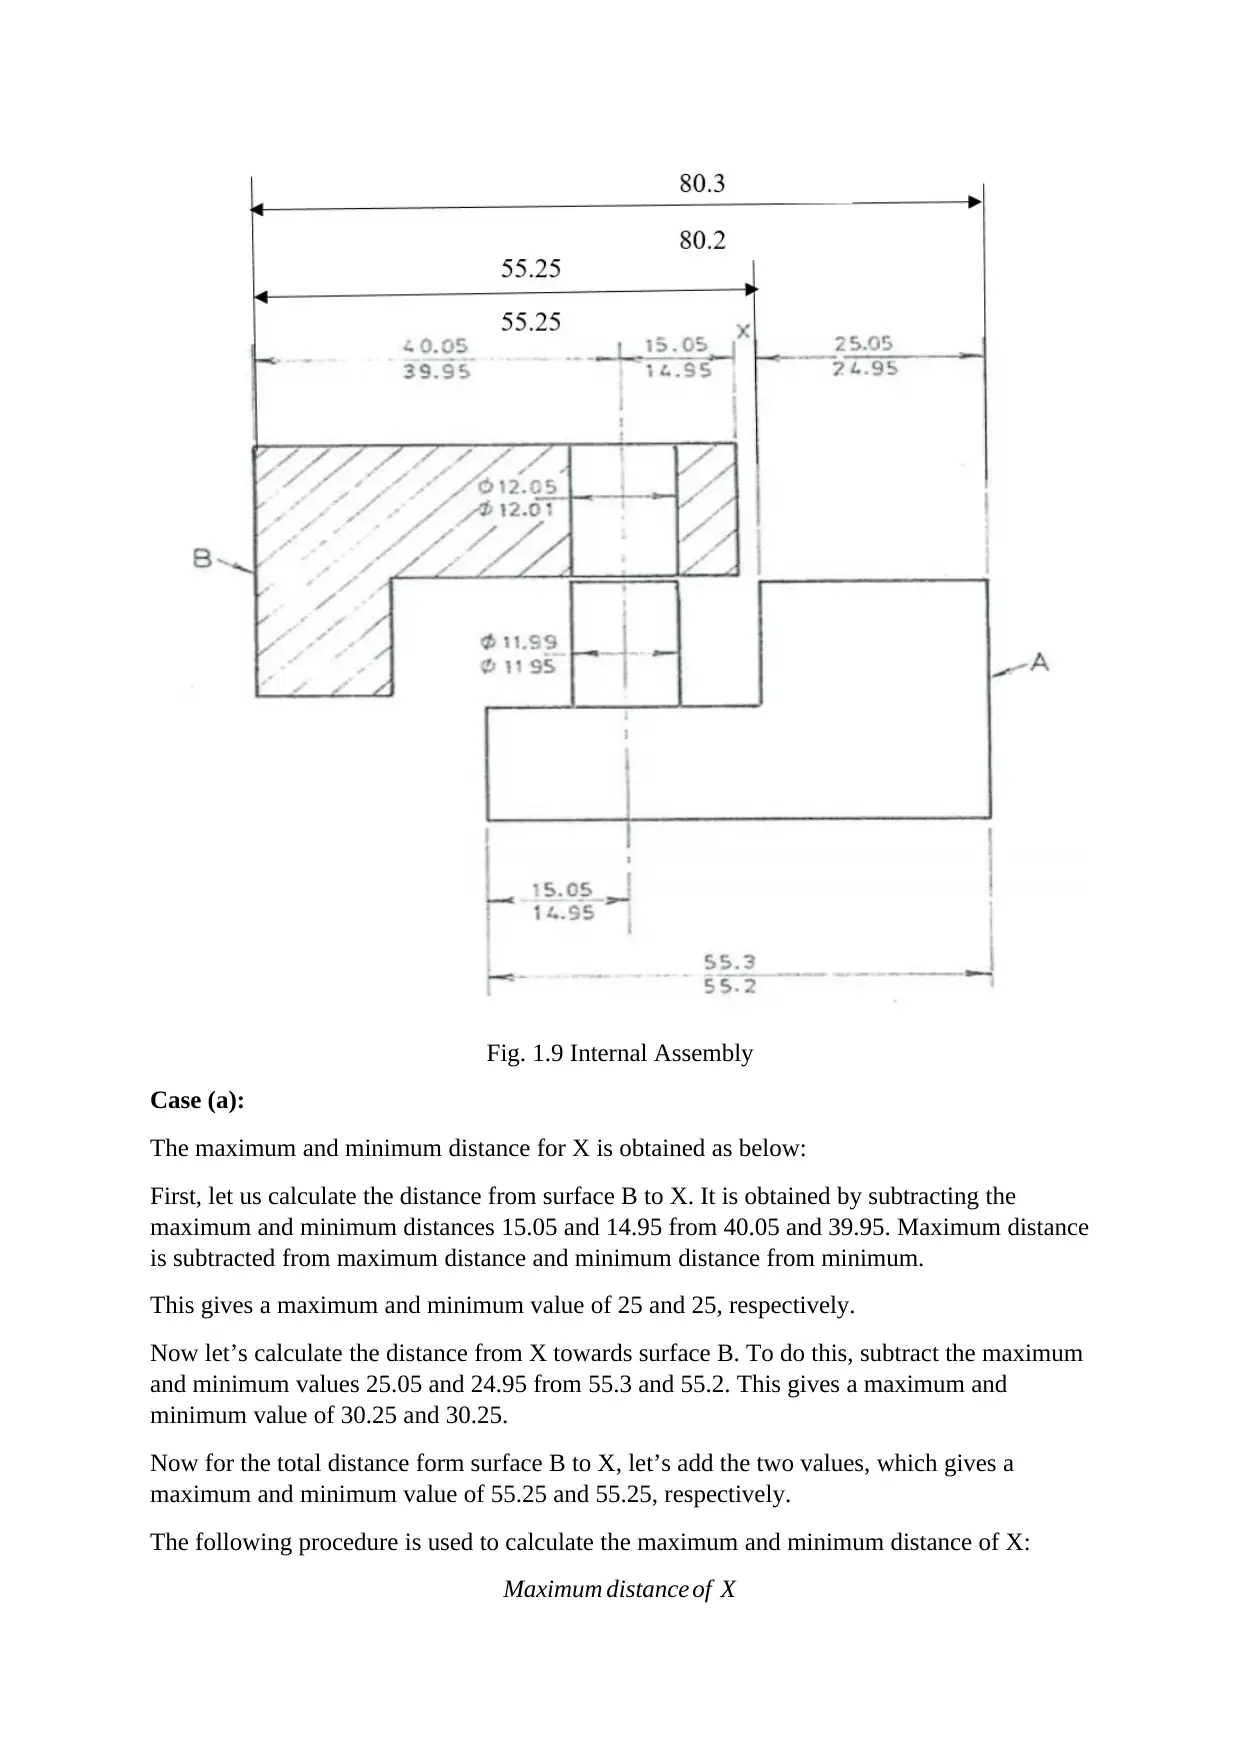
Fig. 1.9 Internal Assembly
Case (a):
The maximum and minimum distance for X is obtained as below:
First, let us calculate the distance from surface B to X. It is obtained by subtracting the
maximum and minimum distances 15.05 and 14.95 from 40.05 and 39.95. Maximum distance
is subtracted from maximum distance and minimum distance from minimum.
This gives a maximum and minimum value of 25 and 25, respectively.
Now let’s calculate the distance from X towards surface B. To do this, subtract the maximum
and minimum values 25.05 and 24.95 from 55.3 and 55.2. This gives a maximum and
minimum value of 30.25 and 30.25.
Now for the total distance form surface B to X, let’s add the two values, which gives a
maximum and minimum value of 55.25 and 55.25, respectively.
The following procedure is used to calculate the maximum and minimum distance of X:
Maximum distance of X
⊘ This is a preview!⊘
Do you want full access?
Subscribe today to unlock all pages.
Trusted by 1+ million students worldwide
1 out of 13
Your All-in-One AI-Powered Toolkit for Academic Success.
+13062052269
info@desklib.com
Available 24*7 on WhatsApp / Email
![[object Object]](/_next/static/media/star-bottom.7253800d.svg)
Unlock your academic potential
Copyright © 2020–2026 A2Z Services. All Rights Reserved. Developed and managed by ZUCOL.