RMIT BUSM4613 Project Plan: Website Development for Target Australia
VerifiedAdded on 2022/08/16
|23
|2955
|206
Project
AI Summary
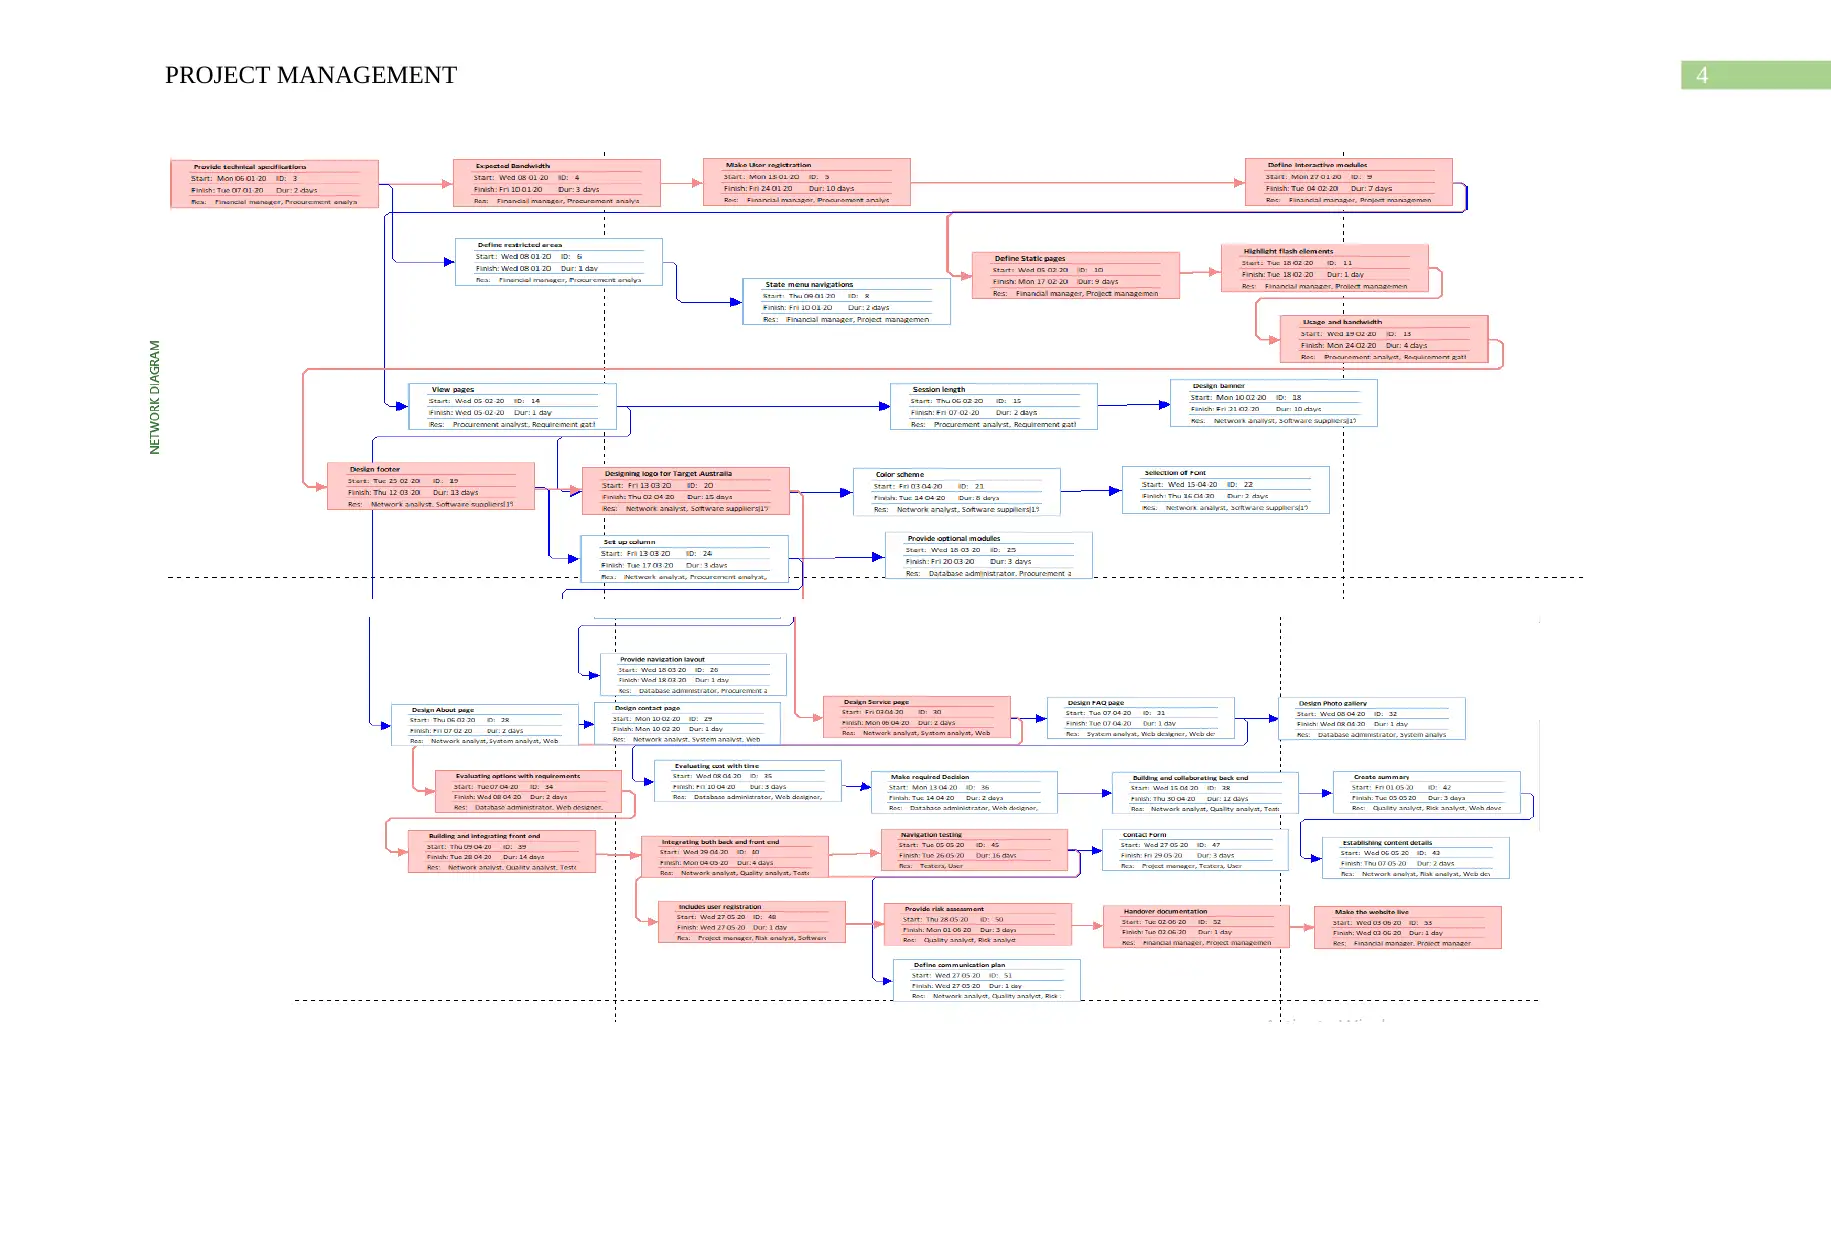
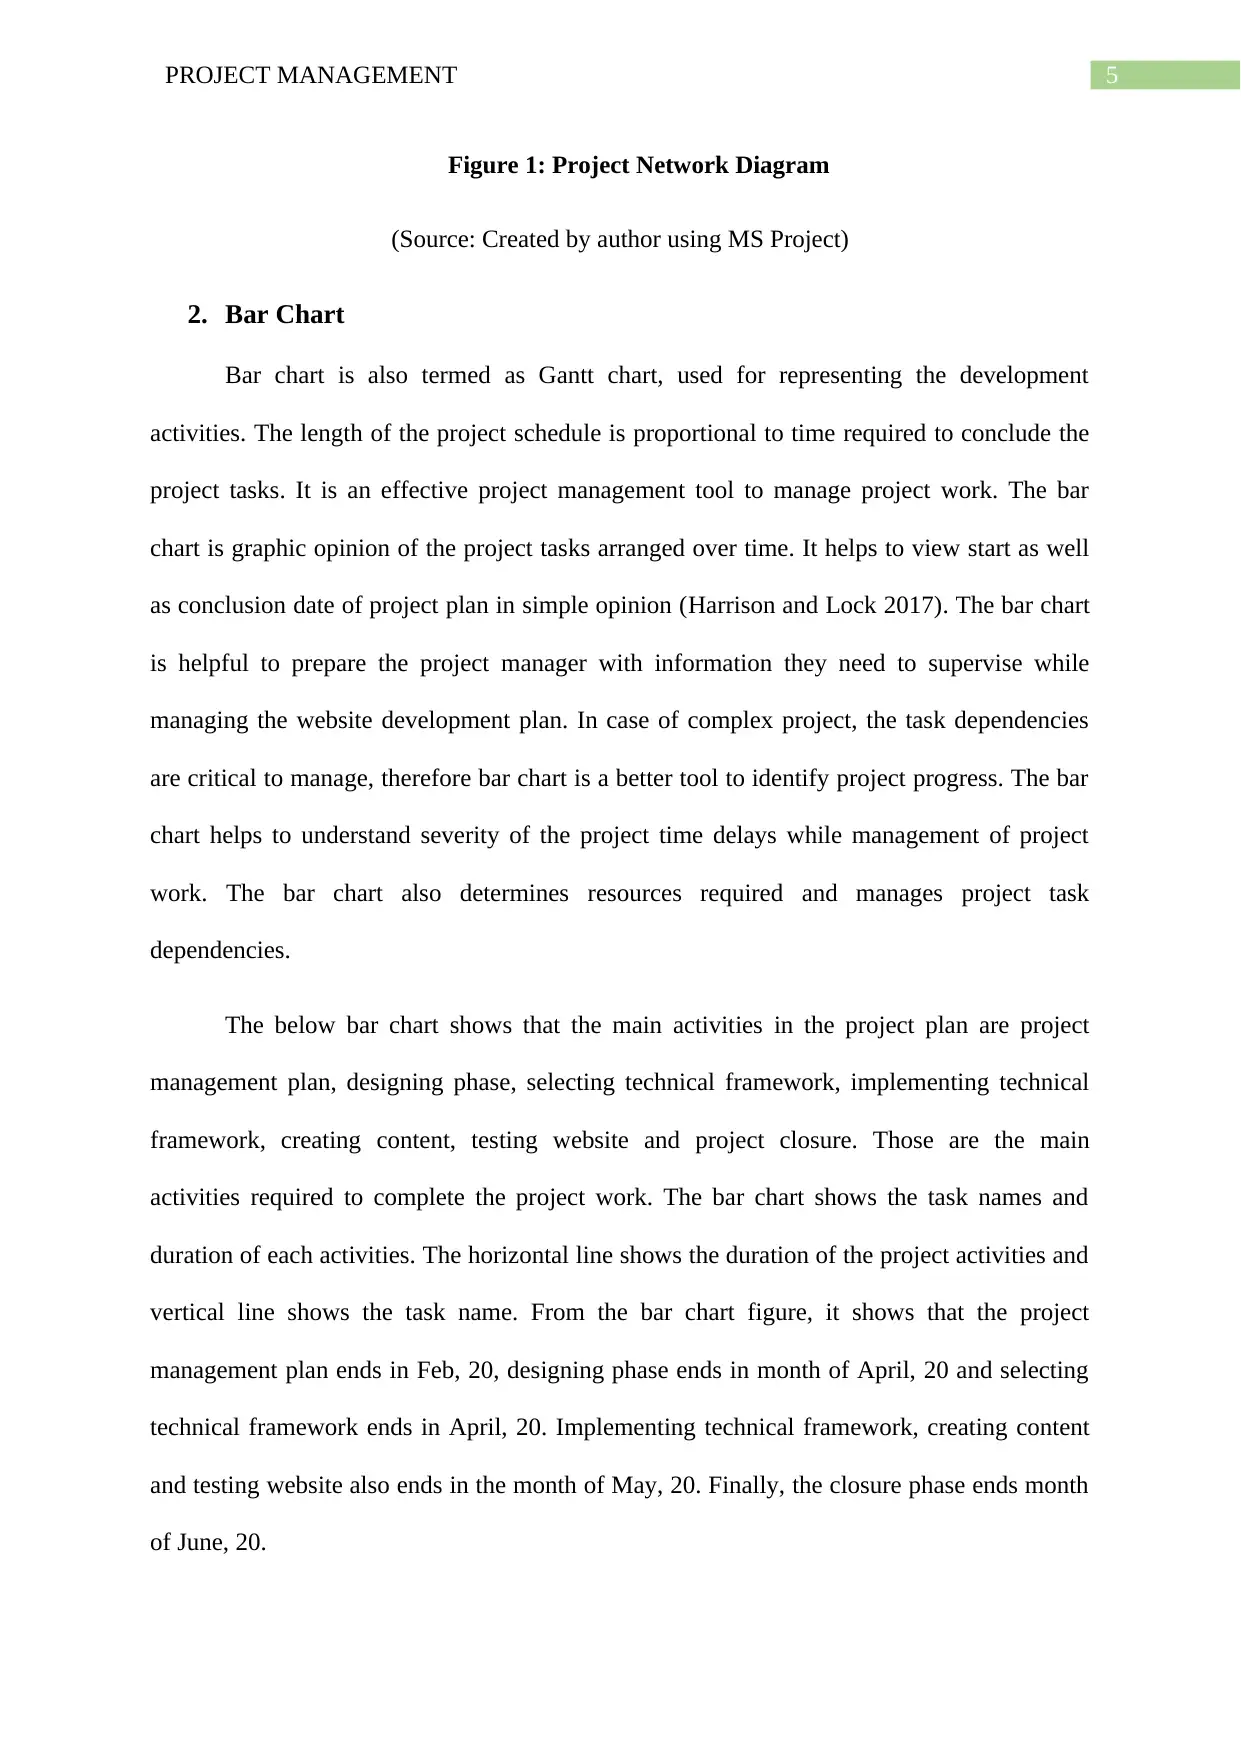
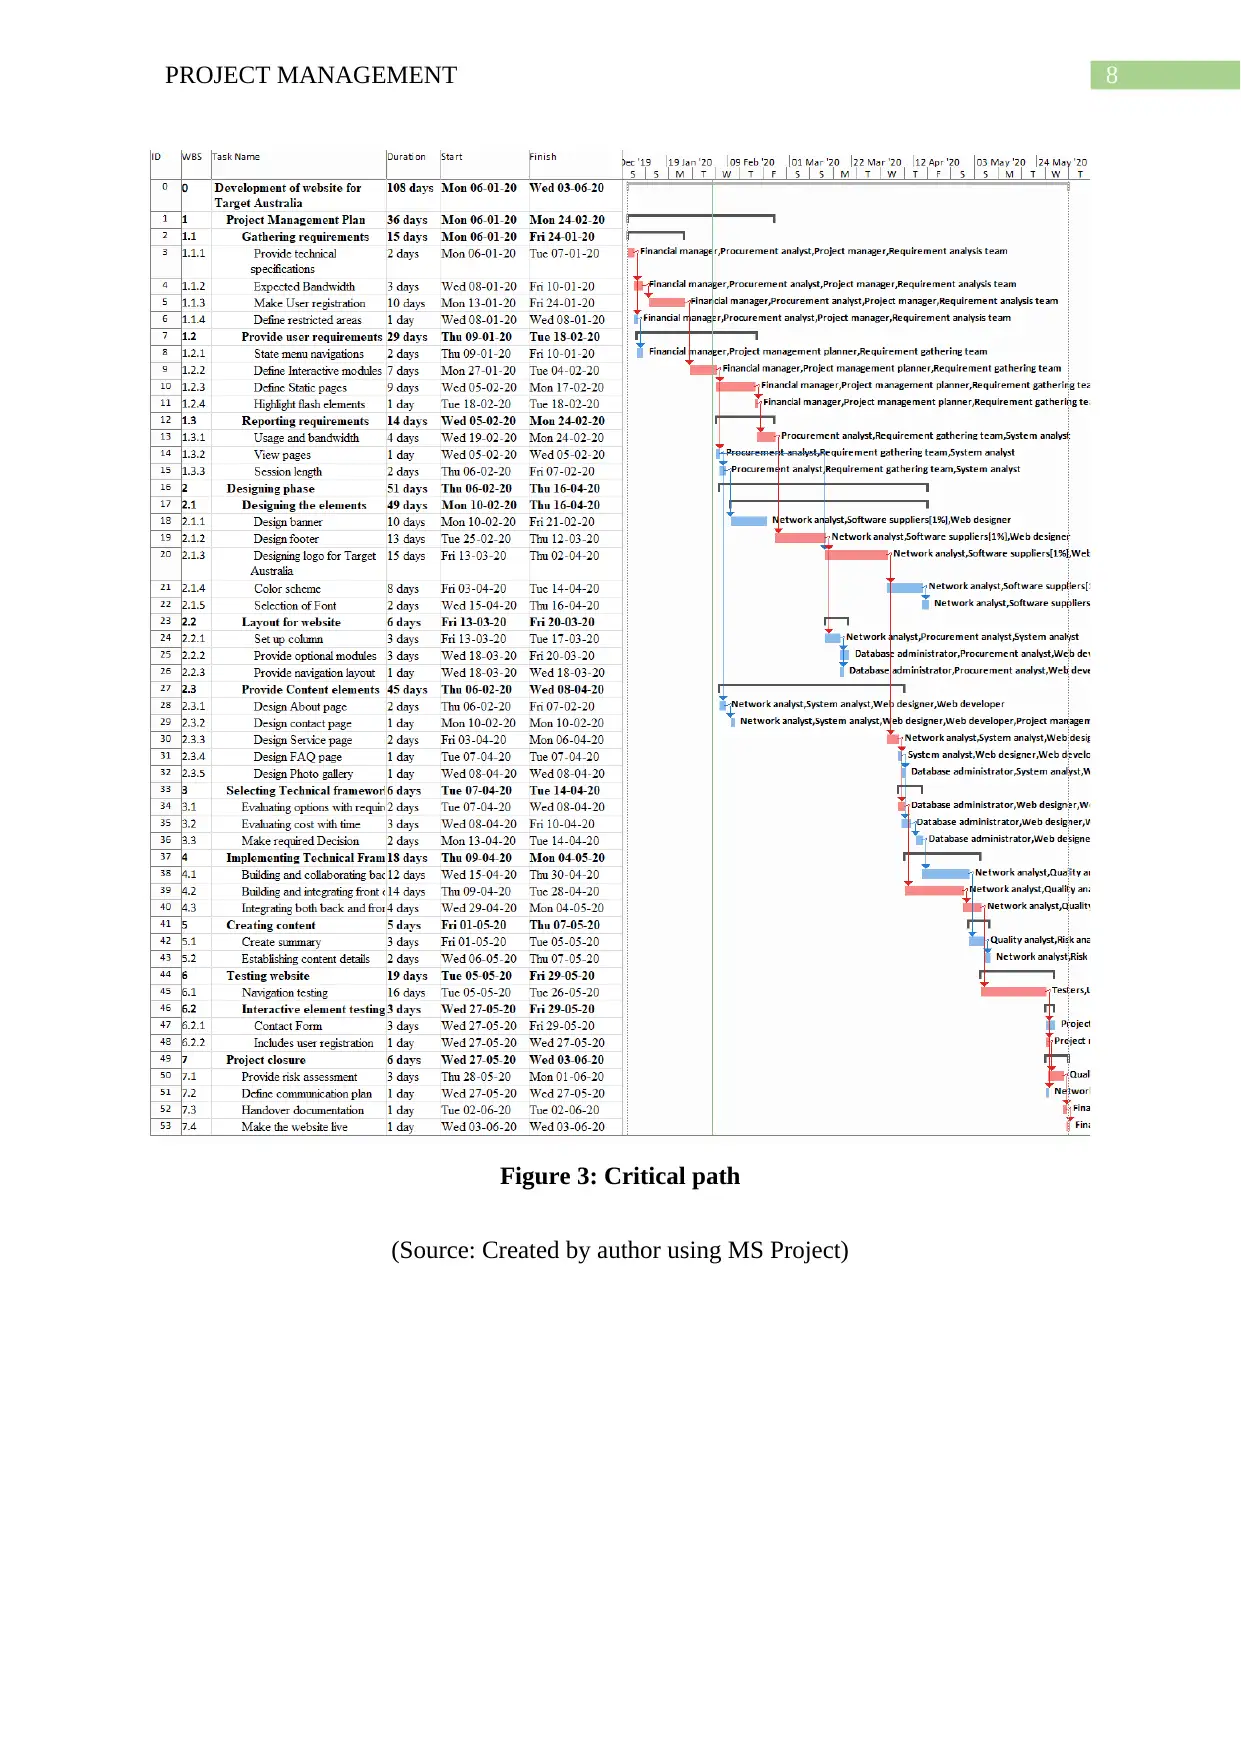
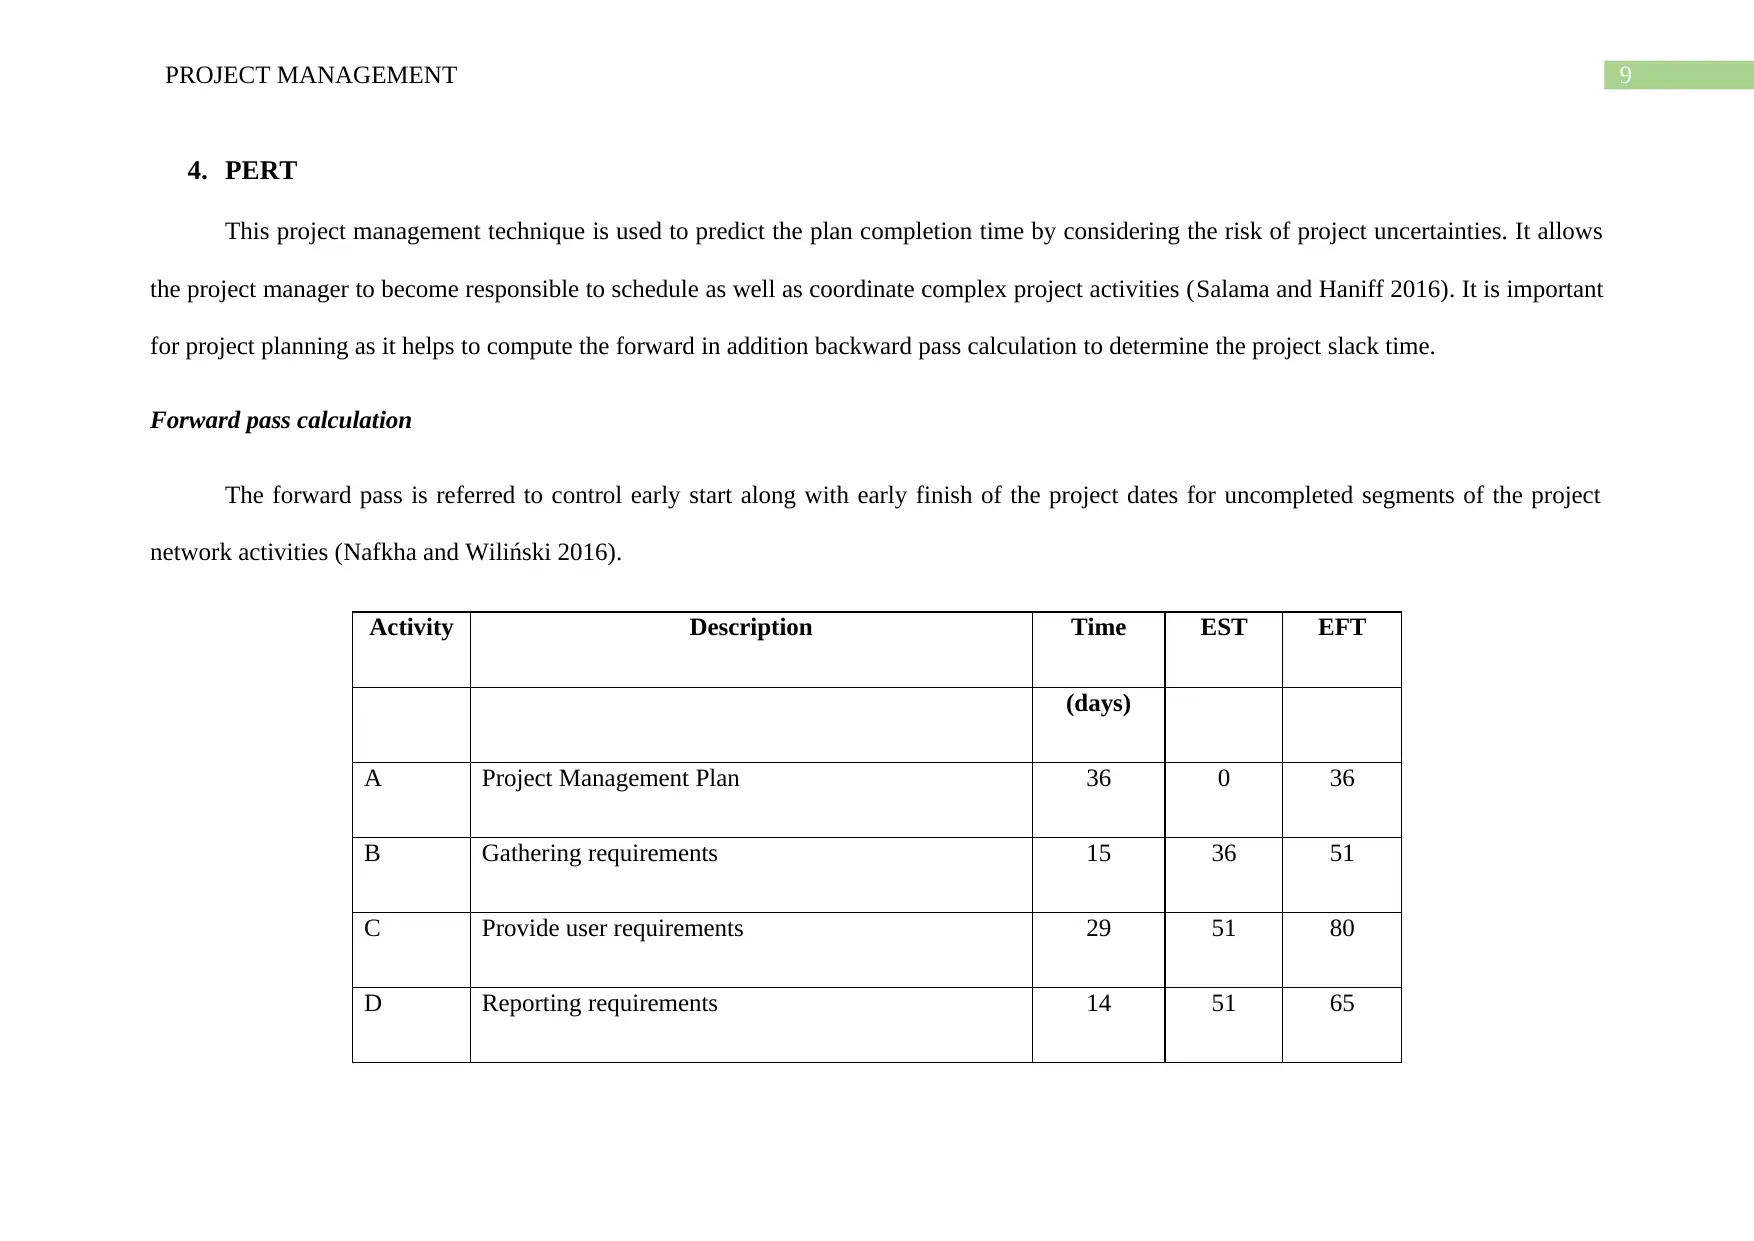
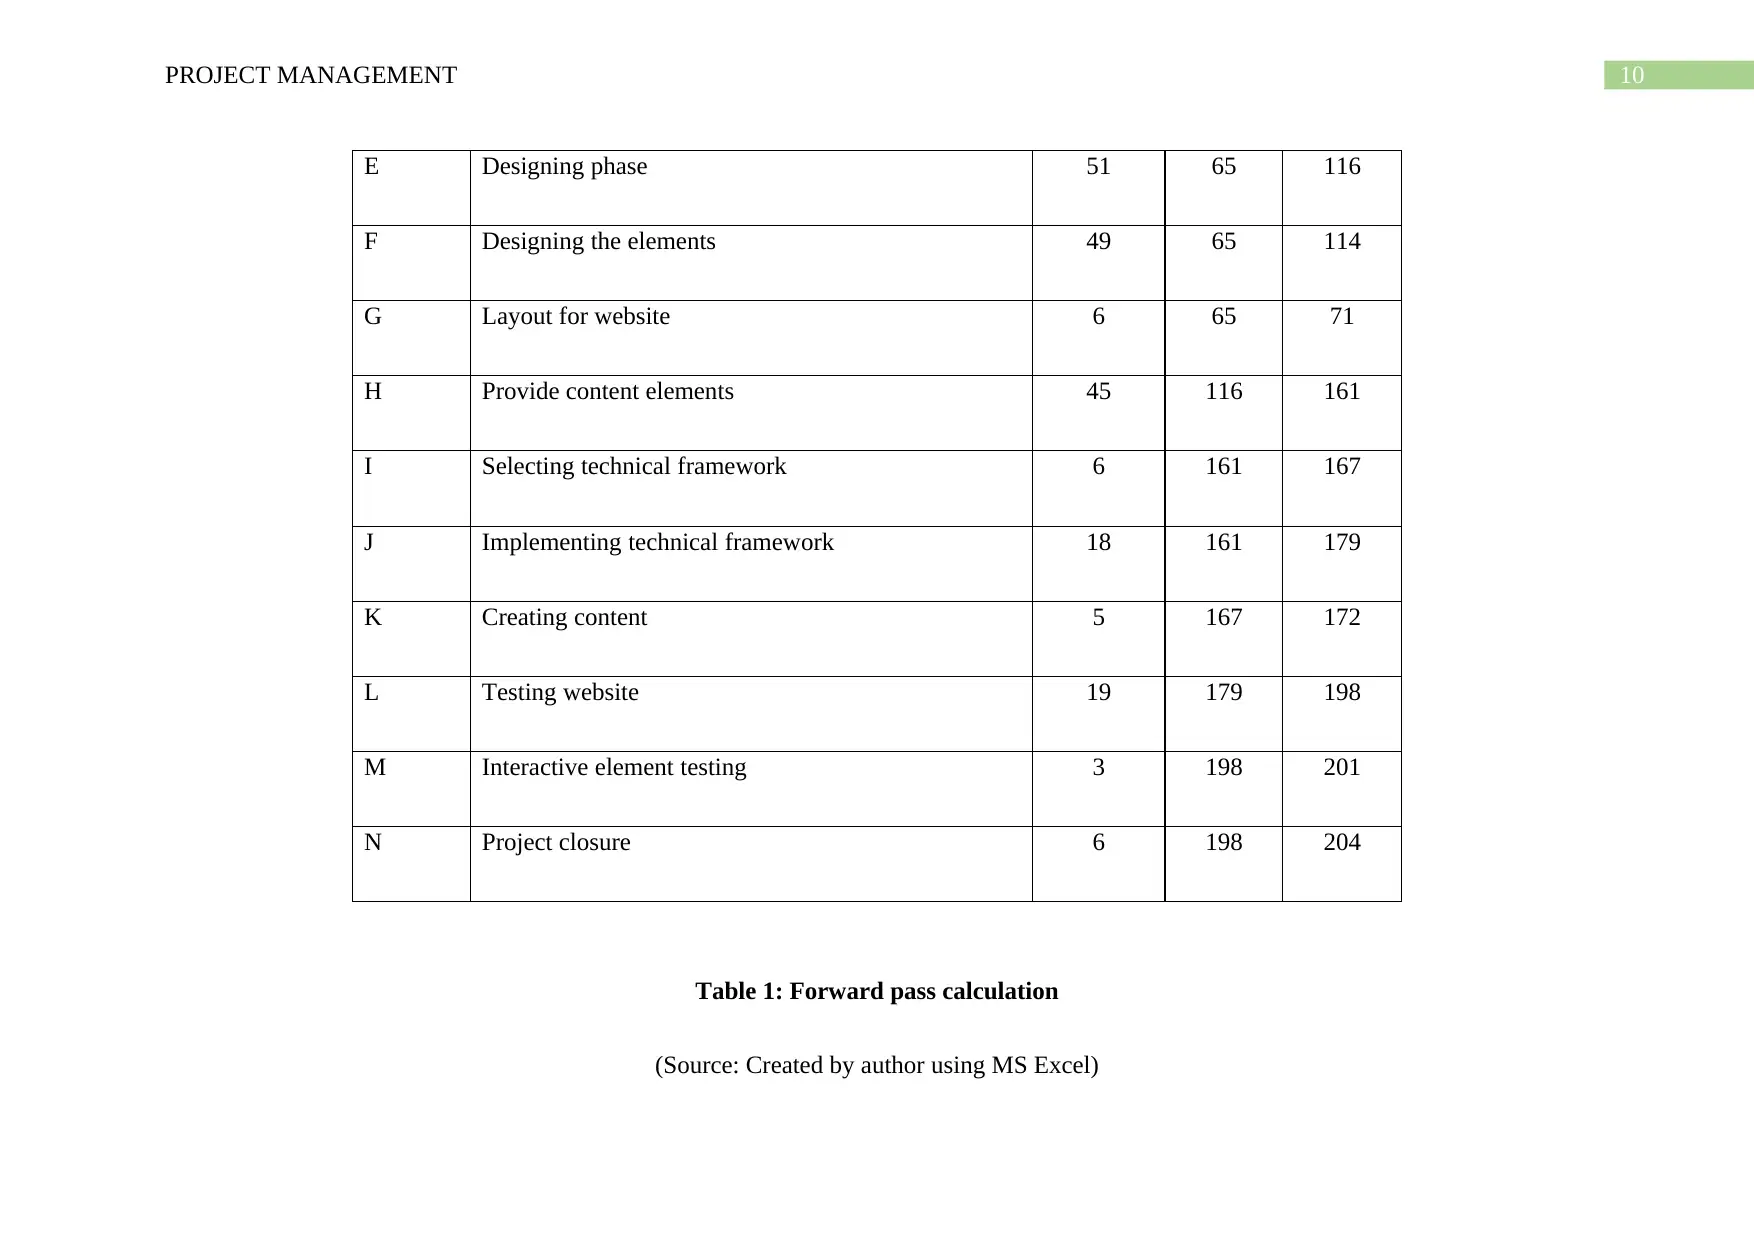
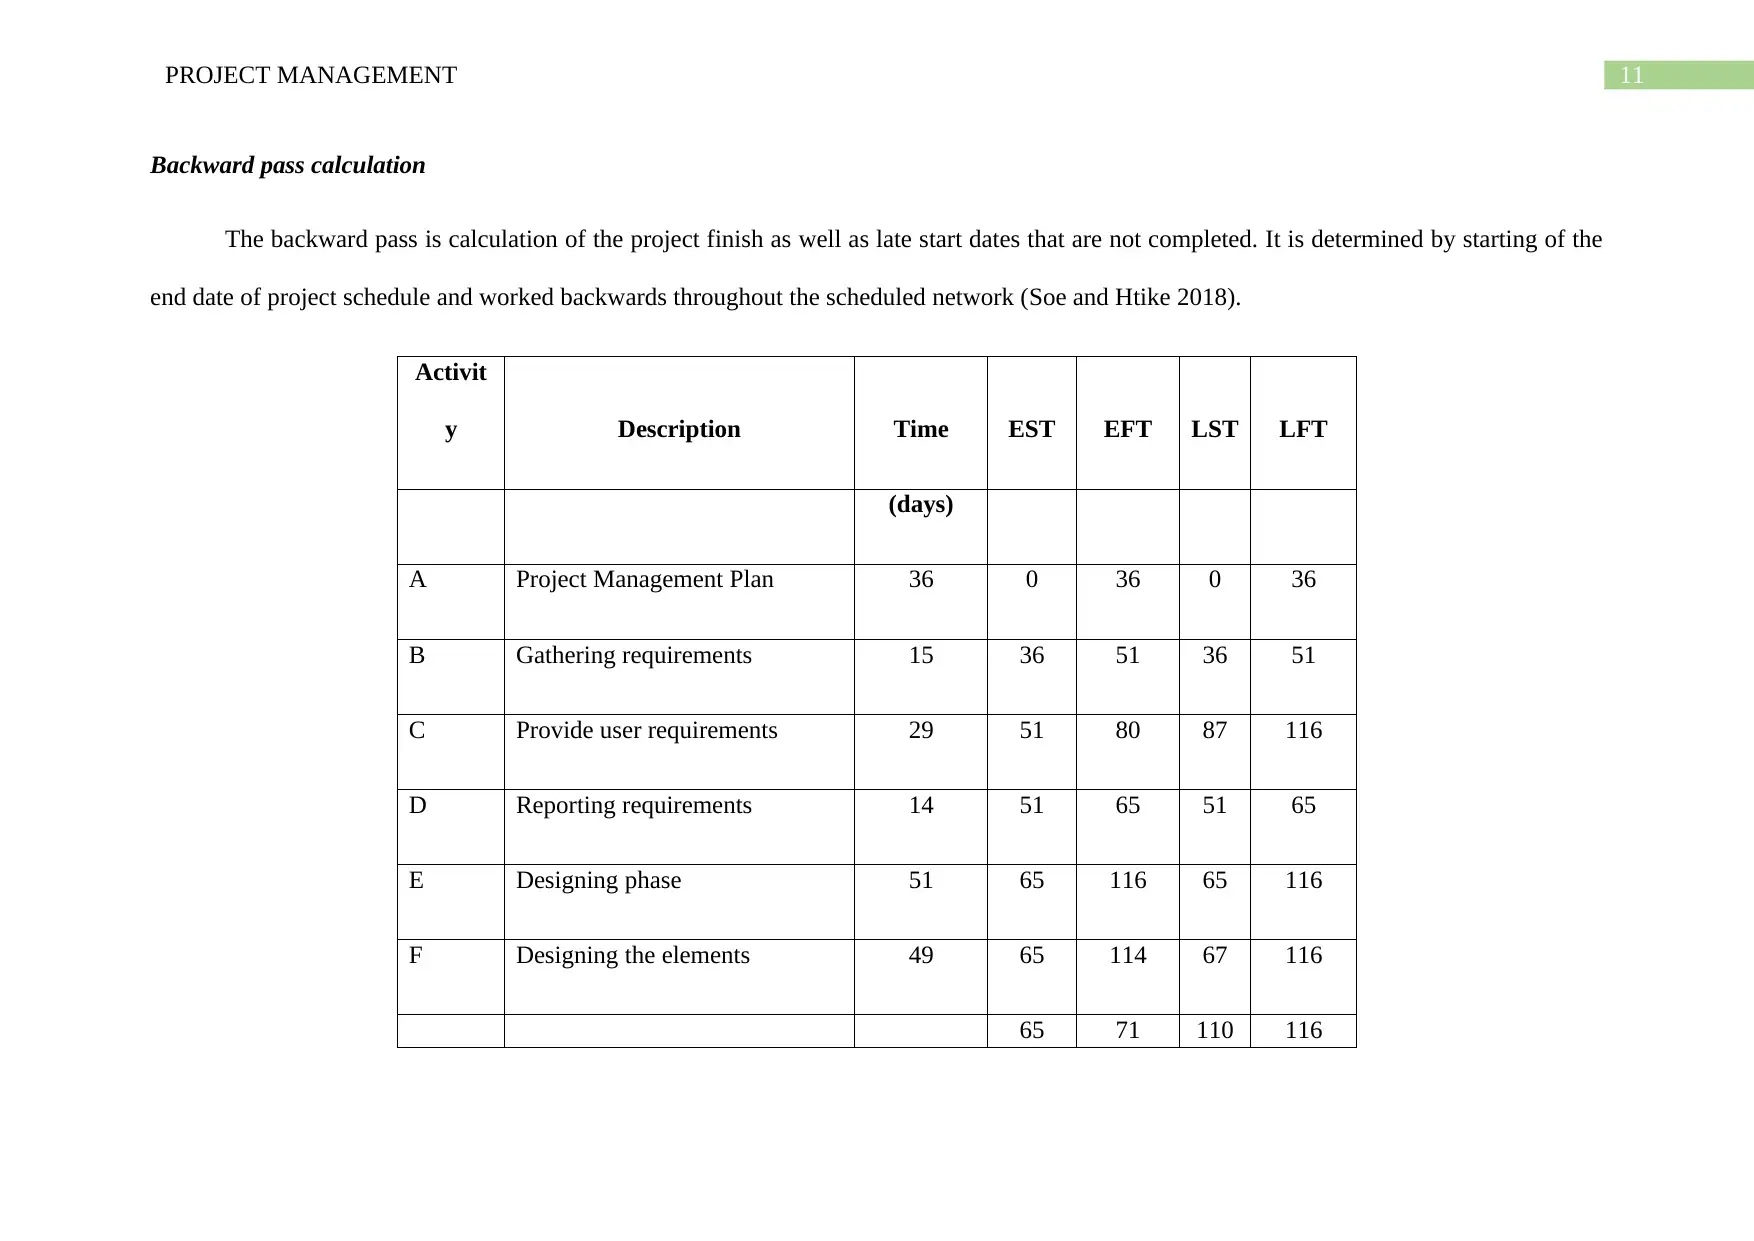
This project plan details the development of a website for Target Australia, outlining a 108-day project timeline commencing on January 6, 2020, and concluding on June 3, 2020. The project, managed using agile methodology, aims to enhance online customer experience and streamline company processes. The plan encompasses five key project management techniques: network diagrams, bar charts, critical path method (CPM), PERT analysis, and cash flow management, all utilized to ensure the project's timely and cost-effective completion. The scope focuses on identifying critical activities, managing project dependencies, and monitoring financial inflows and outflows, with an estimated budget of $142,320. The plan includes detailed network diagrams illustrating task dependencies, bar charts representing activity timelines, and CPM analysis highlighting critical paths. PERT analysis is used to predict project completion time, and cash flow management strategies are implemented to assess the financial health of the project. The project is currently at 64% completion, with an actual cost of $95,400.80 against a BCWP of $21,080.00.
1 out of 23
Related Documents


Your All-in-One AI-Powered Toolkit for Academic Success.
+13062052269
info@desklib.com
Available 24*7 on WhatsApp / Email
![[object Object]](/_next/static/media/star-bottom.7253800d.svg)
Copyright © 2020–2026 A2Z Services. All Rights Reserved. Developed and managed by ZUCOL.