FNSACC501 Assessment 2: Financial and Business Performance Information

Verified

Added on  2020/10/23

|6
|780
|451
Report
AI Summary
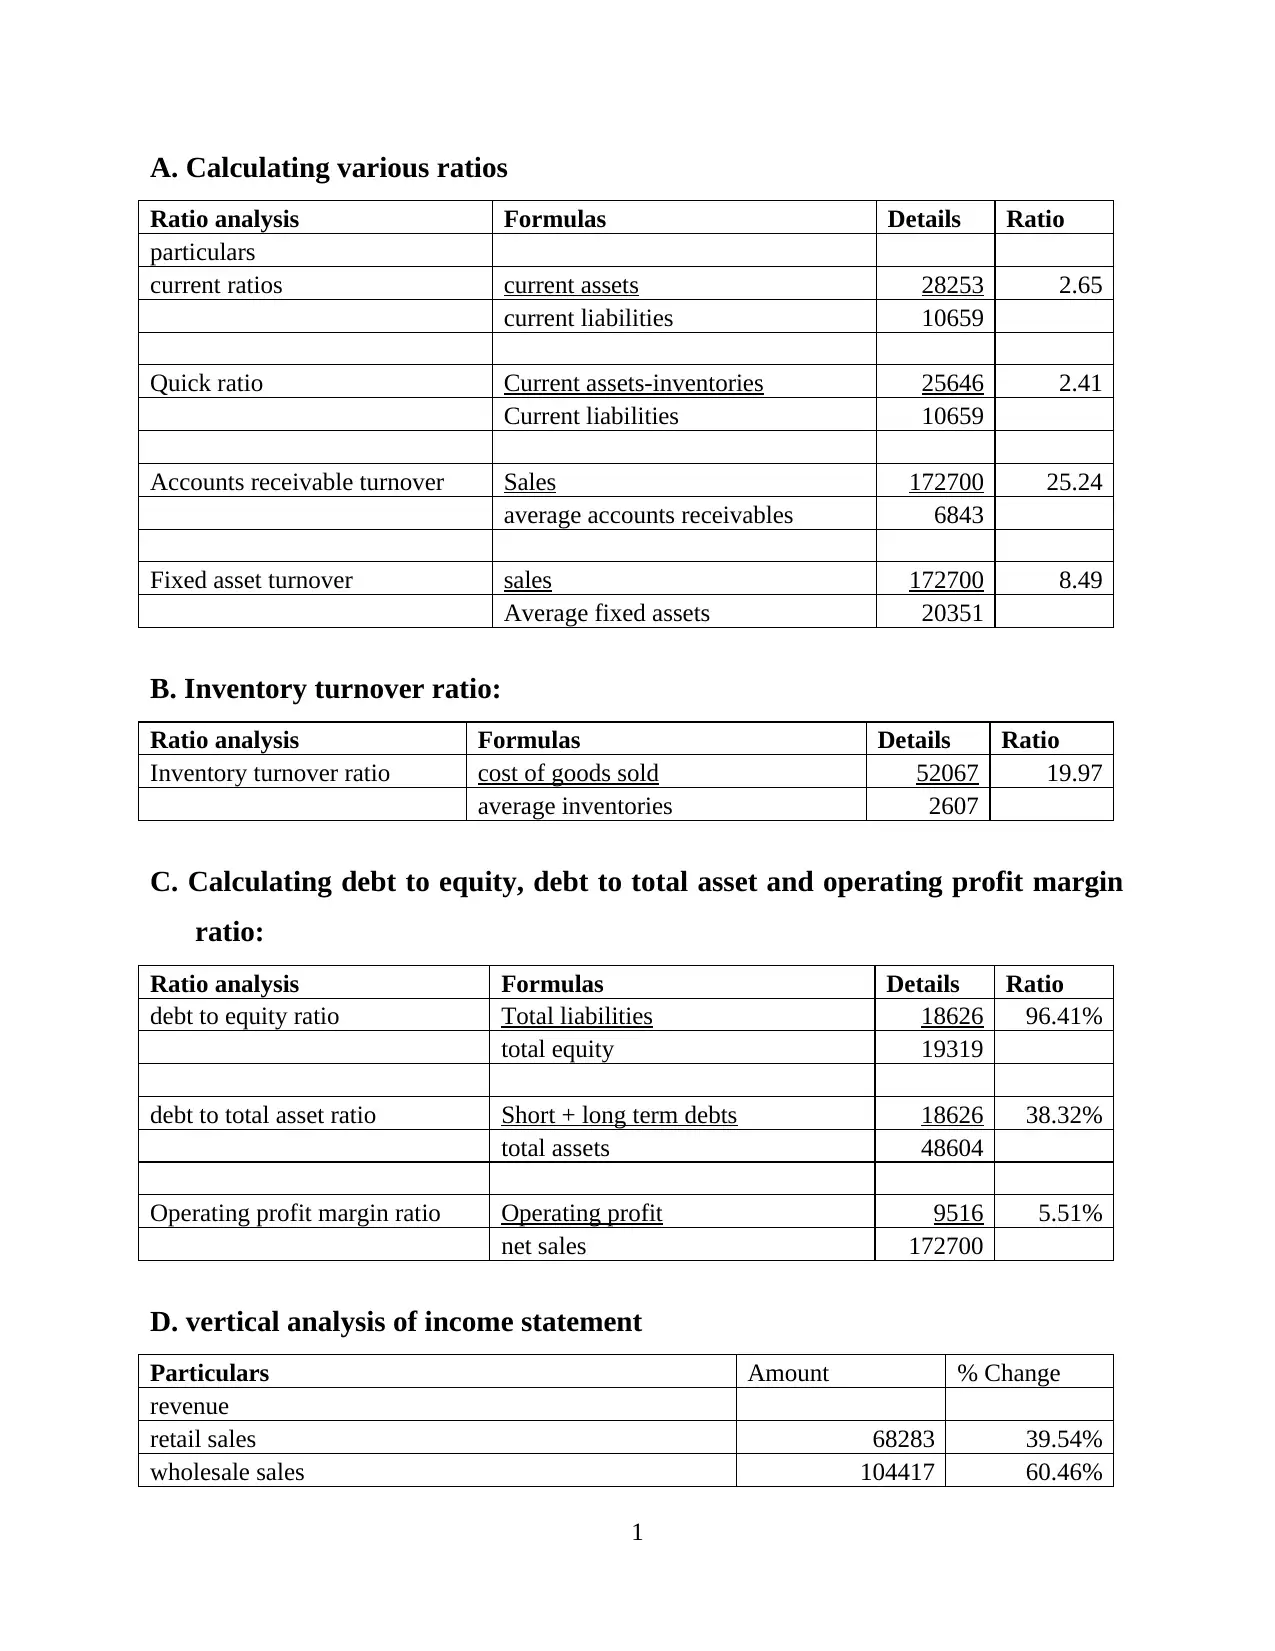
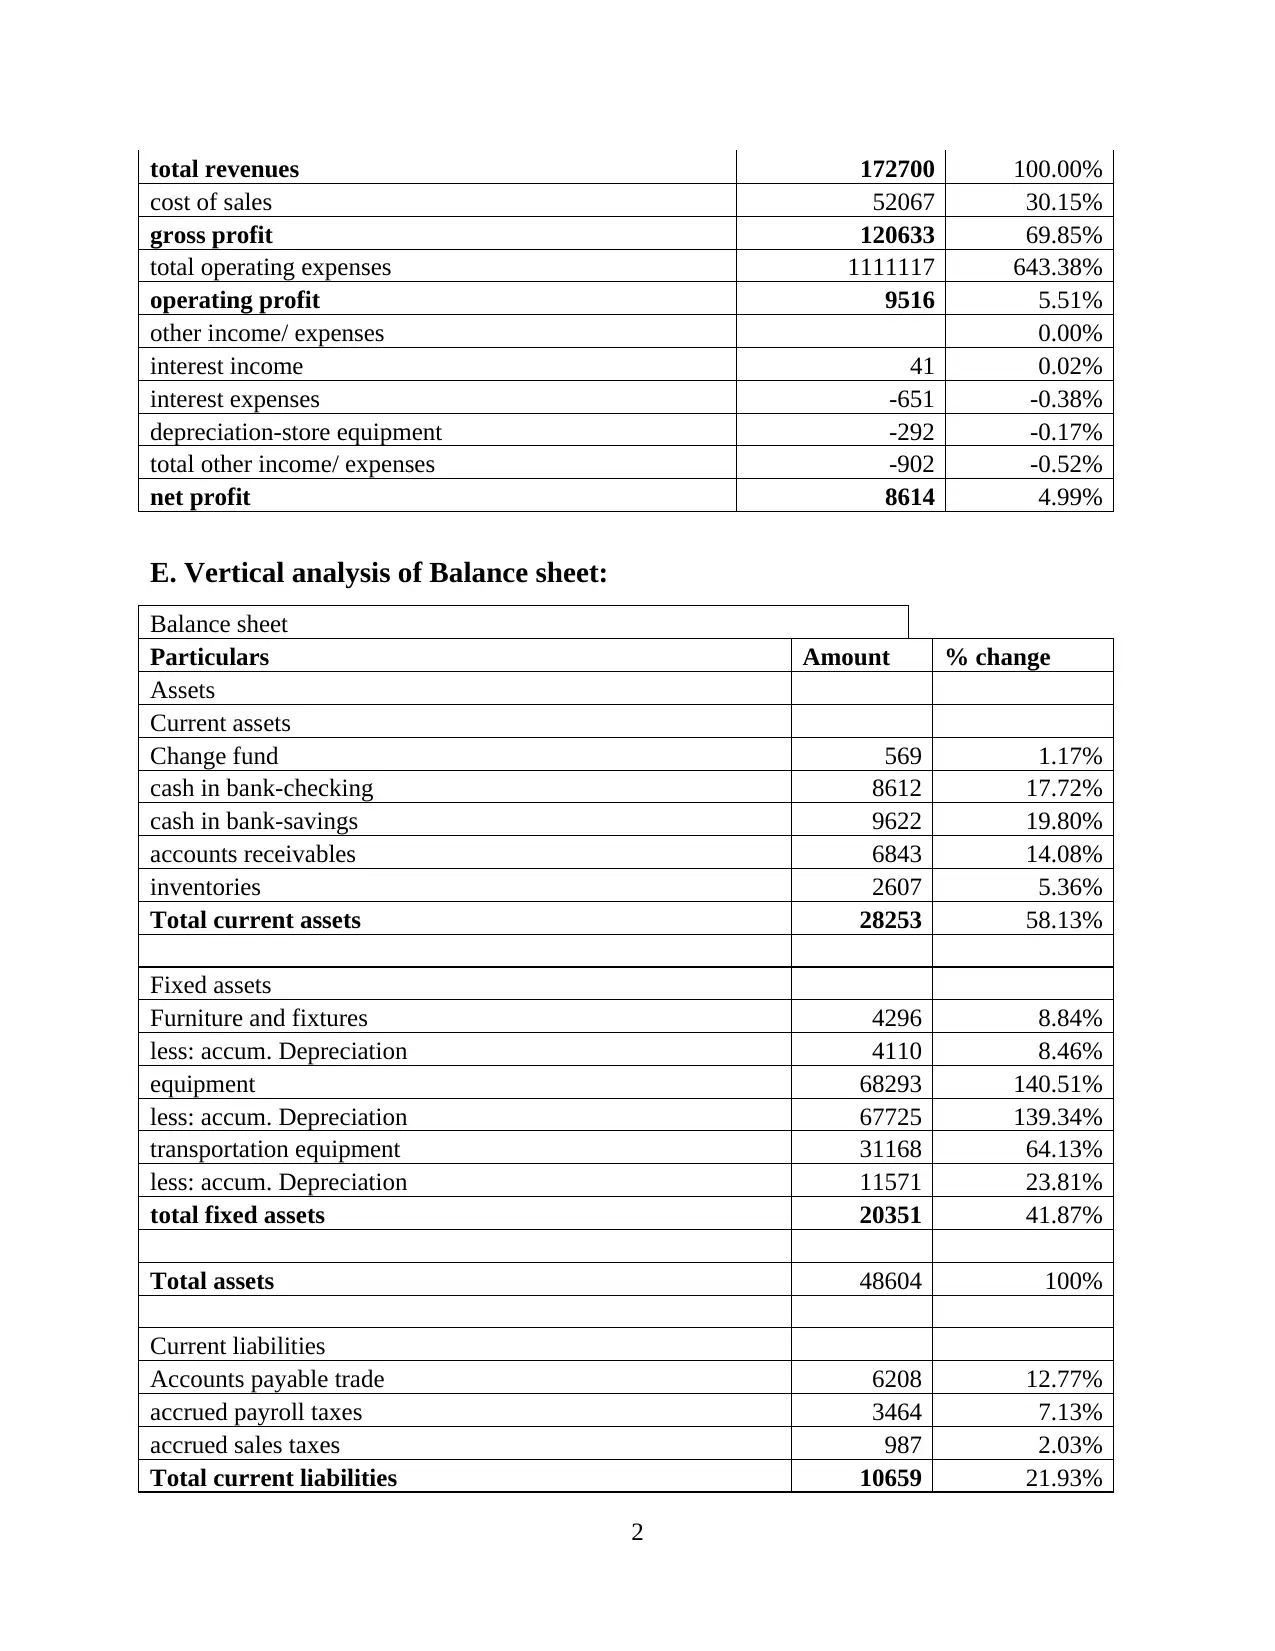
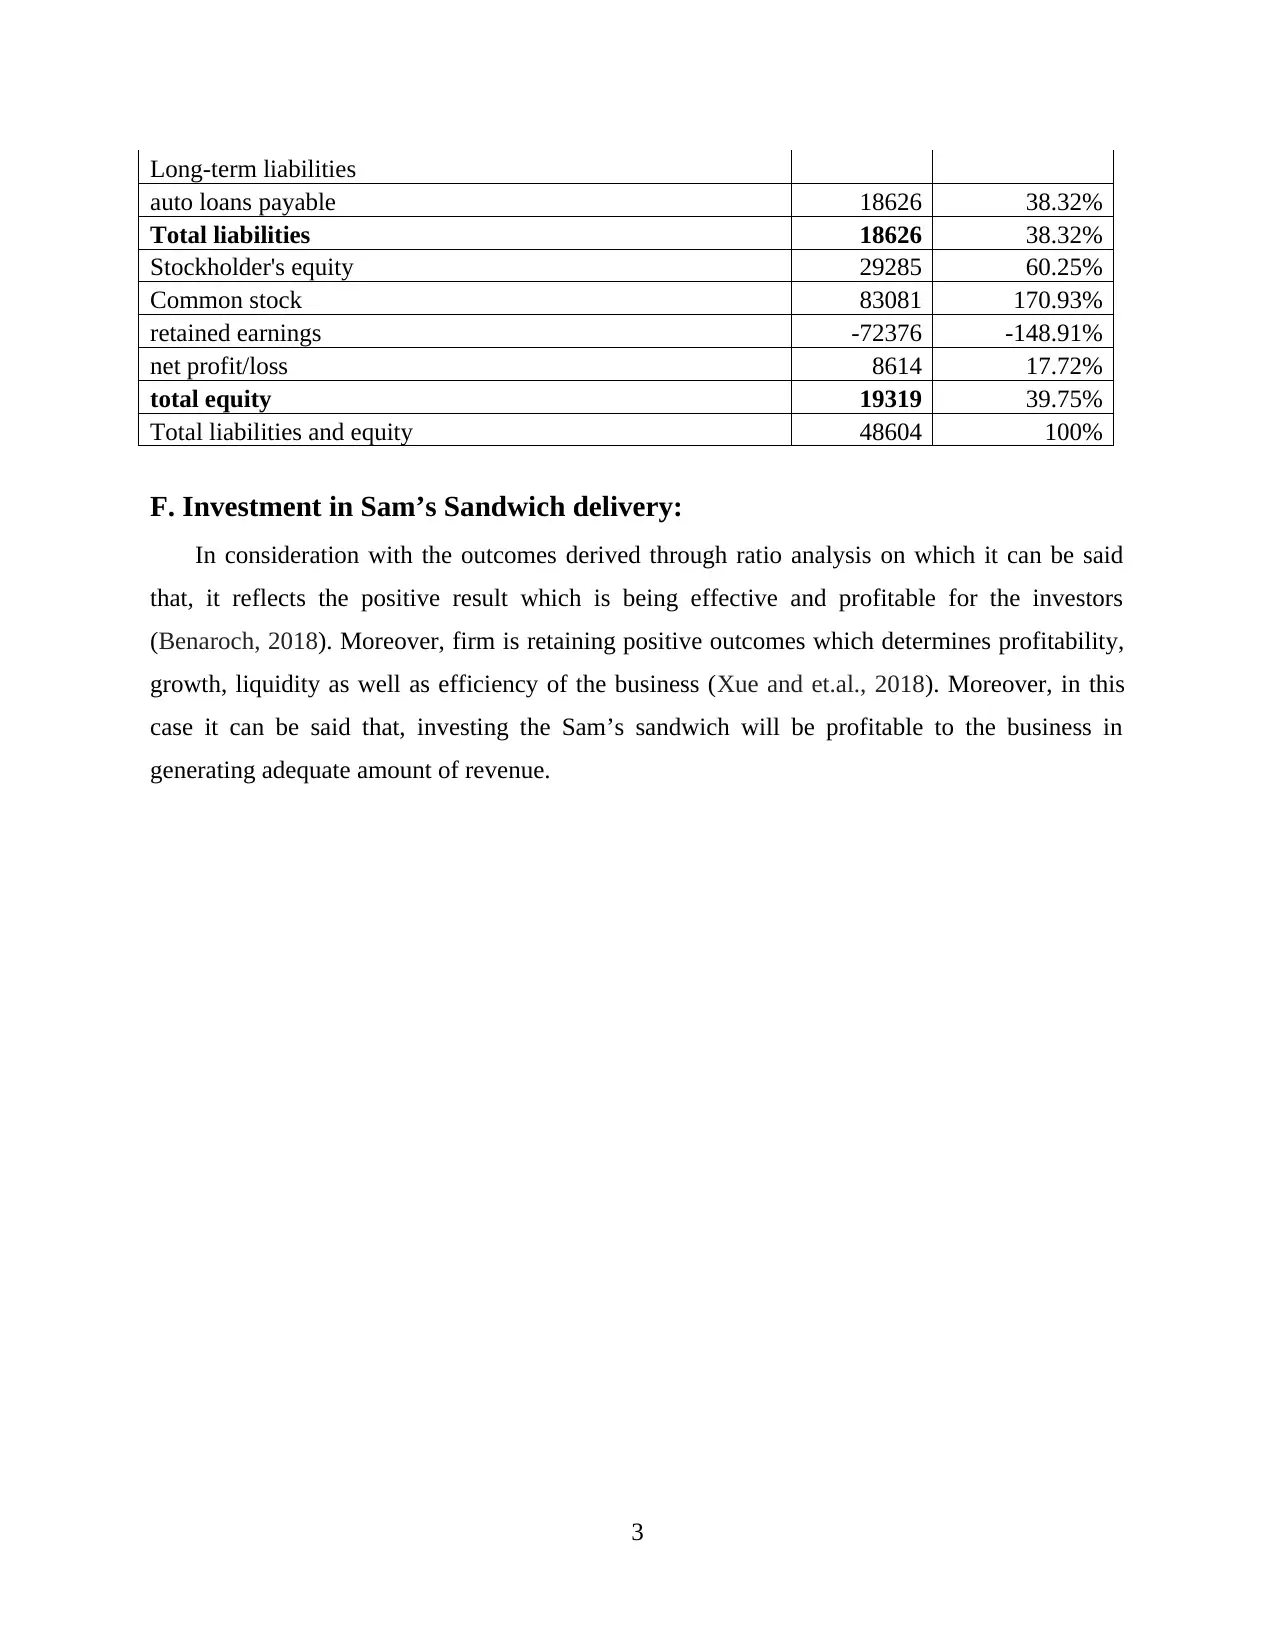
This report provides a comprehensive analysis of financial and business performance, focusing on various financial ratios and vertical analysis of income statements and balance sheets. The report calculates and interprets key ratios such as current ratio, quick ratio, accounts receivable turnover, fixed asset turnover, inventory turnover ratio, debt to equity ratio, debt to total asset ratio, and operating profit margin ratio. It also includes a vertical analysis of the income statement and balance sheet, providing insights into the percentage changes of different financial statement items. Furthermore, the report assesses the financial implications of an investment in Sam’s Sandwich delivery, concluding that the investment is likely to be profitable based on the positive outcomes derived through ratio analysis. The analysis is supported by references to relevant academic sources.
Document Page
FNSACC501 Provide financial and business
performance information Assessment 2
tabler-icon-diamond-filled.svg

Paraphrase This Document

Need a fresh take? Get an instant paraphrase of this document with our AI Paraphraser
Document Page
TABLE OF CONTENTS
A. Calculating various ratios...........................................................................................................1
B. Inventory turnover ratio:.............................................................................................................1
C. Calculating debt to equity, debt to total asset and operating profit margin ratio:.......................1
D. vertical analysis of income statement.........................................................................................1
E. Vertical analysis of Balance sheet:..............................................................................................2
F. Investment in Sam’s Sandwich delivery:....................................................................................3
REFERENCES................................................................................................................................4
Document Page
A. Calculating various ratios
Ratio analysis Formulas Details Ratio
particulars
current ratios current assets 28253 2.65
current liabilities 10659
Quick ratio Current assets-inventories 25646 2.41
Current liabilities 10659
Accounts receivable turnover Sales 172700 25.24
average accounts receivables 6843
Fixed asset turnover sales 172700 8.49
Average fixed assets 20351
B. Inventory turnover ratio:
Ratio analysis Formulas Details Ratio
Inventory turnover ratio cost of goods sold 52067 19.97
average inventories 2607
C. Calculating debt to equity, debt to total asset and operating profit margin
ratio:
Ratio analysis Formulas Details Ratio
debt to equity ratio Total liabilities 18626 96.41%
total equity 19319
debt to total asset ratio Short + long term debts 18626 38.32%
total assets 48604
Operating profit margin ratio Operating profit 9516 5.51%
net sales 172700
D. vertical analysis of income statement
Particulars Amount % Change
revenue
retail sales 68283 39.54%
wholesale sales 104417 60.46%
1
Document Page
total revenues 172700 100.00%
cost of sales 52067 30.15%
gross profit 120633 69.85%
total operating expenses 1111117 643.38%
operating profit 9516 5.51%
other income/ expenses 0.00%
interest income 41 0.02%
interest expenses -651 -0.38%
depreciation-store equipment -292 -0.17%
total other income/ expenses -902 -0.52%
net profit 8614 4.99%
E. Vertical analysis of Balance sheet:
Balance sheet
Particulars Amount % change
Assets
Current assets
Change fund 569 1.17%
cash in bank-checking 8612 17.72%
cash in bank-savings 9622 19.80%
accounts receivables 6843 14.08%
inventories 2607 5.36%
Total current assets 28253 58.13%
Fixed assets
Furniture and fixtures 4296 8.84%
less: accum. Depreciation 4110 8.46%
equipment 68293 140.51%
less: accum. Depreciation 67725 139.34%
transportation equipment 31168 64.13%
less: accum. Depreciation 11571 23.81%
total fixed assets 20351 41.87%
Total assets 48604 100%
Current liabilities
Accounts payable trade 6208 12.77%
accrued payroll taxes 3464 7.13%
accrued sales taxes 987 2.03%
Total current liabilities 10659 21.93%
2
tabler-icon-diamond-filled.svg

Paraphrase This Document

Need a fresh take? Get an instant paraphrase of this document with our AI Paraphraser
Document Page
Long-term liabilities
auto loans payable 18626 38.32%
Total liabilities 18626 38.32%
Stockholder's equity 29285 60.25%
Common stock 83081 170.93%
retained earnings -72376 -148.91%
net profit/loss 8614 17.72%
total equity 19319 39.75%
Total liabilities and equity 48604 100%
F. Investment in Sam’s Sandwich delivery:
In consideration with the outcomes derived through ratio analysis on which it can be said
that, it reflects the positive result which is being effective and profitable for the investors
(Benaroch, 2018). Moreover, firm is retaining positive outcomes which determines profitability,
growth, liquidity as well as efficiency of the business (Xue and et.al., 2018). Moreover, in this
case it can be said that, investing the Sam’s sandwich will be profitable to the business in
generating adequate amount of revenue.
3
Document Page
REFERENCES
Books and Journals
Benaroch, M., 2018. Real Options Models for Proactive Uncertainty-Reducing Mitigations and
Applications in Cybersecurity Investment Decision Making. Information Systems
Research. 29(2). pp.315-340.
Xue, W. and et.al., 2018. Pythagorean fuzzy LINMAP method based on the entropy theory for
railway project investment decision making. International Journal of Intelligent
Systems. 33(1). pp.93-125.
4
chevron_up_icon
1 out of 6
circle_padding
hide_on_mobile
zoom_out_icon
[object Object]