Force-Length Relationship Analysis and Sarcomere Length Determination by Laser Diffraction
Added on 2023-06-12
18 Pages1724 Words160 Views
FORCE-LENGTH RELATIONSHIP ANALYSIS AND SARCOMERE LENGTH
DETERMINATION BY LASER DIFFRACTION.
Abstract.
The experiment describes the force-length relationship: active and passive length-tensions. In
addition, it determines the sarcomere length through laser diffraction technique. The active
length tension graph that describes the muscle characteristics is developed. The graph consists of
an ascending limb that indicates a rapid increase in sarcomere length as a result of the action of
actin and myosin filament overlap that reduces the potential for strength expression (Anon, n.d).
It also consists of a plateau where there is no change in force with the increasing length since
there is no cross bridge being formed by the filaments. Lastly, the descending limb in the active
length-tension graph is as a result of a decrease in overlap between the actin and myosin
filaments, therefore making it possible for the sarcomere to decrease with an increase in length.
The passive length-tension on the other hand also has a graph that has two characteristics
depending on whether the optimal length is reached or not. Below the optimal length, the muscle
is extended and very little passive force is exerted. Above the optimum length, the force exerted
by the passive structures within the sarcomere increases very rapidly (Anon, n.d). This passive
force is as a result of titin action in the sarcomere and also because of elastic structures like
connective tissues.
FORCE-LENGTH RELATIONSHIP ANALYSIS AND SARCOMERE LENGTH
DETERMINATION BY LASER DIFFRACTION.
Introduction
The skeletal muscle is a highly compartmentalized organ of the body, composed of single fibres
that are embedded in a matrix of collagen (University of California, 2000). At the end of the
muscle belly, the matrix becomes the tendon that connects the muscle to the bone (University of
California, 2000). Each of the cell is enclosed by a cell membrane, they also contain
mitochondria for the oxidative metabolism of nutrients and lastly they contain organelles that
help them in protein synthesis. Actin and myosin molecules in the muscle are the main molecules
that generate the length-tension. They are arranged in interdigitating matrices that are capable of
sliding across each other (University of California, 2000). The force is created when the myosin
filaments form cross bridges with the actin filament, and slightly rotate in order to pull the
filaments across each other. This isometric force exerted by the muscle is dependent on the
length when tested and hence it forms the length tension relationship that consists of the active
length tension and passive length tension relationships. According to (University of California,
1984), the active length tension relationship is thought to occur as a result of the degree of
overlap between actin and myosin filaments within a sarcomere. Too much overlap can however
lead to the development of sub-optimal tension. The passive length tension relationship reflects
the presence of elastic fibres within the sarcomere that stretch in order to produce a force with an
increasing length. The muscle moves to longer lengths in eccentric contractions compared to
concentric concentrations and because of the superior rapid force development in concentric
contractions.
According to (University of Sydney, 2018), “Within the sarcomere the thick and thin filaments
are arranged in parallel and are also in longitudinal register such that the structure of the
FORCE-LENGTH RELATIONSHIP ANALYSIS AND SARCOMERE LENGTH
DETERMINATION BY LASER DIFFRACTION.
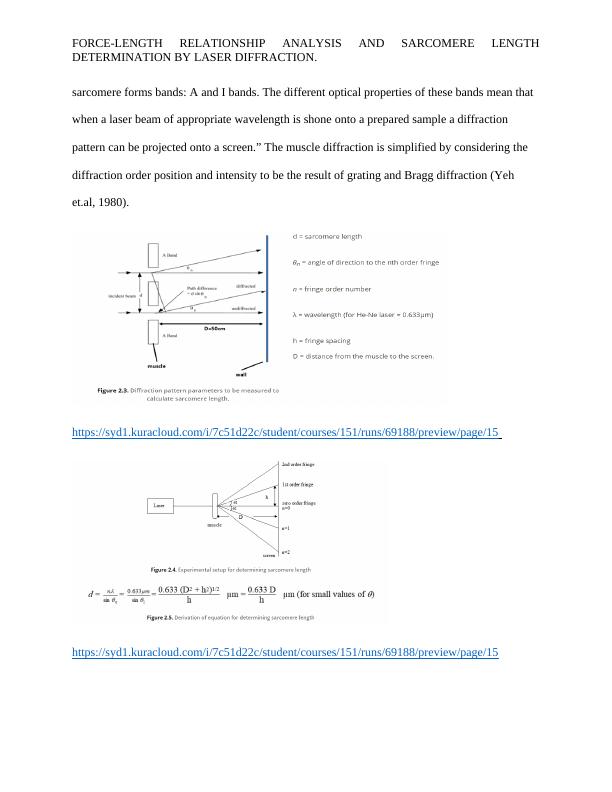
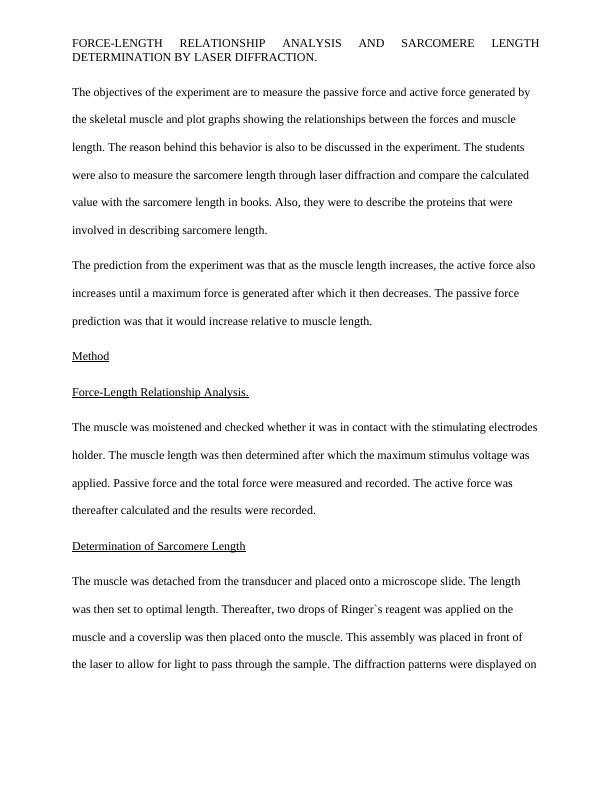
sarcomere forms bands: A and I bands. The different optical properties of these bands mean that
when a laser beam of appropriate wavelength is shone onto a prepared sample a diffraction
pattern can be projected onto a screen.” The muscle diffraction is simplified by considering the
diffraction order position and intensity to be the result of grating and Bragg diffraction (Yeh
et.al, 1980).
https://syd1.kuracloud.com/i/7c51d22c/student/courses/151/runs/69188/preview/page/15
https://syd1.kuracloud.com/i/7c51d22c/student/courses/151/runs/69188/preview/page/15
DETERMINATION BY LASER DIFFRACTION.
sarcomere forms bands: A and I bands. The different optical properties of these bands mean that
when a laser beam of appropriate wavelength is shone onto a prepared sample a diffraction
pattern can be projected onto a screen.” The muscle diffraction is simplified by considering the
diffraction order position and intensity to be the result of grating and Bragg diffraction (Yeh
et.al, 1980).
https://syd1.kuracloud.com/i/7c51d22c/student/courses/151/runs/69188/preview/page/15
https://syd1.kuracloud.com/i/7c51d22c/student/courses/151/runs/69188/preview/page/15
FORCE-LENGTH RELATIONSHIP ANALYSIS AND SARCOMERE LENGTH
DETERMINATION BY LASER DIFFRACTION.
The objectives of the experiment are to measure the passive force and active force generated by
the skeletal muscle and plot graphs showing the relationships between the forces and muscle
length. The reason behind this behavior is also to be discussed in the experiment. The students
were also to measure the sarcomere length through laser diffraction and compare the calculated
value with the sarcomere length in books. Also, they were to describe the proteins that were
involved in describing sarcomere length.
The prediction from the experiment was that as the muscle length increases, the active force also
increases until a maximum force is generated after which it then decreases. The passive force
prediction was that it would increase relative to muscle length.
Method
Force-Length Relationship Analysis.
The muscle was moistened and checked whether it was in contact with the stimulating electrodes
holder. The muscle length was then determined after which the maximum stimulus voltage was
applied. Passive force and the total force were measured and recorded. The active force was
thereafter calculated and the results were recorded.
Determination of Sarcomere Length
The muscle was detached from the transducer and placed onto a microscope slide. The length
was then set to optimal length. Thereafter, two drops of Ringer`s reagent was applied on the
muscle and a coverslip was then placed onto the muscle. This assembly was placed in front of
the laser to allow for light to pass through the sample. The diffraction patterns were displayed on
End of preview
Want to access all the pages? Upload your documents or become a member.