Analysis of Movie Ratings and Forecast Accuracy
VerifiedAdded on 2023/03/21
|17
|707
|87
Presentation
AI Summary
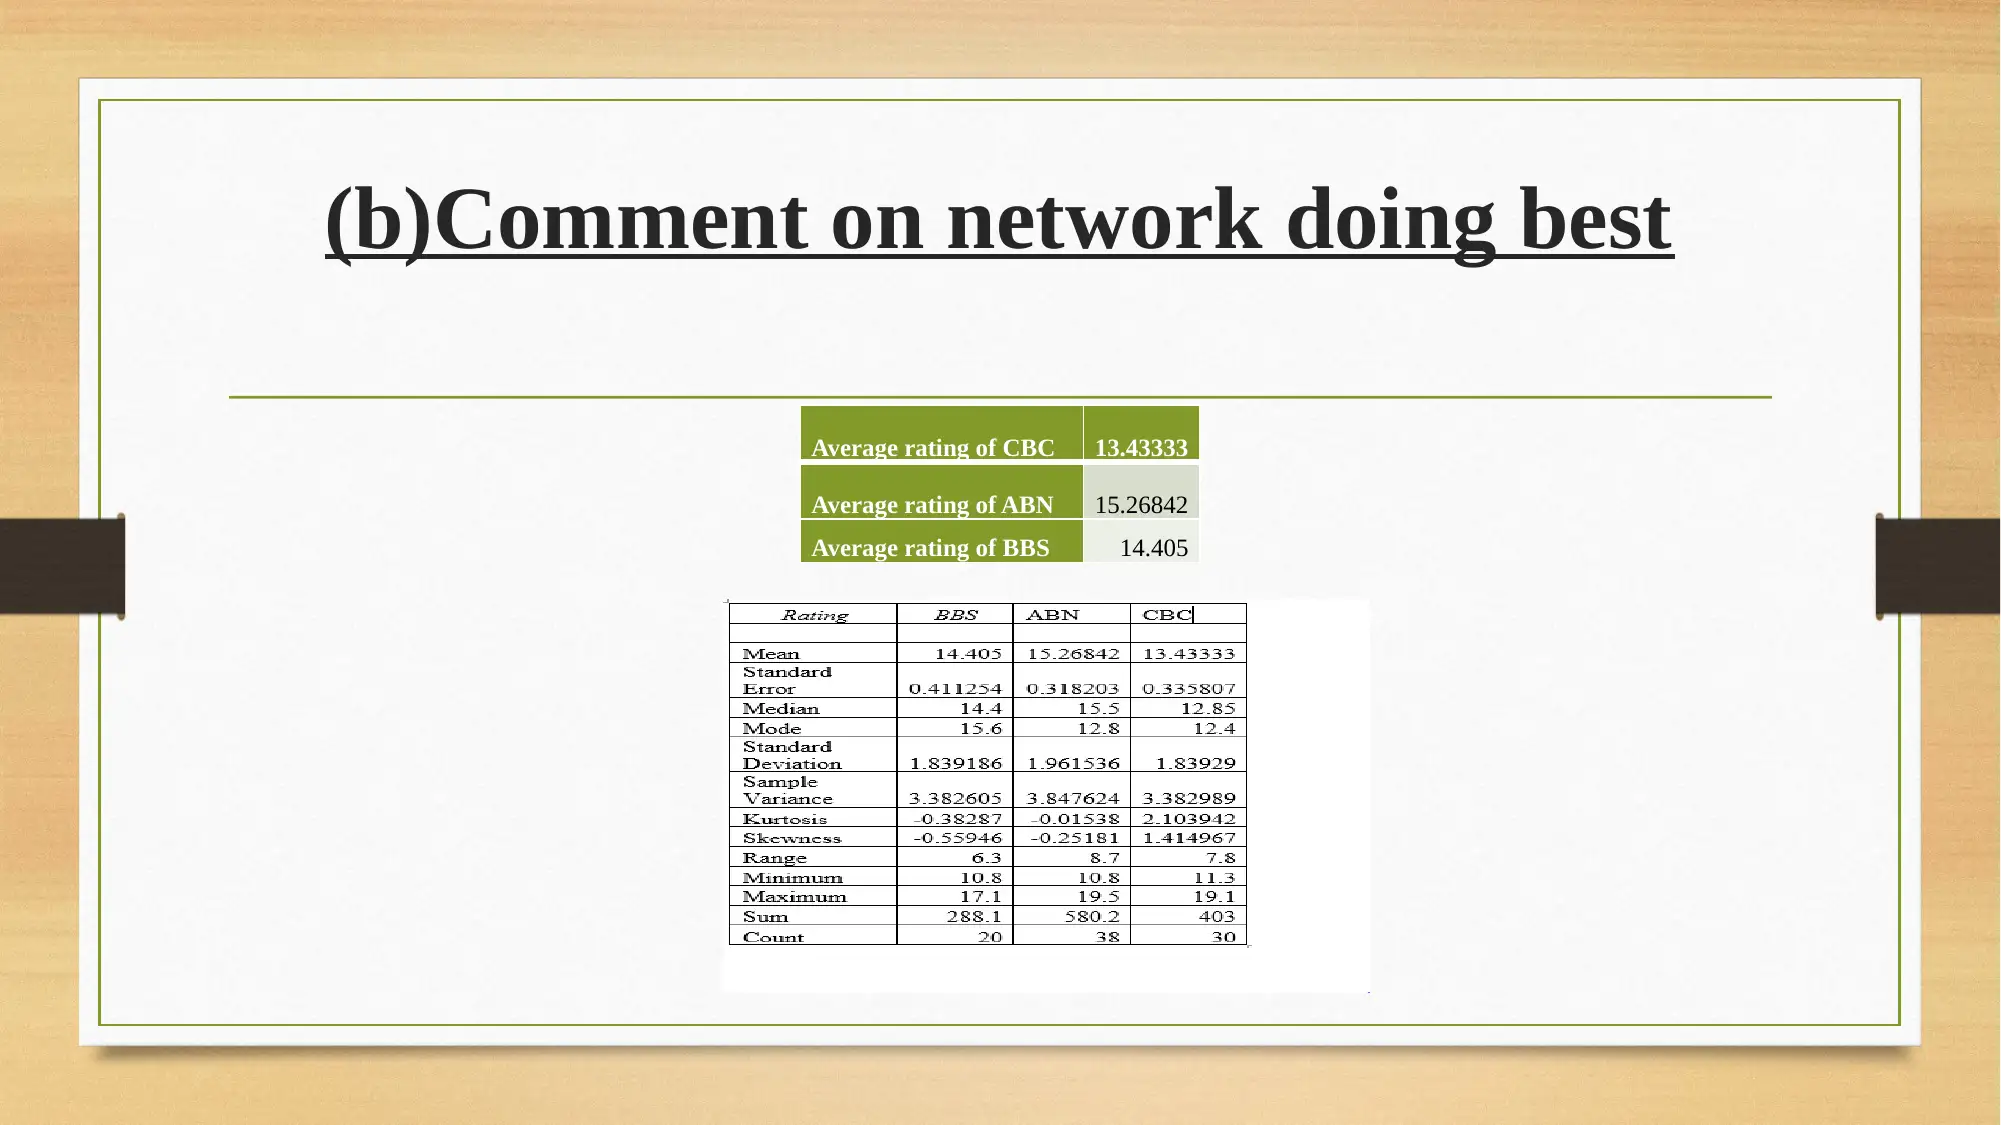
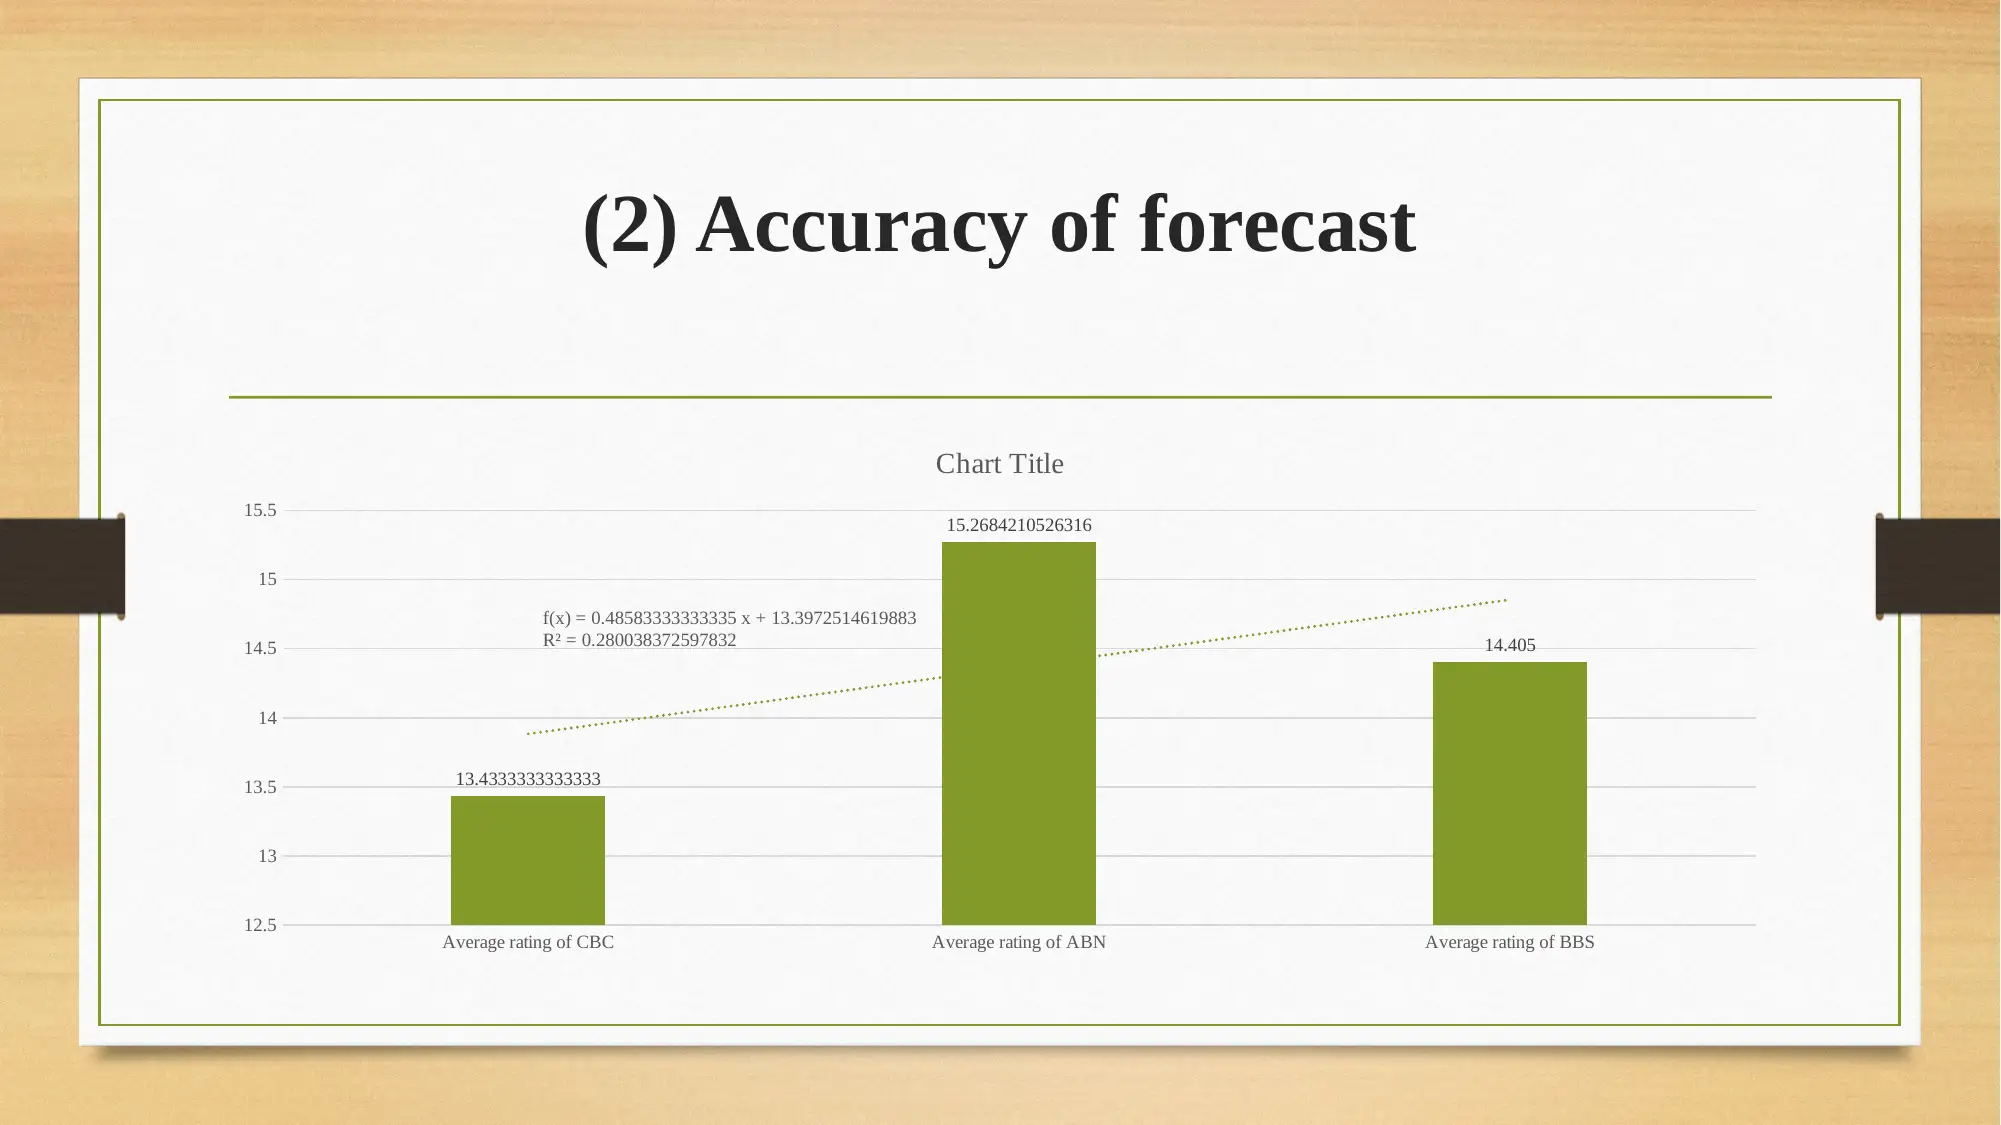
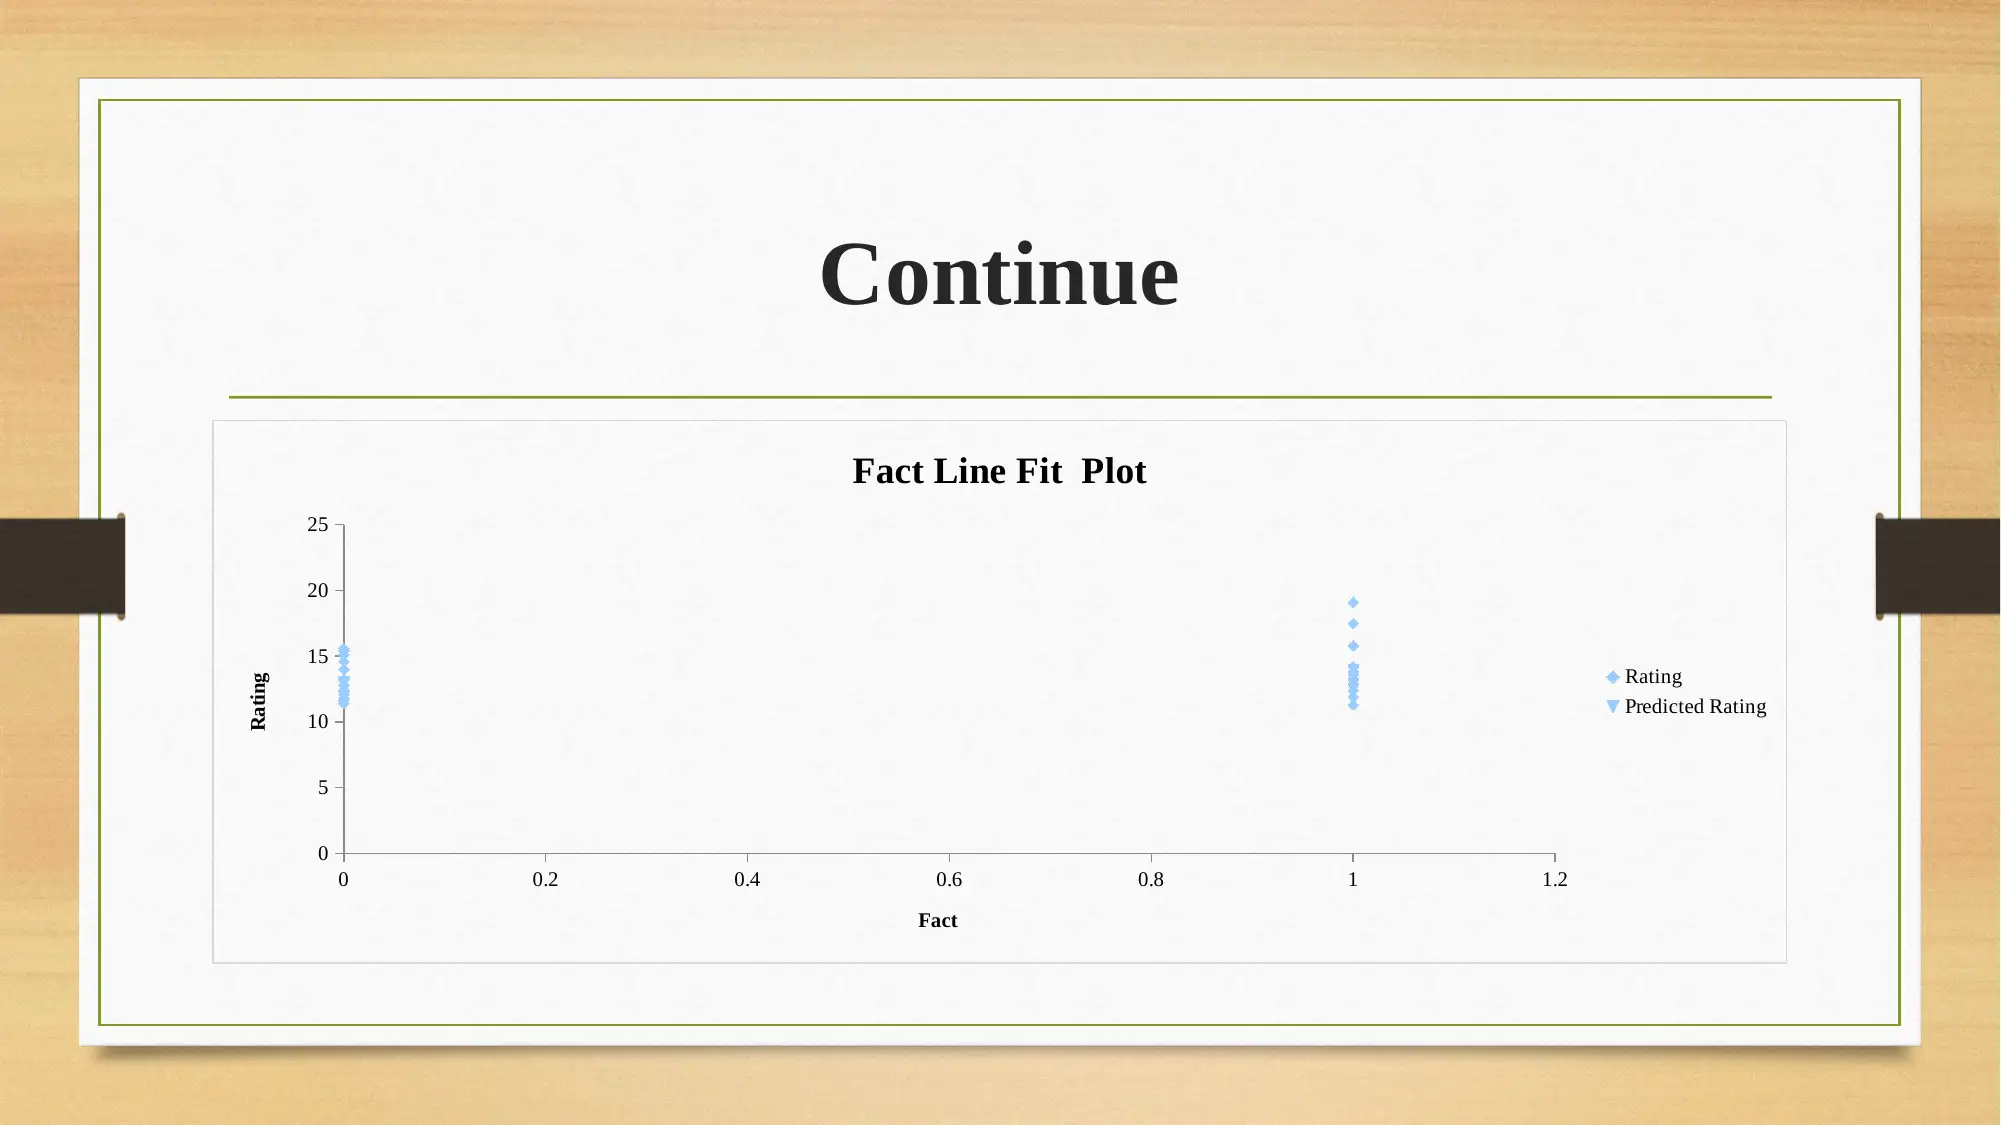
This presentation provides an analysis of movie ratings for CBC, ABN, and BBS networks. It discusses the average ratings, the network doing the best, the accuracy of the forecast, hypothesis testing, and the impact of independent variables on movie ratings. The presentation concludes with recommendations for executives.
Contribute Materials
Your contribution can guide someone’s learning journey. Share your
documents today.
![Document Page](https://desklib.com/media/document/docfile/pages/forecastingcase-study-o0cu/2024/09/08/05602916-facd-40b1-a9b5-9bf760b25974-page-1.webp)
Part B
Secure Best Marks with AI Grader
Need help grading? Try our AI Grader for instant feedback on your assignments.
![Document Page](https://desklib.com/media/document/docfile/pages/forecastingcase-study-o0cu/2024/09/08/309d7d05-766c-48c6-af9e-7a0dc1daf2f4-page-2.webp)
(1)Answer the following questions
• (a)Average rating of CBC, ABN and BBS movies
• Average rating of CBC movies is 13.43 and same of ABN is 15.26
followed by mean value for BBS is 14.40. It can be said that mean rating
score is high in case of ABN then other networks. However, there is not
big difference between these networks.
• (a)Average rating of CBC, ABN and BBS movies
• Average rating of CBC movies is 13.43 and same of ABN is 15.26
followed by mean value for BBS is 14.40. It can be said that mean rating
score is high in case of ABN then other networks. However, there is not
big difference between these networks.
![Document Page](https://desklib.com/media/document/docfile/pages/forecastingcase-study-o0cu/2024/09/08/5d422567-9543-4d8c-a840-67ecf6dd2474-page-3.webp)
(b)Comment on network doing best
Average rating of CBC 13.43333
Average rating of ABN 15.26842
Average rating of BBS 14.405
Average rating of CBC 13.43333
Average rating of ABN 15.26842
Average rating of BBS 14.405
![Document Page](https://desklib.com/media/document/docfile/pages/forecastingcase-study-o0cu/2024/09/08/b39a203f-9855-4806-8793-c6228bf950b5-page-4.webp)
Continue
• Interpretation
• On basis of table it can be said that mean score is high in case of
ABN and its rating is also deviating at fast rate then other networks.
However, in terms of rating there is no big difference among these
networks. If standard deviation and minimum as well as maximum range
will be compared with each other similar results will be obtained. Hence,
it can be said that almost same performance is given by all these networks.
Secure Best Marks with AI Grader
Need help grading? Try our AI Grader for instant feedback on your assignments.
![Document Page](https://desklib.com/media/document/docfile/pages/forecastingcase-study-o0cu/2024/09/08/bb8af309-b1df-4ae0-9efd-9d3ff08a5379-page-5.webp)
©Network doing best
• ABN is the network that is doing best in comparison to other networks as
mean score is high and maximum range is also higher then minimum
range relative to other networks. Hence, it can be said that ABN is
performing better than other networks.
• ABN is the network that is doing best in comparison to other networks as
mean score is high and maximum range is also higher then minimum
range relative to other networks. Hence, it can be said that ABN is
performing better than other networks.
![Document Page](https://desklib.com/media/document/docfile/pages/forecastingcase-study-o0cu/2024/09/08/45d778c9-4ce2-4757-885d-1efed6b821da-page-6.webp)
(2) Accuracy of forecast
Average rating of CBC Average rating of ABN Average rating of BBS
12.5
13
13.5
14
14.5
15
15.5
13.4333333333333
15.2684210526316
14.405
f(x) = 0.48583333333335 x + 13.3972514619883
R² = 0.280038372597832
Chart Title
Average rating of CBC Average rating of ABN Average rating of BBS
12.5
13
13.5
14
14.5
15
15.5
13.4333333333333
15.2684210526316
14.405
f(x) = 0.48583333333335 x + 13.3972514619883
R² = 0.280038372597832
Chart Title
![Document Page](https://desklib.com/media/document/docfile/pages/forecastingcase-study-o0cu/2024/09/08/f65035d2-052a-4100-acf7-3b29c92f893b-page-7.webp)
Continue
• There is lack of accuracy of forecast as it can be observed that value of R
square is 0.28 which is very low. Hence, this model cannot make accurate
forecast in respect to variable and cannot be used to make prediction.
• There is lack of accuracy of forecast as it can be observed that value of R
square is 0.28 which is very low. Hence, this model cannot make accurate
forecast in respect to variable and cannot be used to make prediction.
Paraphrase This Document
Need a fresh take? Get an instant paraphrase of this document with our AI Paraphraser
![Document Page](https://desklib.com/media/document/docfile/pages/forecastingcase-study-o0cu/2024/09/08/8193e196-ac35-4d79-96d1-caa5e9b10980-page-8.webp)
(3) Hypothesis test
• (a)Null and alternative hypothesis
• H0: There is no significant mean difference between ratings of movies
with stars and without stars.
• H1: There is significant mean difference between ratings of movies with
stars and without stars.
• (a)Null and alternative hypothesis
• H0: There is no significant mean difference between ratings of movies
with stars and without stars.
• H1: There is significant mean difference between ratings of movies with
stars and without stars.
![Document Page](https://desklib.com/media/document/docfile/pages/forecastingcase-study-o0cu/2024/09/08/6532959f-f2a4-4b93-b447-8969c7296f31-page-9.webp)
(b)T test model
![Document Page](https://desklib.com/media/document/docfile/pages/forecastingcase-study-o0cu/2024/09/08/b2fb3953-2e99-4aa0-b4ee-5720429111f6-page-10.webp)
©Recommendation to executives
• There is no significant mean difference between CBC ratings in respect to
with and without star category as value of level of significance is
1.67>0.05. It is recommended that less number of stars must be hired in
order to promote movie because no difference is observed in case of stars
and without stars.
•
Secure Best Marks with AI Grader
Need help grading? Try our AI Grader for instant feedback on your assignments.
![Document Page](https://desklib.com/media/document/docfile/pages/forecastingcase-study-o0cu/2024/09/08/40ac9e82-d9ec-421a-8cb2-2c51e0d0203f-page-11.webp)
(4) Linear regression model
![Document Page](https://desklib.com/media/document/docfile/pages/forecastingcase-study-o0cu/2024/09/08/81fec34b-3a56-4b05-86bb-b790d98c68b5-page-12.webp)
(a)Impact on IV on DV
• Fact component have impact on rating then stars. With change in fact 0.97
point change comes in rating and with change in stars 0.007 point change
comes in rating of movies. Thus, facts have more impact on movie then
stars.
• Fact component have impact on rating then stars. With change in fact 0.97
point change comes in rating and with change in stars 0.007 point change
comes in rating of movies. Thus, facts have more impact on movie then
stars.
![Document Page](https://desklib.com/media/document/docfile/pages/forecastingcase-study-o0cu/2024/09/08/74514857-1e10-4a4d-be27-e3396bb669d4-page-13.webp)
(b)Explanation of rating by regression analysis
0 0.2 0.4 0.6 0.8 1 1.2
0
5
10
15
20
25
Stars Line Fit Plot
Rating
Predicted Rating
Stars
Rating
0 0.2 0.4 0.6 0.8 1 1.2
0
5
10
15
20
25
Stars Line Fit Plot
Rating
Predicted Rating
Stars
Rating
Paraphrase This Document
Need a fresh take? Get an instant paraphrase of this document with our AI Paraphraser
![Document Page](https://desklib.com/media/document/docfile/pages/forecastingcase-study-o0cu/2024/09/08/69486ae2-0181-4fd2-9ffe-86db799a761b-page-14.webp)
Continue
0 0.2 0.4 0.6 0.8 1 1.2
0
5
10
15
20
25
Fact Line Fit Plot
Rating
Predicted Rating
Fact
Rating
0 0.2 0.4 0.6 0.8 1 1.2
0
5
10
15
20
25
Fact Line Fit Plot
Rating
Predicted Rating
Fact
Rating
![Document Page](https://desklib.com/media/document/docfile/pages/forecastingcase-study-o0cu/2024/09/08/33db39a4-07c0-49fd-9d7e-5578c2f766c2-page-15.webp)
Continue
• Model cannot make accurate prediction as it can be observed that value of
R square of model is only 0.07 which is very low. Hence, model cannot
make accurate prediction (Frost., 2014). It can be observed that data
points are far away from regression line.
•
• Model cannot make accurate prediction as it can be observed that value of
R square of model is only 0.07 which is very low. Hence, model cannot
make accurate prediction (Frost., 2014). It can be observed that data
points are far away from regression line.
•
![Document Page](https://desklib.com/media/document/docfile/pages/forecastingcase-study-o0cu/2024/09/08/f620bf3d-bb5a-4b54-b62a-4ae990e0bac6-page-16.webp)
© IV and relationship to DV
• Both IV does not have significant relationship as it can be observed that
value of level of significance is 0.99>0.05 for stars and same is 0.17>0.05
for facts. Hence, it can be said that these IV does not have significant
impact on DV.
• Both IV does not have significant relationship as it can be observed that
value of level of significance is 0.99>0.05 for stars and same is 0.17>0.05
for facts. Hence, it can be said that these IV does not have significant
impact on DV.
Secure Best Marks with AI Grader
Need help grading? Try our AI Grader for instant feedback on your assignments.
![Document Page](https://desklib.com/media/document/docfile/pages/forecastingcase-study-o0cu/2024/09/08/525092f4-b1c8-4299-ab5e-be0d18664e37-page-17.webp)
REFERENCE
• Frost., J., 2014. [Online]. How to Interpret a Regression Model with Low
R-squared and Low P values. Available through :<
http://blog.minitab.com/blog/adventures-in-statistics-2/how-to-interpret-a-
regression-model-with-low-r-squared-and-low-p-values>.
•
• Frost., J., 2014. [Online]. How to Interpret a Regression Model with Low
R-squared and Low P values. Available through :<
http://blog.minitab.com/blog/adventures-in-statistics-2/how-to-interpret-a-
regression-model-with-low-r-squared-and-low-p-values>.
•
1 out of 17
Related Documents
![[object Object]](/_next/image/?url=%2F_next%2Fstatic%2Fmedia%2Flogo.6d15ce61.png&w=640&q=75)
Your All-in-One AI-Powered Toolkit for Academic Success.
+13062052269
info@desklib.com
Available 24*7 on WhatsApp / Email
Unlock your academic potential
© 2024 | Zucol Services PVT LTD | All rights reserved.