Foundation Degree in Business and Management
VerifiedAdded on 2022/04/28
|17
|3984
|39
AI Summary
The business report will be assessed using a variety of financial methodologies, including investment appraisals from a number of different enterprises. The PBP and NPV techniques will be used to determine which investment project is most suitable for the investors out of seven options. The most prospective initiatives are Projects A and G, which are perfect for investment in K Plc.
Contribute Materials
Your contribution can guide someone’s learning journey. Share your
documents today.
Foundation Degree in Business and Management (Year 2)
Business Finance (BMS512)
Title: Business Report
Words: 2870
1
Business Finance (BMS512)
Title: Business Report
Words: 2870
1
Secure Best Marks with AI Grader
Need help grading? Try our AI Grader for instant feedback on your assignments.
Introduction......................................................................................................................................4
Task A Table of Contents
.........................................................................................................................................................5
a) Payback Period for All Projects...............................................................................................5
b) Net Present Value for All Projects..........................................................................................5
c) Ranking the Projects Using PBP and NPV Values.................................................................6
d) The Selection of the Appropriate Project for Investment Decision (Mutually Exclusive).....6
e) Discussing Strengths and Weaknesses of PBP and NPV Methods for Investment Appraisal 7
Payback Period........................................................................................................................7
Net Present Value........................................................................................................................7
f) Five Qualitative Factors for Directors Before Making Investment Decision..........................8
Task B..............................................................................................................................................9
a) Suggesting Three Alternative Methods of Funding for K Plc.................................................9
b) Link between the above Financing Decision and Investment Decision..................................9
Task C............................................................................................................................................10
a) Preparing a Variance Analysis Statement of The Variable Cost Elements...........................10
b) Suggesting Possible Explanations for the Variances Identified............................................11
Task D............................................................................................................................................12
Distinguishing between Centralised and Decentralised Procurement.......................................12
Benefits of Centralised and Decentralised Purchasing..............................................................13
Conclusion.....................................................................................................................................15
References......................................................................................................................................16
2

Table of Figures
Figure 1: Payback Period for all Projects (source: self-calculated).................................................5
Figure 2: Net Present Value for All Projects (Source: self-calculated)...........................................5
Figure 3: Variance Analysis for K plc (source: self-included)......................................................11
3
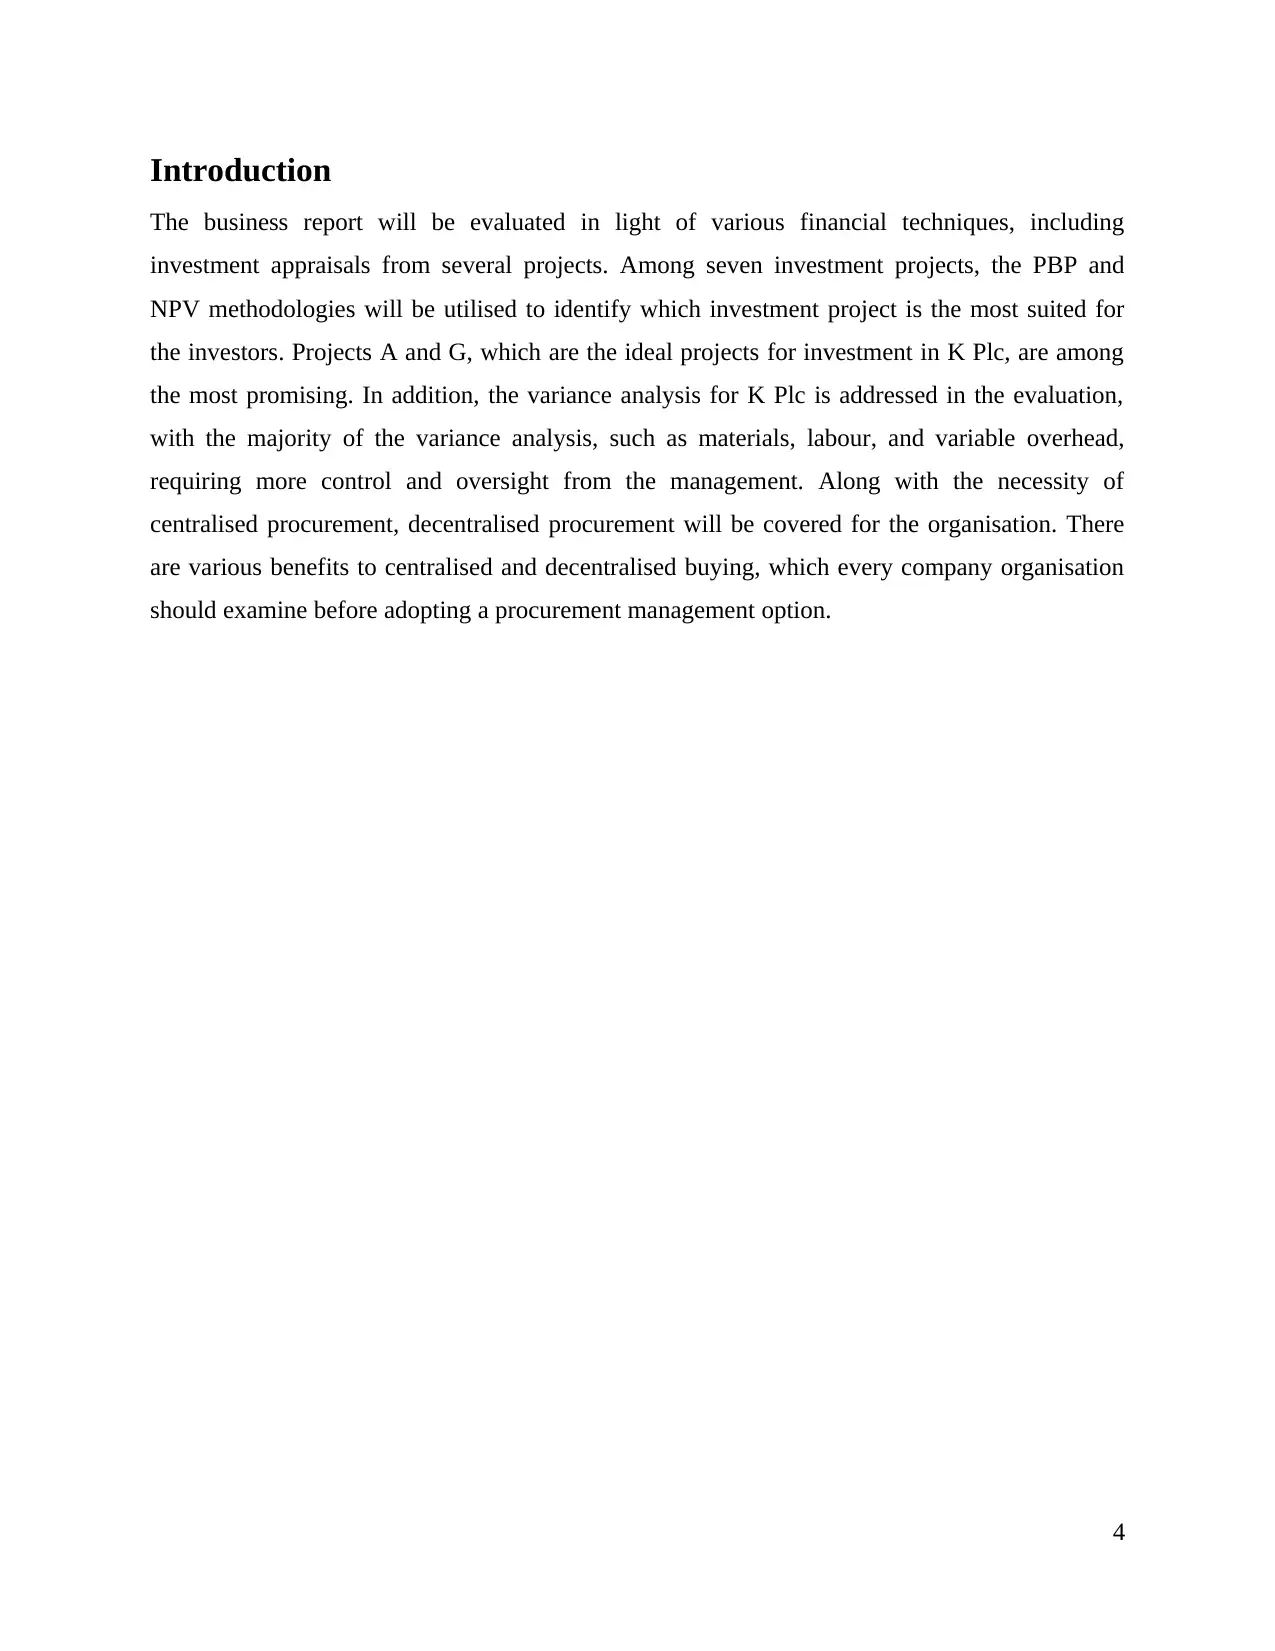
Introduction
The business report will be evaluated in light of various financial techniques, including
investment appraisals from several projects. Among seven investment projects, the PBP and
NPV methodologies will be utilised to identify which investment project is the most suited for
the investors. Projects A and G, which are the ideal projects for investment in K Plc, are among
the most promising. In addition, the variance analysis for K Plc is addressed in the evaluation,
with the majority of the variance analysis, such as materials, labour, and variable overhead,
requiring more control and oversight from the management. Along with the necessity of
centralised procurement, decentralised procurement will be covered for the organisation. There
are various benefits to centralised and decentralised buying, which every company organisation
should examine before adopting a procurement management option.
4
Secure Best Marks with AI Grader
Need help grading? Try our AI Grader for instant feedback on your assignments.
Task A
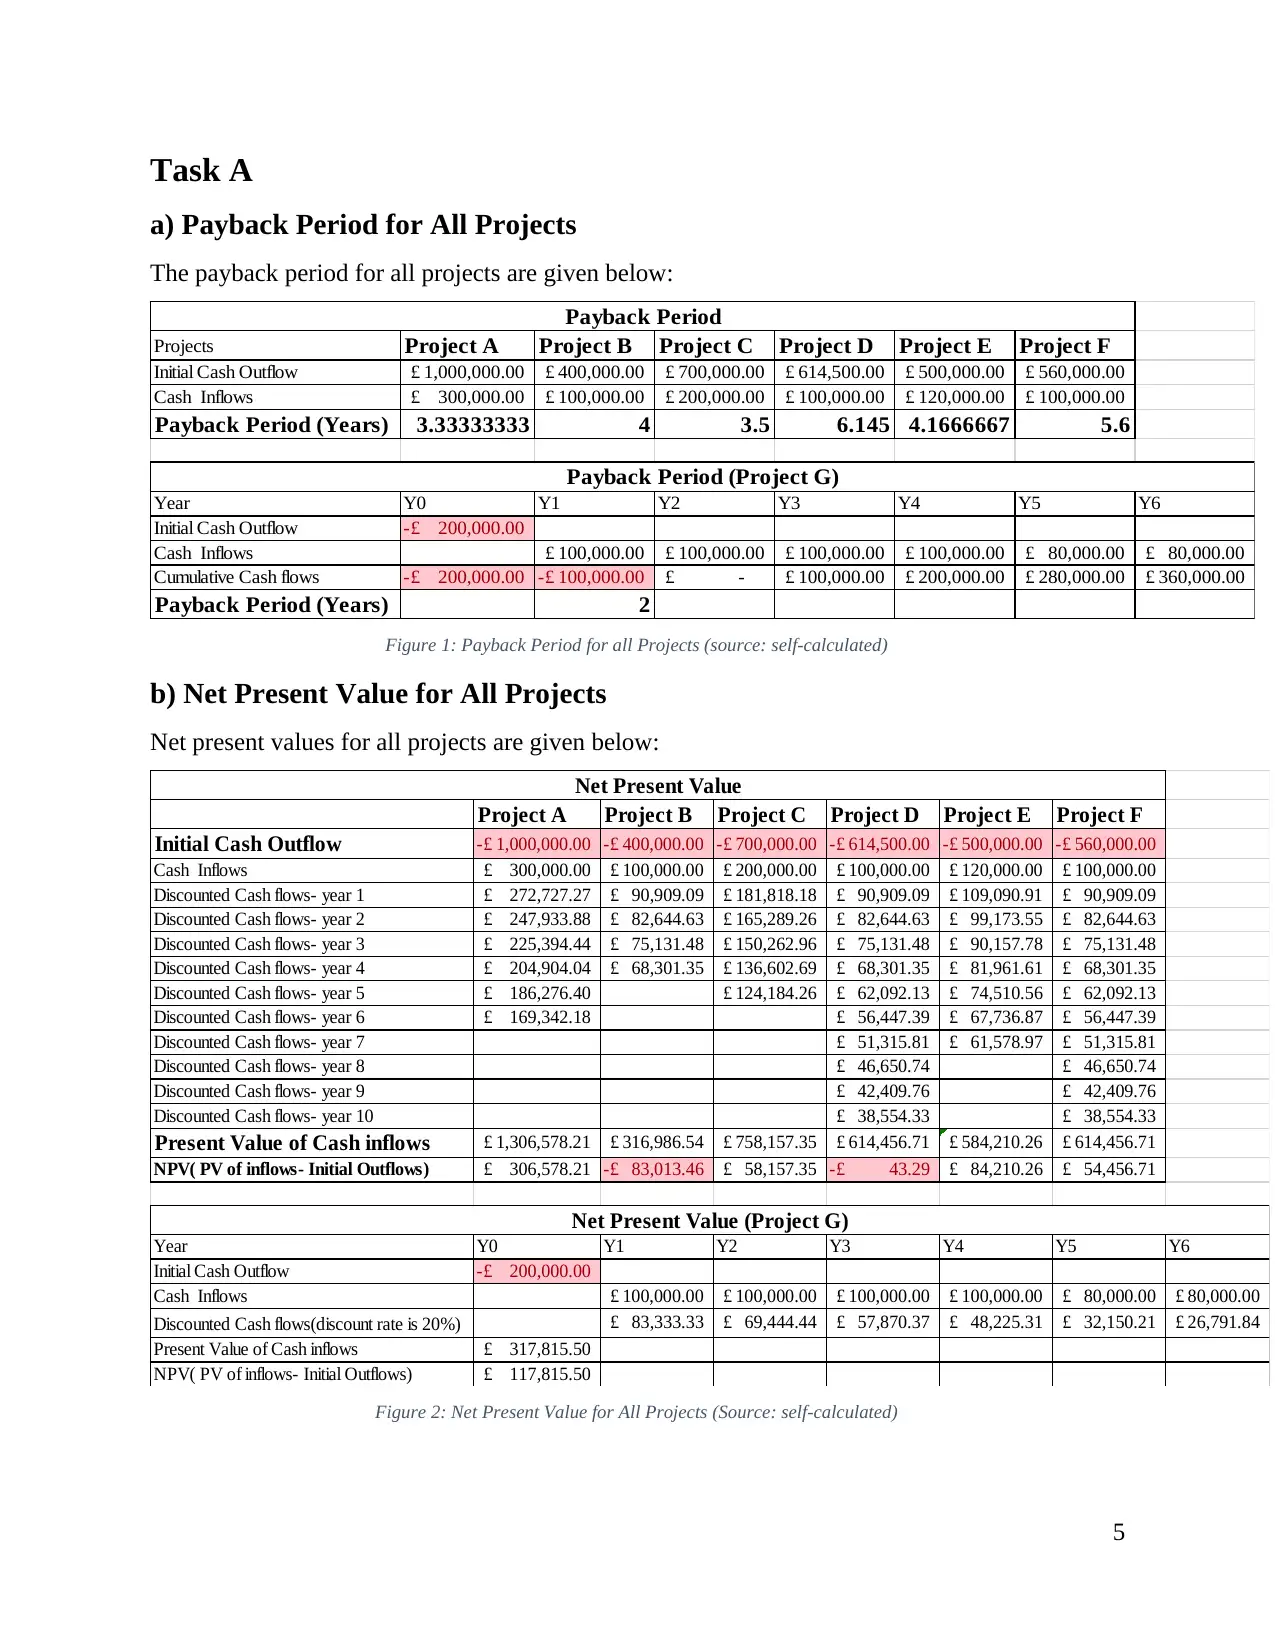
a) Payback Period for All Projects
The payback period for all projects are given below:
Projects Project A Project B Project C Project D Project E Project F
Initial Cash Outflow 1,000,000.00£ 400,000.00£ 700,000.00£ 614,500.00£ 500,000.00£ 560,000.00£
Cash Inflows 300,000.00£ 100,000.00£ 200,000.00£ 100,000.00£ 120,000.00£ 100,000.00£
Payback Period (Years) 3.33333333 4 3.5 6.145 4.1666667 5.6
Year Y0 Y1 Y2 Y3 Y4 Y5 Y6
Initial Cash Outflow 200,000.00-£
Cash Inflows 100,000.00£ 100,000.00£ 100,000.00£ 100,000.00£ 80,000.00£ 80,000.00£
Cumulative Cash flows 200,000.00-£ 100,000.00-£ -£ 100,000.00£ 200,000.00£ 280,000.00£ 360,000.00£
Payback Period (Years) 2
Payback Period
Payback Period (Project G)
Figure 1: Payback Period for all Projects (source: self-calculated)
b) Net Present Value for All Projects
Net present values for all projects are given below:
Project A Project B Project C Project D Project E Project F
Initial Cash Outflow 1,000,000.00-£ 400,000.00-£ 700,000.00-£ 614,500.00-£ 500,000.00-£ 560,000.00-£
Cash Inflows 300,000.00£ 100,000.00£ 200,000.00£ 100,000.00£ 120,000.00£ 100,000.00£
Discounted Cash flows- year 1 272,727.27£ 90,909.09£ 181,818.18£ 90,909.09£ 109,090.91£ 90,909.09£
Discounted Cash flows- year 2 247,933.88£ 82,644.63£ 165,289.26£ 82,644.63£ 99,173.55£ 82,644.63£
Discounted Cash flows- year 3 225,394.44£ 75,131.48£ 150,262.96£ 75,131.48£ 90,157.78£ 75,131.48£
Discounted Cash flows- year 4 204,904.04£ 68,301.35£ 136,602.69£ 68,301.35£ 81,961.61£ 68,301.35£
Discounted Cash flows- year 5 186,276.40£ 124,184.26£ 62,092.13£ 74,510.56£ 62,092.13£
Discounted Cash flows- year 6 169,342.18£ 56,447.39£ 67,736.87£ 56,447.39£
Discounted Cash flows- year 7 51,315.81£ 61,578.97£ 51,315.81£
Discounted Cash flows- year 8 46,650.74£ 46,650.74£
Discounted Cash flows- year 9 42,409.76£ 42,409.76£
Discounted Cash flows- year 10 38,554.33£ 38,554.33£
Present Value of Cash inflows 1,306,578.21£ 316,986.54£ 758,157.35£ 614,456.71£ 584,210.26£ 614,456.71£
NPV( PV of inflows- Initial Outflows) 306,578.21£ 83,013.46-£ 58,157.35£ 43.29-£ 84,210.26£ 54,456.71£
Year Y0 Y1 Y2 Y3 Y4 Y5 Y6
Initial Cash Outflow 200,000.00-£
Cash Inflows 100,000.00£ 100,000.00£ 100,000.00£ 100,000.00£ 80,000.00£ 80,000.00£
Discounted Cash flows(discount rate is 20%) 83,333.33£ 69,444.44£ 57,870.37£ 48,225.31£ 32,150.21£ 26,791.84£
Present Value of Cash inflows 317,815.50£
NPV( PV of inflows- Initial Outflows) 117,815.50£
Net Present Value
Net Present Value (Project G)
Figure 2: Net Present Value for All Projects (Source: self-calculated)
5
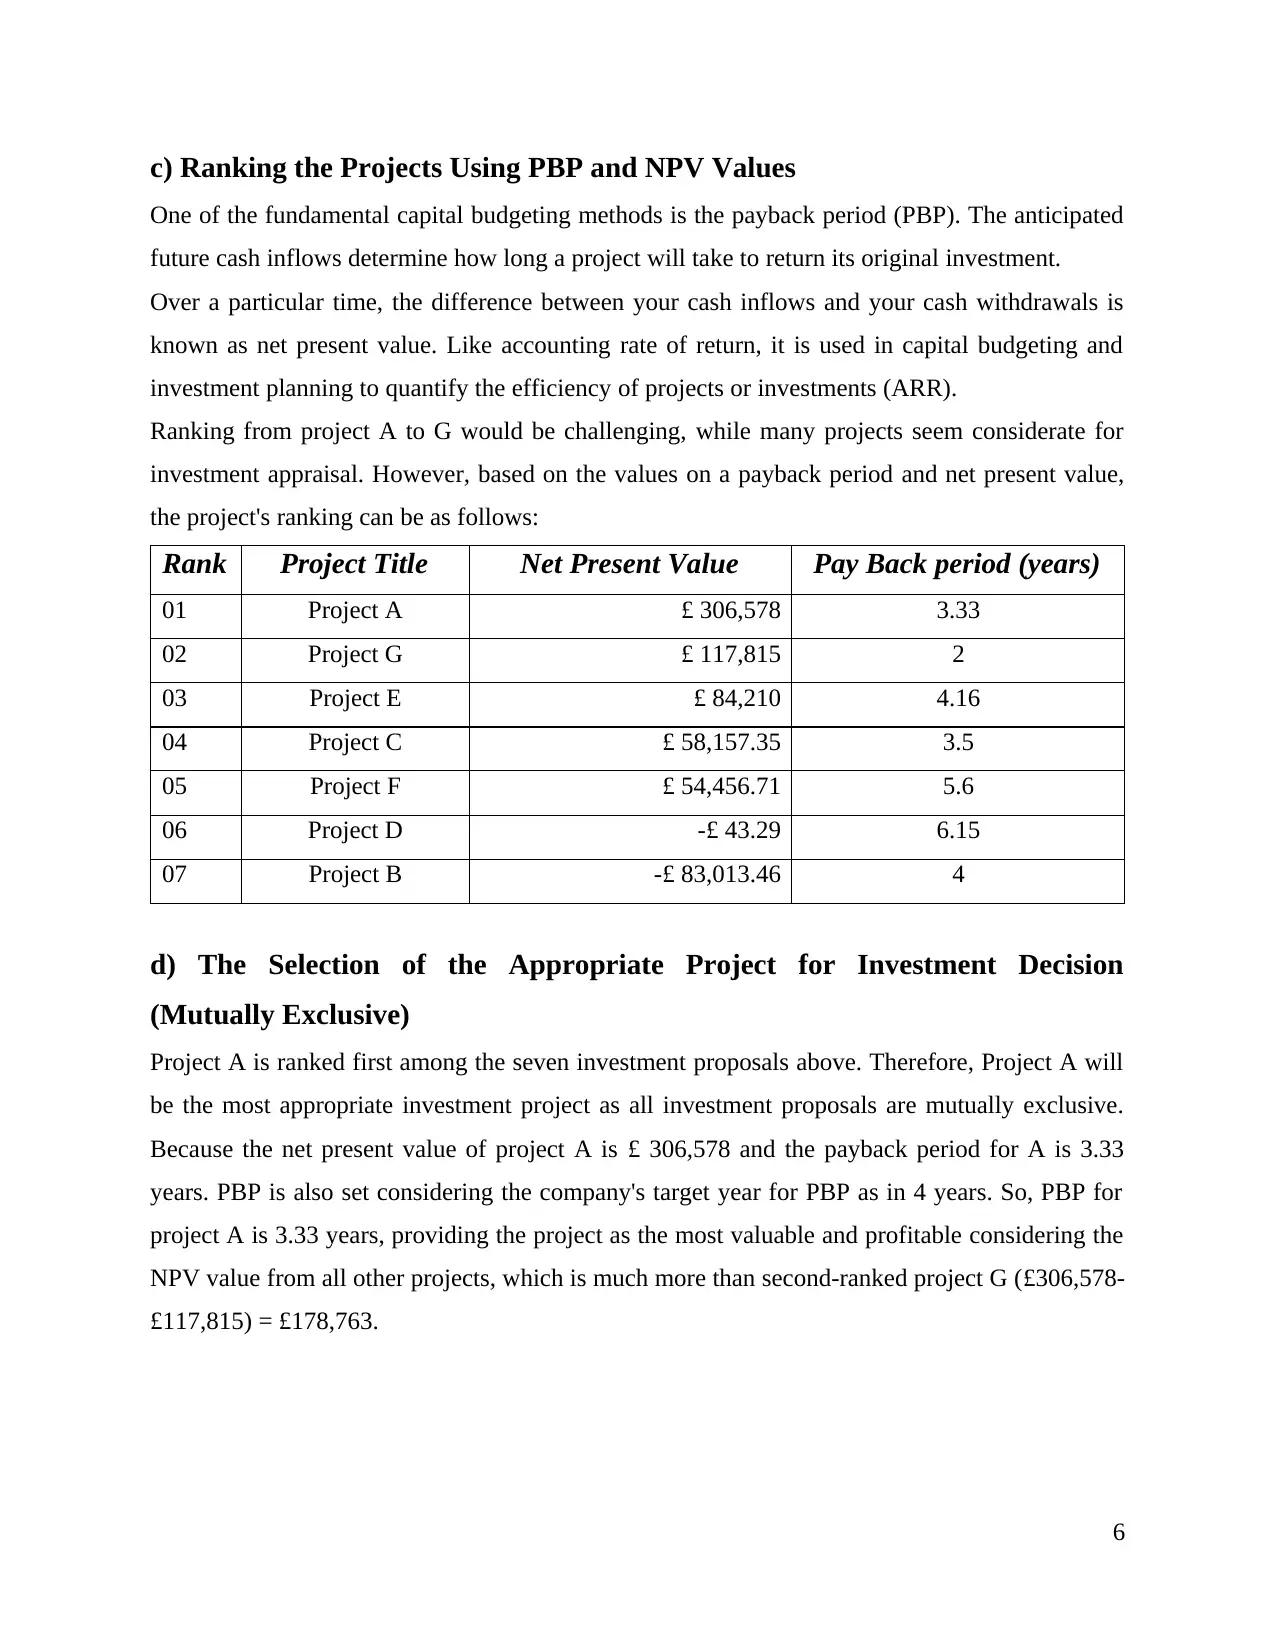
c) Ranking the Projects Using PBP and NPV Values
One of the fundamental capital budgeting methods is the payback period (PBP). The anticipated
future cash inflows determine how long a project will take to return its original investment.
Over a particular time, the difference between your cash inflows and your cash withdrawals is
known as net present value. Like accounting rate of return, it is used in capital budgeting and
investment planning to quantify the efficiency of projects or investments (ARR).
Ranking from project A to G would be challenging, while many projects seem considerate for
investment appraisal. However, based on the values on a payback period and net present value,
the project's ranking can be as follows:
Rank Project Title Net Present Value Pay Back period (years)
01 Project A £ 306,578 3.33
02 Project G £ 117,815 2
03 Project E £ 84,210 4.16
04 Project C £ 58,157.35 3.5
05 Project F £ 54,456.71 5.6
06 Project D -£ 43.29 6.15
07 Project B -£ 83,013.46 4
d) The Selection of the Appropriate Project for Investment Decision
(Mutually Exclusive)
Project A is ranked first among the seven investment proposals above. Therefore, Project A will
be the most appropriate investment project as all investment proposals are mutually exclusive.
Because the net present value of project A is £ 306,578 and the payback period for A is 3.33
years. PBP is also set considering the company's target year for PBP as in 4 years. So, PBP for
project A is 3.33 years, providing the project as the most valuable and profitable considering the
NPV value from all other projects, which is much more than second-ranked project G (£306,578-
£117,815) = £178,763.
6
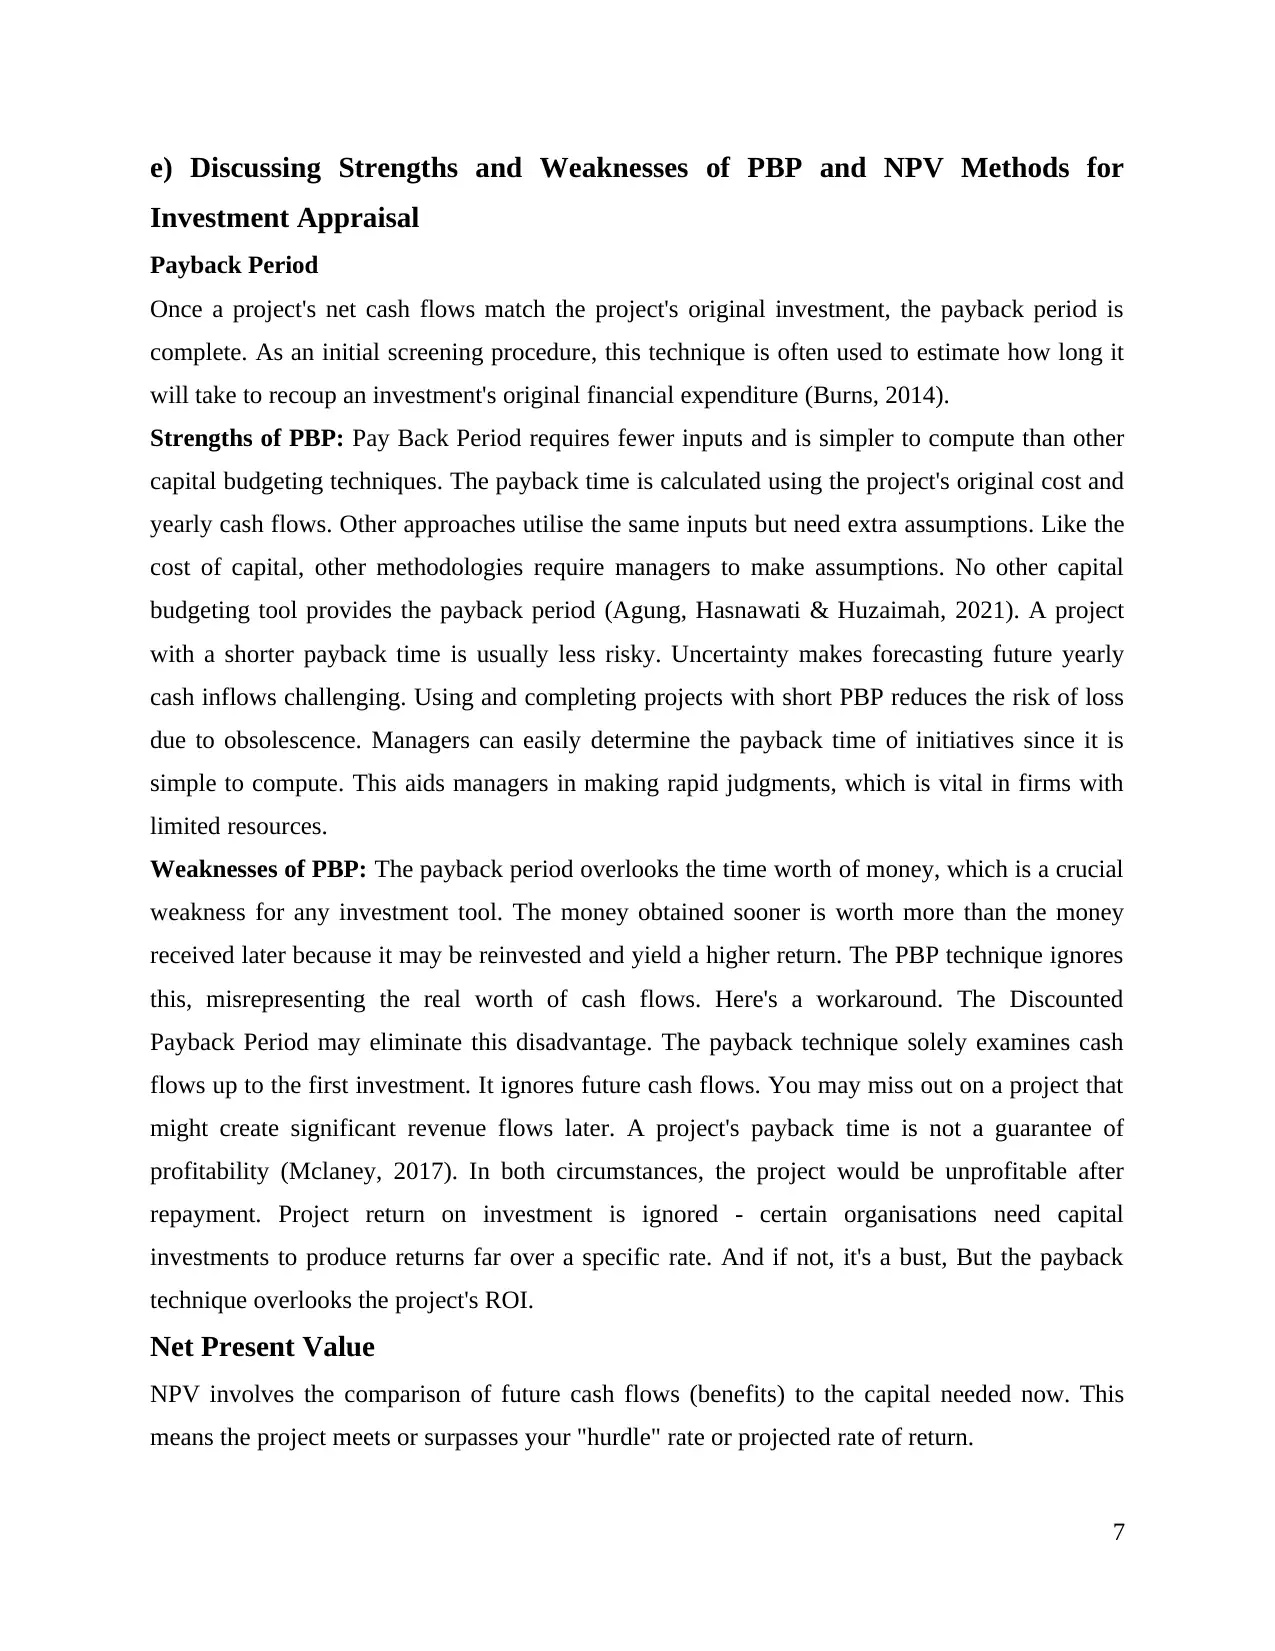
e) Discussing Strengths and Weaknesses of PBP and NPV Methods for
Investment Appraisal
Payback Period
Once a project's net cash flows match the project's original investment, the payback period is
complete. As an initial screening procedure, this technique is often used to estimate how long it
will take to recoup an investment's original financial expenditure (Burns, 2014).
Strengths of PBP: Pay Back Period requires fewer inputs and is simpler to compute than other
capital budgeting techniques. The payback time is calculated using the project's original cost and
yearly cash flows. Other approaches utilise the same inputs but need extra assumptions. Like the
cost of capital, other methodologies require managers to make assumptions. No other capital
budgeting tool provides the payback period (Agung, Hasnawati & Huzaimah, 2021). A project
with a shorter payback time is usually less risky. Uncertainty makes forecasting future yearly
cash inflows challenging. Using and completing projects with short PBP reduces the risk of loss
due to obsolescence. Managers can easily determine the payback time of initiatives since it is
simple to compute. This aids managers in making rapid judgments, which is vital in firms with
limited resources.
Weaknesses of PBP: The payback period overlooks the time worth of money, which is a crucial
weakness for any investment tool. The money obtained sooner is worth more than the money
received later because it may be reinvested and yield a higher return. The PBP technique ignores
this, misrepresenting the real worth of cash flows. Here's a workaround. The Discounted
Payback Period may eliminate this disadvantage. The payback technique solely examines cash
flows up to the first investment. It ignores future cash flows. You may miss out on a project that
might create significant revenue flows later. A project's payback time is not a guarantee of
profitability (Mclaney, 2017). In both circumstances, the project would be unprofitable after
repayment. Project return on investment is ignored - certain organisations need capital
investments to produce returns far over a specific rate. And if not, it's a bust, But the payback
technique overlooks the project's ROI.
Net Present Value
NPV involves the comparison of future cash flows (benefits) to the capital needed now. This
means the project meets or surpasses your "hurdle" rate or projected rate of return.
7
Paraphrase This Document
Need a fresh take? Get an instant paraphrase of this document with our AI Paraphraser
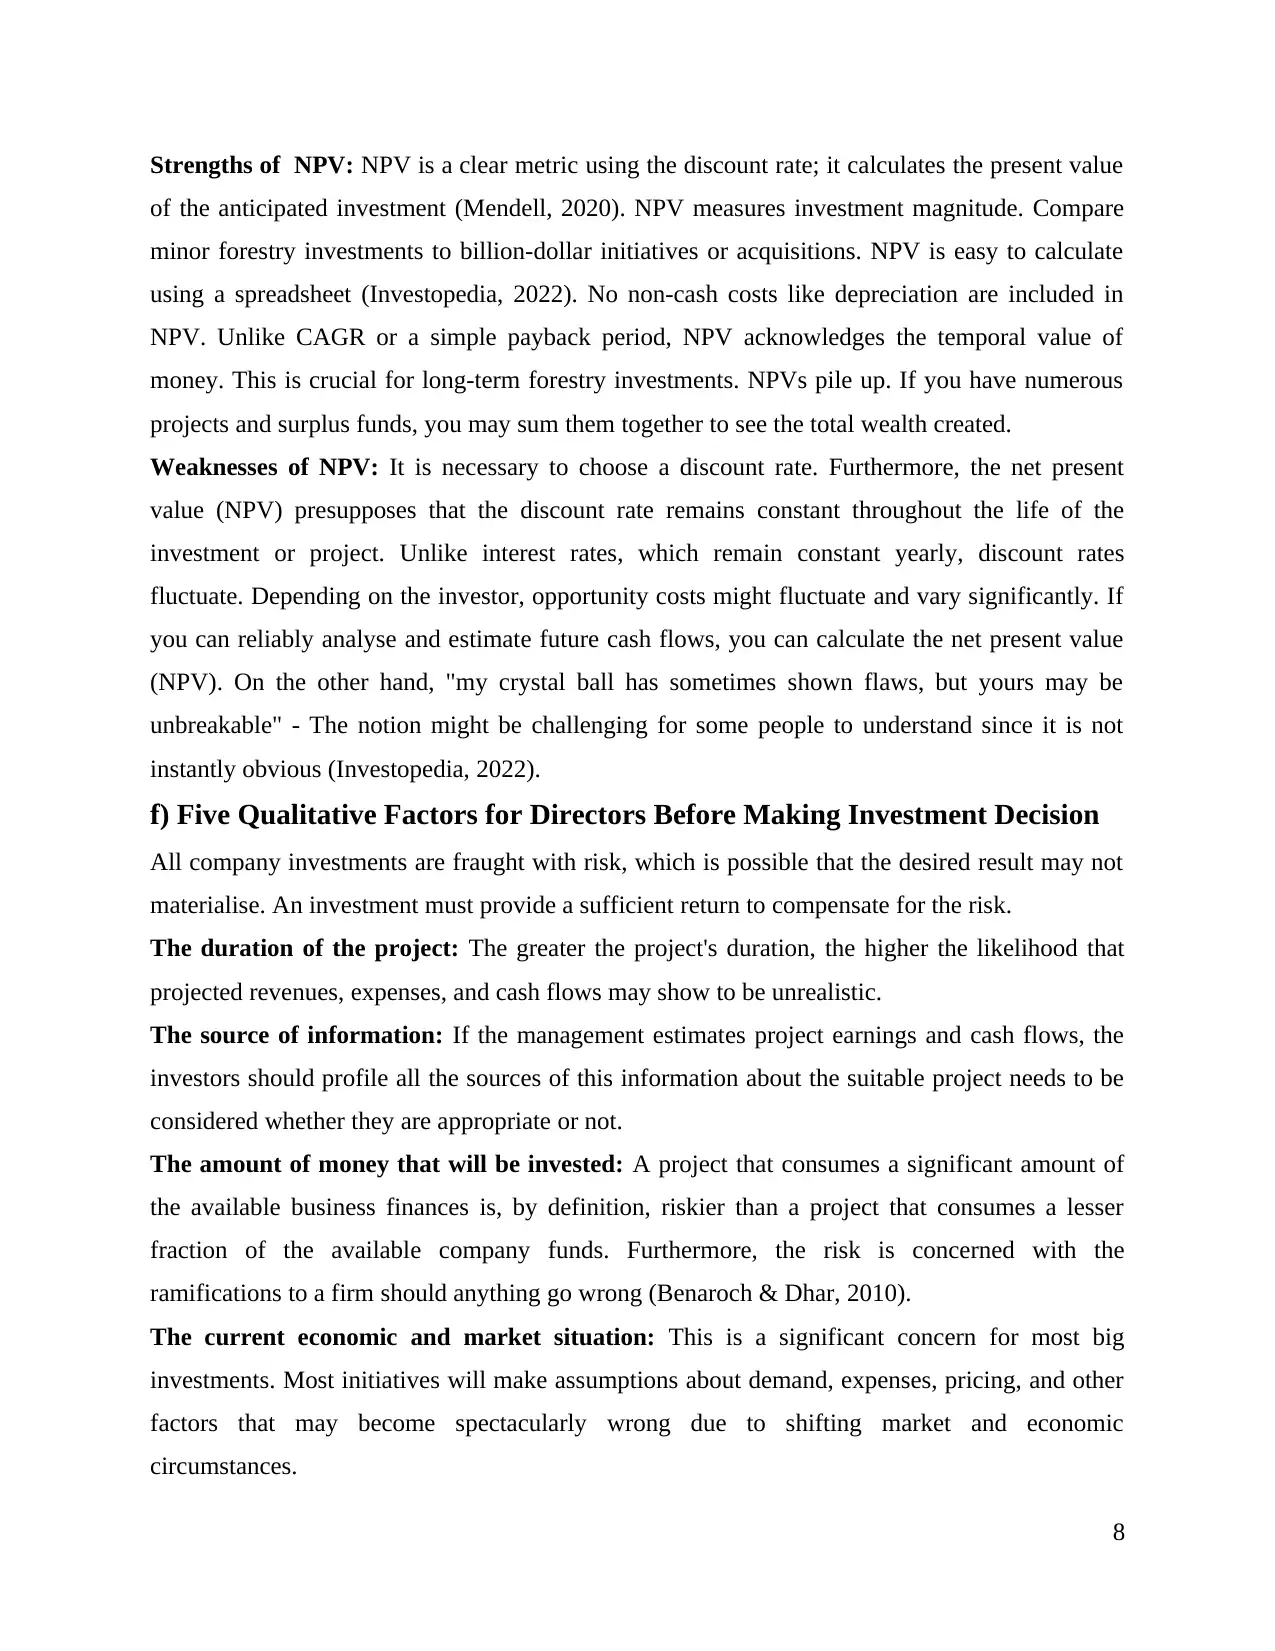
Strengths of NPV: NPV is a clear metric using the discount rate; it calculates the present value
of the anticipated investment (Mendell, 2020). NPV measures investment magnitude. Compare
minor forestry investments to billion-dollar initiatives or acquisitions. NPV is easy to calculate
using a spreadsheet (Investopedia, 2022). No non-cash costs like depreciation are included in
NPV. Unlike CAGR or a simple payback period, NPV acknowledges the temporal value of
money. This is crucial for long-term forestry investments. NPVs pile up. If you have numerous
projects and surplus funds, you may sum them together to see the total wealth created.
Weaknesses of NPV: It is necessary to choose a discount rate. Furthermore, the net present
value (NPV) presupposes that the discount rate remains constant throughout the life of the
investment or project. Unlike interest rates, which remain constant yearly, discount rates
fluctuate. Depending on the investor, opportunity costs might fluctuate and vary significantly. If
you can reliably analyse and estimate future cash flows, you can calculate the net present value
(NPV). On the other hand, "my crystal ball has sometimes shown flaws, but yours may be
unbreakable" - The notion might be challenging for some people to understand since it is not
instantly obvious (Investopedia, 2022).
f) Five Qualitative Factors for Directors Before Making Investment Decision
All company investments are fraught with risk, which is possible that the desired result may not
materialise. An investment must provide a sufficient return to compensate for the risk.
The duration of the project: The greater the project's duration, the higher the likelihood that
projected revenues, expenses, and cash flows may show to be unrealistic.
The source of information: If the management estimates project earnings and cash flows, the
investors should profile all the sources of this information about the suitable project needs to be
considered whether they are appropriate or not.
The amount of money that will be invested: A project that consumes a significant amount of
the available business finances is, by definition, riskier than a project that consumes a lesser
fraction of the available company funds. Furthermore, the risk is concerned with the
ramifications to a firm should anything go wrong (Benaroch & Dhar, 2010).
The current economic and market situation: This is a significant concern for most big
investments. Most initiatives will make assumptions about demand, expenses, pricing, and other
factors that may become spectacularly wrong due to shifting market and economic
circumstances.
8
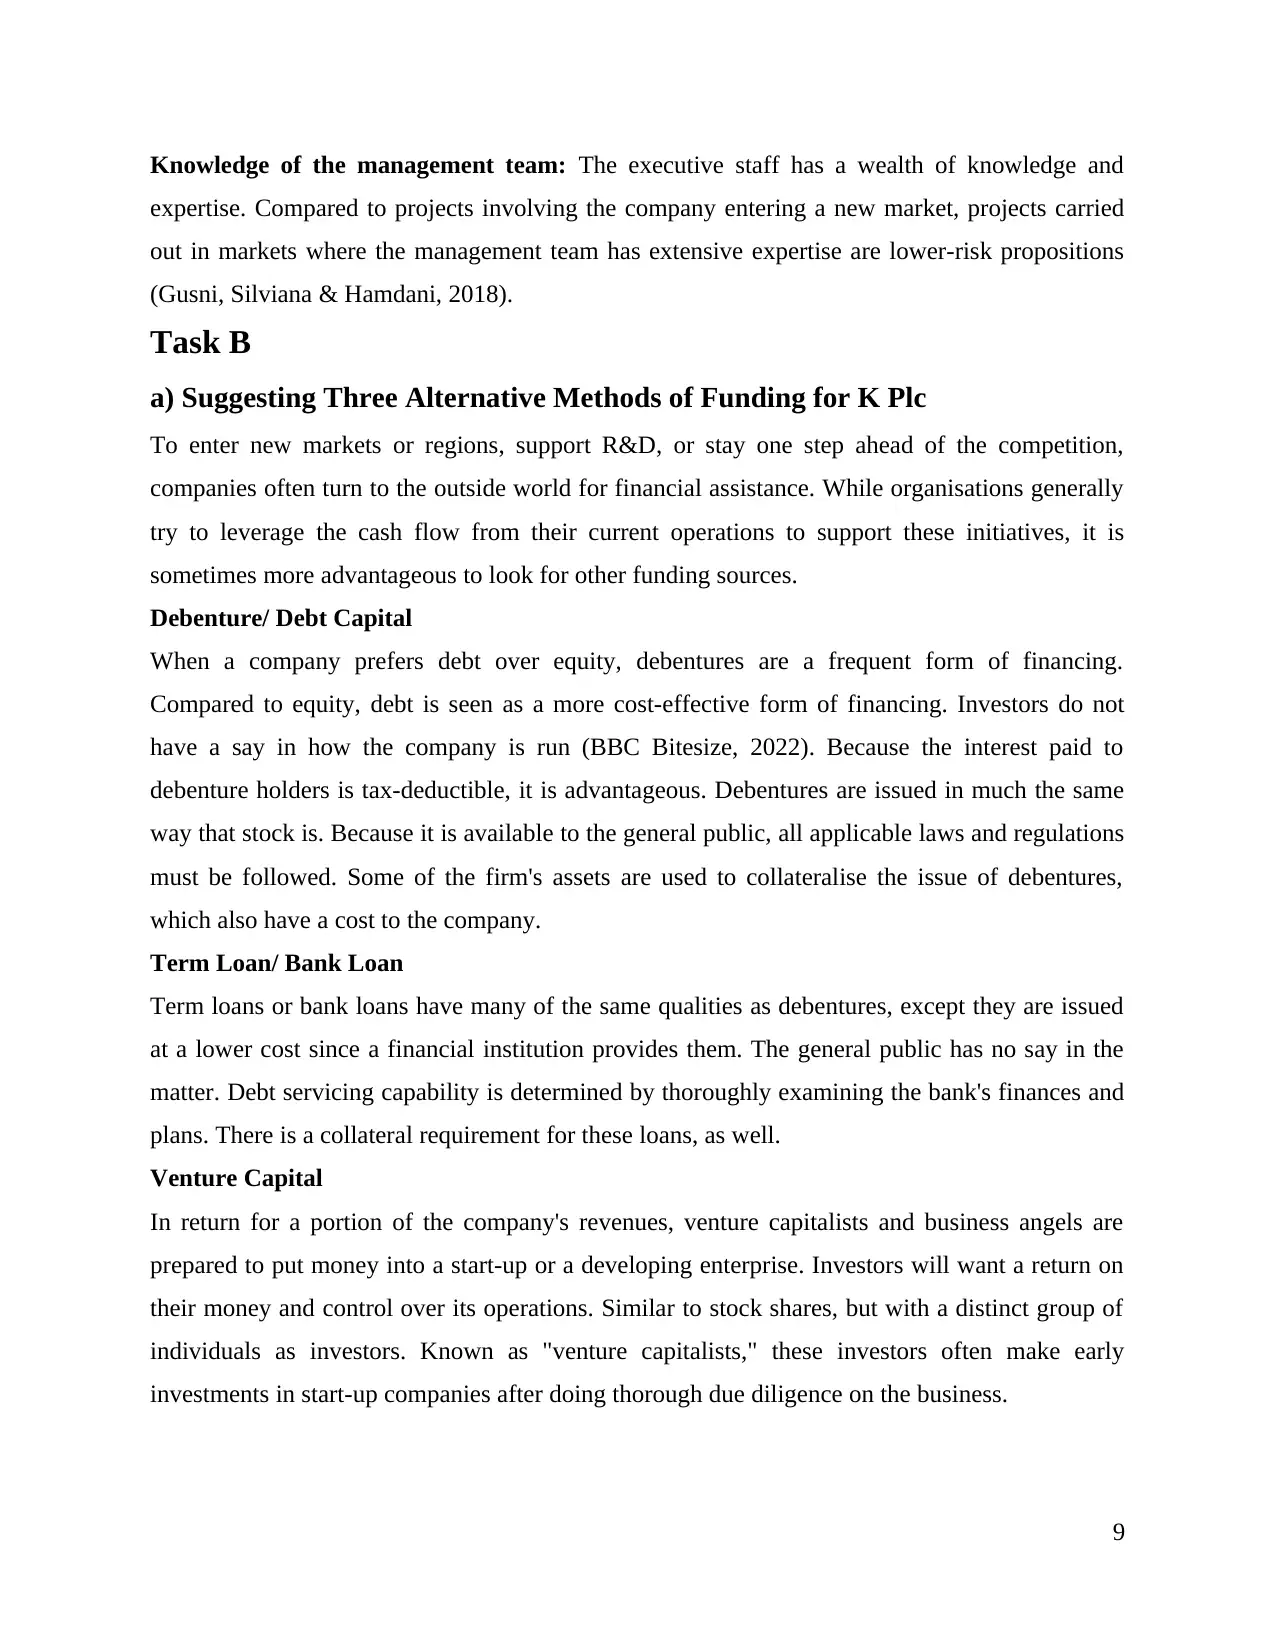
Knowledge of the management team: The executive staff has a wealth of knowledge and
expertise. Compared to projects involving the company entering a new market, projects carried
out in markets where the management team has extensive expertise are lower-risk propositions
(Gusni, Silviana & Hamdani, 2018).
Task B
a) Suggesting Three Alternative Methods of Funding for K Plc
To enter new markets or regions, support R&D, or stay one step ahead of the competition,
companies often turn to the outside world for financial assistance. While organisations generally
try to leverage the cash flow from their current operations to support these initiatives, it is
sometimes more advantageous to look for other funding sources.
Debenture/ Debt Capital
When a company prefers debt over equity, debentures are a frequent form of financing.
Compared to equity, debt is seen as a more cost-effective form of financing. Investors do not
have a say in how the company is run (BBC Bitesize, 2022). Because the interest paid to
debenture holders is tax-deductible, it is advantageous. Debentures are issued in much the same
way that stock is. Because it is available to the general public, all applicable laws and regulations
must be followed. Some of the firm's assets are used to collateralise the issue of debentures,
which also have a cost to the company.
Term Loan/ Bank Loan
Term loans or bank loans have many of the same qualities as debentures, except they are issued
at a lower cost since a financial institution provides them. The general public has no say in the
matter. Debt servicing capability is determined by thoroughly examining the bank's finances and
plans. There is a collateral requirement for these loans, as well.
Venture Capital
In return for a portion of the company's revenues, venture capitalists and business angels are
prepared to put money into a start-up or a developing enterprise. Investors will want a return on
their money and control over its operations. Similar to stock shares, but with a distinct group of
individuals as investors. Known as "venture capitalists," these investors often make early
investments in start-up companies after doing thorough due diligence on the business.
9
b) Link between the above Financing Decision and Investment Decision
Making smart financial decisions is critical to a company's function and flourishing. It is logical
to believe that private and public companies make specific investment and finance decisions
because of their differing levels of regulation and opportunity (Agung, Hasnawati & Huzaimah,
2021). Decision-making in financial management is a topic that occupies a significant place in
contemporary finance thought because it is critical to achieving goals such as maximisation of
profits and shareholder wealth while at the same time ensuring the long-term viability of
businesses and financial institutions (Drobetz, Janzen & Meier, 2016). Decisions on how to
improve shareholder wealth, boost profitability, and build financial strategies based on rules set
for the value-added market must be made by enterprises.
For any organisation like K Plc to develop or persist, it is critical to have a good investment,
finance, or dividend payout resolution. Investment and finance choices are two distinct types of
financial decisions (Chiarella, Pham, Sim & Tan, 2012). There are a variety of investment
projects to choose from, including short-term projects and long-term projects, and any
investment proposal put in front of the directors is evaluated and approved by the board of
directors based on specific methods for evaluating investment projects, which take into account
that the facility's primary goal is to increase the wealth of its owners (Nazar, 2021).
Task C
a) Preparing a Variance Analysis Statement of The Variable Cost Elements
A variance analysis statement for K Plc is attached in the following:
10
Secure Best Marks with AI Grader
Need help grading? Try our AI Grader for instant feedback on your assignments.
Details Per Kg Cost (£) Kg Amounts(£)
Standard Cost 3 8500 25500
Actual Cost 3.5 8500 29750
Quantitiy Variance 3 9000 27000 1,500.00-£ Unfavourable
UnfavourablePrice Variance
Direct Material Budget - S
4,250.00-£
Details Per Kg Cost (£) Kg Amounts(£)
Standard Cost 0.5 18000 9000
Actual Cost 1 18000 18000
Quantitiy Variance 0.5 18000 18000 9,000.00-£ Unfavourable
Price Variance 9,000.00-£ Unfavourable
Direct Material Budget - T
Details Per Hour Cost (£) Hours Amounts (£)
Standard Cost 10 28000 280000
Actual Cost 10.5 28000 294000
Efficiency Variance 10 27000 270000 10,000.00£ Unfavourable
Rate Variance 14,000.00£ Unfavourable
Direct Labour Budget
Details Per Hour Cost (£) Hours Amounts (£)
Standard Cost 6 28000 168000
Actual Cost 5.892857143 28000 165000
Volume Variance 6 27000 162000 6,000.00£ Unfavourable
Budget Variance 3,000.00-£ Favourable
Variable Overhead Budget
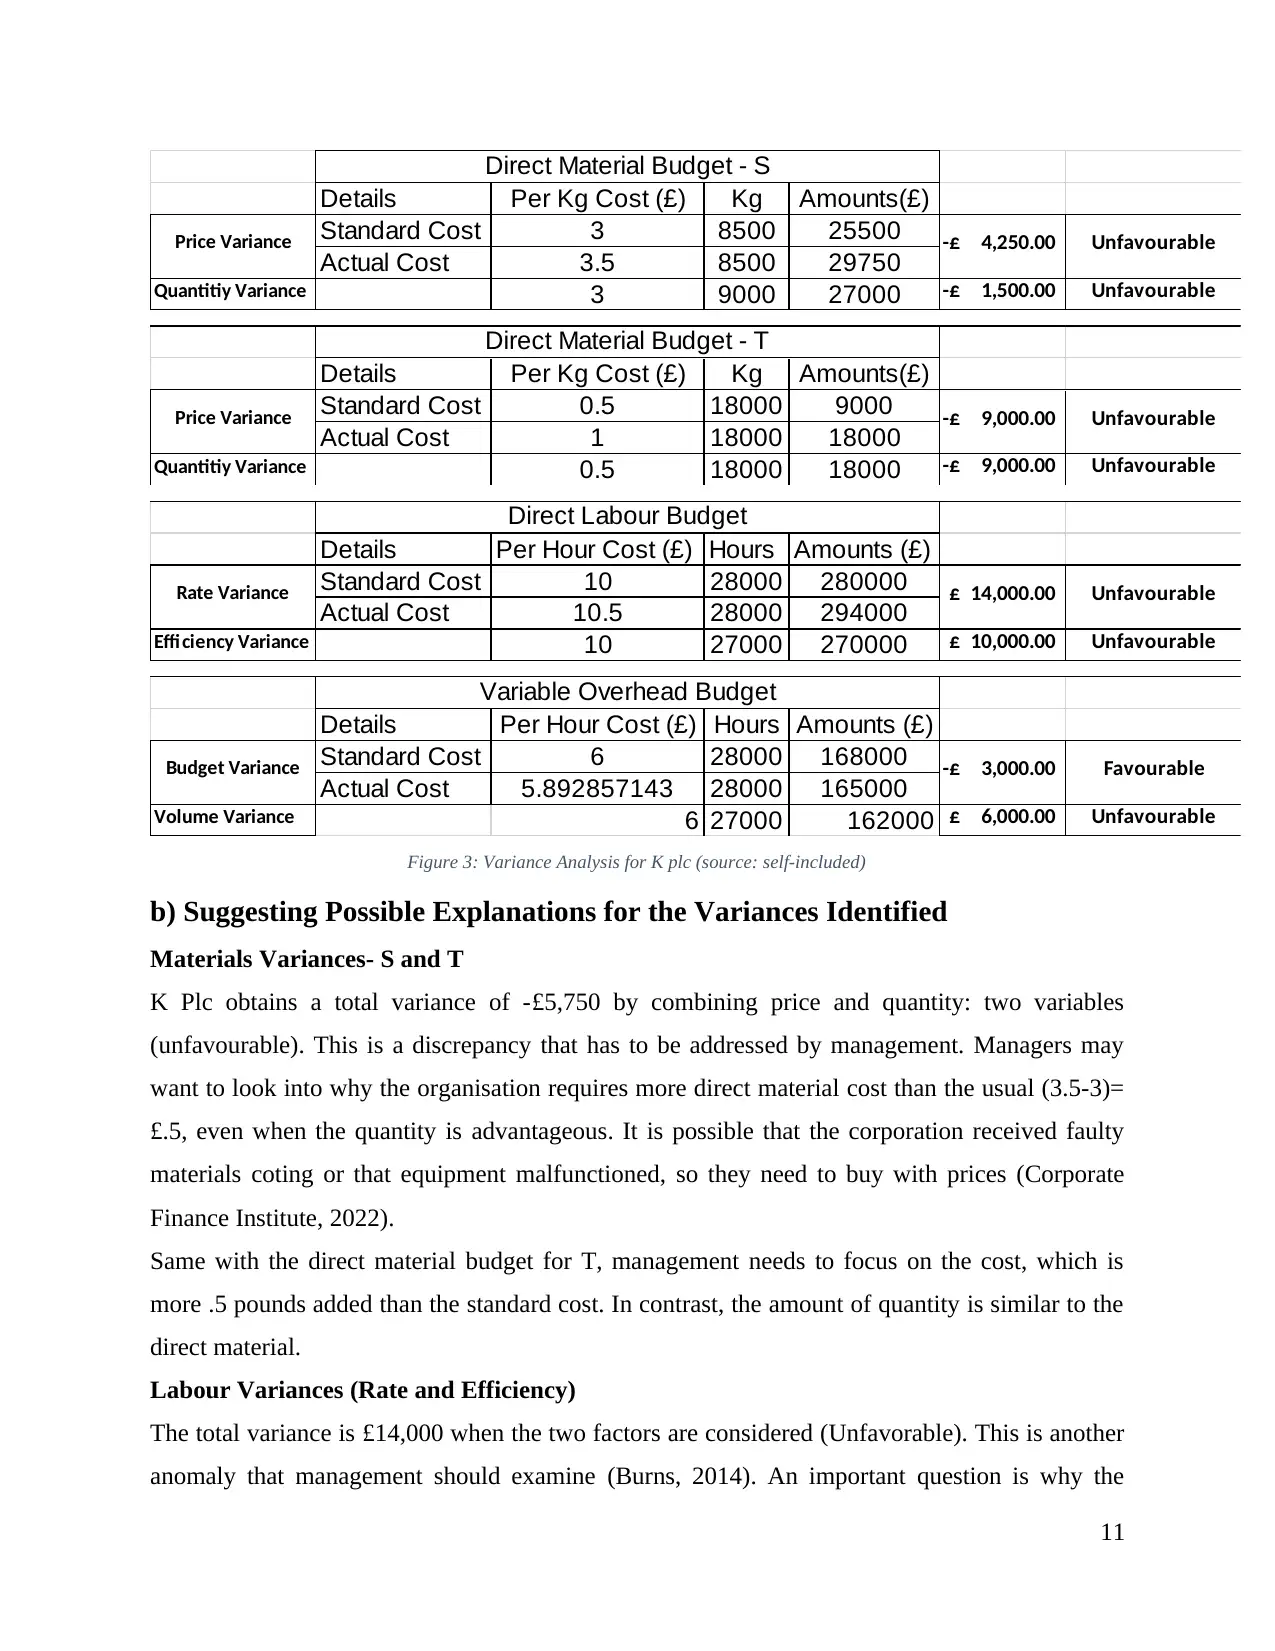
Figure 3: Variance Analysis for K plc (source: self-included)
b) Suggesting Possible Explanations for the Variances Identified
Materials Variances- S and T
K Plc obtains a total variance of -£5,750 by combining price and quantity: two variables
(unfavourable). This is a discrepancy that has to be addressed by management. Managers may
want to look into why the organisation requires more direct material cost than the usual (3.5-3)=
£.5, even when the quantity is advantageous. It is possible that the corporation received faulty
materials coting or that equipment malfunctioned, so they need to buy with prices (Corporate
Finance Institute, 2022).
Same with the direct material budget for T, management needs to focus on the cost, which is
more .5 pounds added than the standard cost. In contrast, the amount of quantity is similar to the
direct material.
Labour Variances (Rate and Efficiency)
The total variance is £14,000 when the two factors are considered (Unfavorable). This is another
anomaly that management should examine (Burns, 2014). An important question is why the
11
Standard Cost 3 8500 25500
Actual Cost 3.5 8500 29750
Quantitiy Variance 3 9000 27000 1,500.00-£ Unfavourable
UnfavourablePrice Variance
Direct Material Budget - S
4,250.00-£
Details Per Kg Cost (£) Kg Amounts(£)
Standard Cost 0.5 18000 9000
Actual Cost 1 18000 18000
Quantitiy Variance 0.5 18000 18000 9,000.00-£ Unfavourable
Price Variance 9,000.00-£ Unfavourable
Direct Material Budget - T
Details Per Hour Cost (£) Hours Amounts (£)
Standard Cost 10 28000 280000
Actual Cost 10.5 28000 294000
Efficiency Variance 10 27000 270000 10,000.00£ Unfavourable
Rate Variance 14,000.00£ Unfavourable
Direct Labour Budget
Details Per Hour Cost (£) Hours Amounts (£)
Standard Cost 6 28000 168000
Actual Cost 5.892857143 28000 165000
Volume Variance 6 27000 162000 6,000.00£ Unfavourable
Budget Variance 3,000.00-£ Favourable
Variable Overhead Budget
Figure 3: Variance Analysis for K plc (source: self-included)
b) Suggesting Possible Explanations for the Variances Identified
Materials Variances- S and T
K Plc obtains a total variance of -£5,750 by combining price and quantity: two variables
(unfavourable). This is a discrepancy that has to be addressed by management. Managers may
want to look into why the organisation requires more direct material cost than the usual (3.5-3)=
£.5, even when the quantity is advantageous. It is possible that the corporation received faulty
materials coting or that equipment malfunctioned, so they need to buy with prices (Corporate
Finance Institute, 2022).
Same with the direct material budget for T, management needs to focus on the cost, which is
more .5 pounds added than the standard cost. In contrast, the amount of quantity is similar to the
direct material.
Labour Variances (Rate and Efficiency)
The total variance is £14,000 when the two factors are considered (Unfavorable). This is another
anomaly that management should examine (Burns, 2014). An important question is why the
11
actual labour price is half a pound more than the norm and why an additional 1,000 hours of
manufacturing are necessary. In addition to variable overhead expenses, the column technique
may be used to track fixed overhead costs.
Variable Overhead Expenses
The overall unfavourable variance is £3,000 when the budget and volume variances are added
together. Again, this is something management should consider. This is another strange
occurrence that needs to be investigated by upper management. It's crucial to examine why the
additional variable expense is lower than the usual and why an extra 1,000 hours of manufacture
are required, which adds the more unfavourable costing in labour variance analysis and variable
overhead variance analysis.
Task D
Distinguishing between Centralised and Decentralised Procurement
Procurement may be centralised or decentralised, depending on the company's needs and the
location of the buying department. A leader's operational model will be evaluated as a company
grows and matures to see its performance. The differences between centralised and decentralised
procurement are discussed in the following.
Centralised procurement refers to buying control at the corporate level, while decentralised
procurement refers to purchasing across several business units and locations. CPOs must
regularly re-evaluate their structure and goals to align with stakeholders, particularly when
beginning any transformation initiative (Vagstad, 2010). Leaders will examine their operational
model as procurement organisations evolve to see its performance. In full centralisation, all
buying decisions are decided by a single entity, either at corporate headquarters or regional or
divisional levels. Centralised purchasing authority is better at expenditure management which
leads to scale advantages. Enhanced compliance and standardisation and a Dedicated buying
team are favourable possessions in the organisation's centralised procurement. A centralised
procurement system has better relationship management with important suppliers. Also, applying
category-wide strategies and tactics, centralised data and info management, better risk reduction,
integrated environmental, sustainability, and governance management can be more advantageous
in centralised procurement than decentralised procurement.
12
A completely decentralised procurement system means that purchases are made by each business
unit, functional group, or geographic entity on their dime. As a result, procurement operations
are dispersed over several nations and geographical areas (Vagstad, 2010). Decentralisation is
often an issue of practicality for big, multinational corporations. A corporation with operations
worldwide may find it impractical to funnel all purchases via a single location. Supplier variety
and the growth of small and medium-sized firms (SMEs) are better supported (OECD, 2000).
Purchase choices may be made more promptly to take advantage of seasonal discounts and
prevent stock-out situations.
It is more cost-efficient to maintain interpersonal interactions on a local level in most cases.
Decentralised structures may result in poor adherence to company policies and procedures.
Teams may be unable to exchange best business practices with other business units because of
their decentralised nature (Mclaney, 2017). Key worldwide suppliers are experiencing
difficulties, resulting in a lack of consistent performance. Compared to a centralised strategy, it is
probable that the overall operational expenses of procurement will be greater. Supplier
diversification and the utilisation of locally sourced alternatives are forwarded assistance in
business by taking the model. Personal contacts and supplier knowledge are important as
decisions are made more quickly. Delivery in a short period is another comfort in decentralised
procurement. Specialisation and the local community's needs also help the decentralised
procurement in the business more efficiently than centralised procurement.
Benefits of Centralised and Decentralised Purchasing
Purchasing all necessities via a single central site is "Centralised Purchase." A similar concept is
a Decentralised Purchase, which describes how each facility purchases its supplies. Neither a
centralised nor a decentralised purchasing system must be followed blindly. Consider these
criteria before deciding whether to centralise or decentralise your purchasing department.
Suitability of Centralised Purchasing
One or more manufacturing hubs or factories are close to one another.
The plant utilises a single basic raw material or production centre to manufacture
conventional items.
Improved management of materials and storage space arrangement.
High-tech skills are used
No need for a lot of money (Mclaney, 2017).
13
Paraphrase This Document
Need a fresh take? Get an instant paraphrase of this document with our AI Paraphraser

Better control over the use of resources.
The ability to conduct retail audits has been greatly improved.
Quick inventory with less expensive insurance premiums
Benefits of decentralised purchase
To begin with, the production hubs are spread apart.
Raw ingredients for various goods are produced at separate factories.
Internal transportation is less expensive.
Materials are readily available as needed.
It is less likely that the product will become obsolete.
14
Conclusion
The business report is assessed with various financial strategies, including investment appraisal
from several projects. The PBP and NPV methods determine the suitable investment project
among seven investment projects. Project A and G can be the most suitable investment in K Plc.
Also, variance analysis for K Plc is addressed in the assessment. Most of the variances like
materials, labour and variable overhead should be more controlled and checked by eh
management. The importance of centralised and decentralised procurement is also included for
the company. Centralised and decentralised purchasing has several benefits that any business
organisation should consider before making procurement management decisions.
15
References
Agung, G., Hasnawati, S. and Huzaimah, R., 2021. The Effect of Investment Decision,
Financing Decision, Dividend Policy on Firm Value. Jurnal Bisnis dan Manajemen, pp.1-12.
BBC Bitesize, 2022. Internal and external sources of finance - Sources of finance - Eduqas -
GCSE Business Revision - Eduqas - BBC Bitesize. [online] BBC Bitesize. Available at:
<https://www.bbc.co.uk/bitesize/guides/zj7yy9q/revision/1#:~:text=External%20sources%20of
%20finance%20refer,hire%20purchase%2C%20and%20government%20grants.> [Accessed 28
January 2022].
Benaroch, M. and Dhar, V., 2010. Controlling the complexity of investment decisions using
qualitative reasoning techniques. Decision Support Systems, 15(2), pp.115-131.
Burns, P., 2014. Business Finance. 7th ed. Elsevier Science, pp.49-189.
Chiarella, C., Pham, T., Sim, A. and Tan, M., 2012. The interaction of the financing and
investment decisions: Preliminary results in the Australian context. Asia Pacific Journal of
Management, 9(2), pp.209-229.
Corporate Finance Institute, 2022. Variance Analysis. [online] Corporate Finance Institute.
Available at: <https://corporatefinanceinstitute.com/resources/knowledge/accounting/variance-
analysis/> [Accessed 28 January 2022].
Drobetz, W., Janzen, M. and Meier, I., 2016. Investment and Financing Decisions of Private and
Public Firms. SSRN Electronic Journal,.
Gusni, Silviana and Hamdani, F., 2018. Factors affecting equity mutual fund performance:
evidence from Indonesia. Investment Management and Financial Innovations, 15(1), pp.1-9.
Investopedia, 2022. What Is the Formula for Calculating Net Present Value (NPV)?. [online]
Investopedia. Available at: <https://www.investopedia.com/ask/answers/032615/what-formula-
calculating-net-present-value-npv.asp> [Accessed 28 January 2022].
Mclaney, E., 2017. Business finance. 5th ed. Harlow, United Kingdom: Pearson Education
Limited, pp.71-212.
Mendell, B., 2020. Pros and Cons of Using Net Present Value (NPV) - Forisk. [online] Forisk.
Available at: <https://forisk.com/blog/2020/05/31/pros-and-cons-of-using-net-present-value-
npv/> [Accessed 28 January 2022].
16
Secure Best Marks with AI Grader
Need help grading? Try our AI Grader for instant feedback on your assignments.

Nazar, M., 2021. Does Financing Decisions Influence Investment Decisions? Empirical
Evidence from Sri Lanka. Journal of Economics, Finance and Accounting Studies, 3(1), pp.33-
38.
OECD, 2000. SIGMA Papers. Centralised and Decentralised Public Procurement,.
Vagstad, S., 2010. Centralised vs. decentralised procurement: Does dispersed information call
for decentralised decision-making?. International Journal of Industrial Organization, 18(6),
pp.949-963.
17
1 out of 17
Related Documents


Your All-in-One AI-Powered Toolkit for Academic Success.
+13062052269
info@desklib.com
Available 24*7 on WhatsApp / Email
![[object Object]](/_next/static/media/star-bottom.7253800d.svg)
Unlock your academic potential
© 2024 | Zucol Services PVT LTD | All rights reserved.