Foundations of Discrete Mathematics Assignment 2, Semester 2, 2019
VerifiedAdded on 2022/12/19
|12
|1896
|85
Homework Assignment
AI Summary
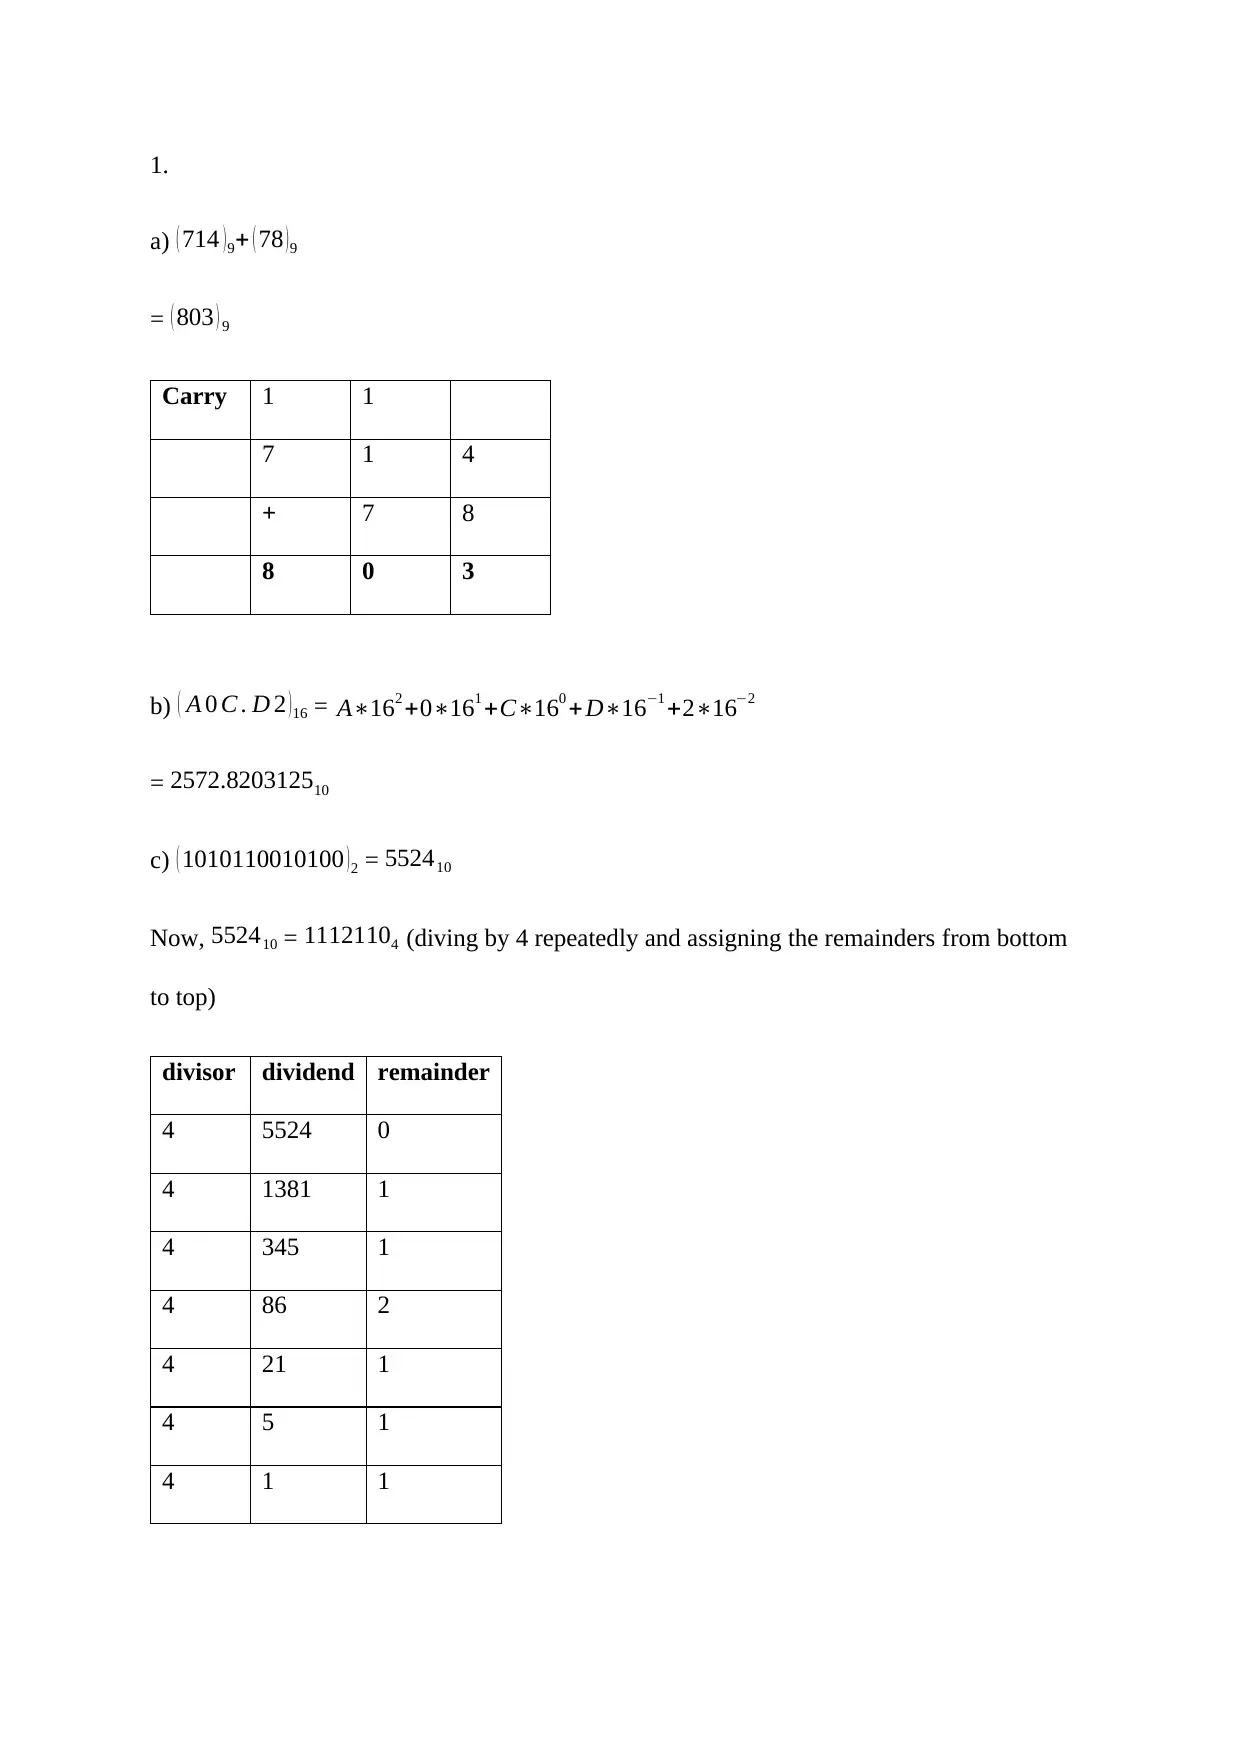
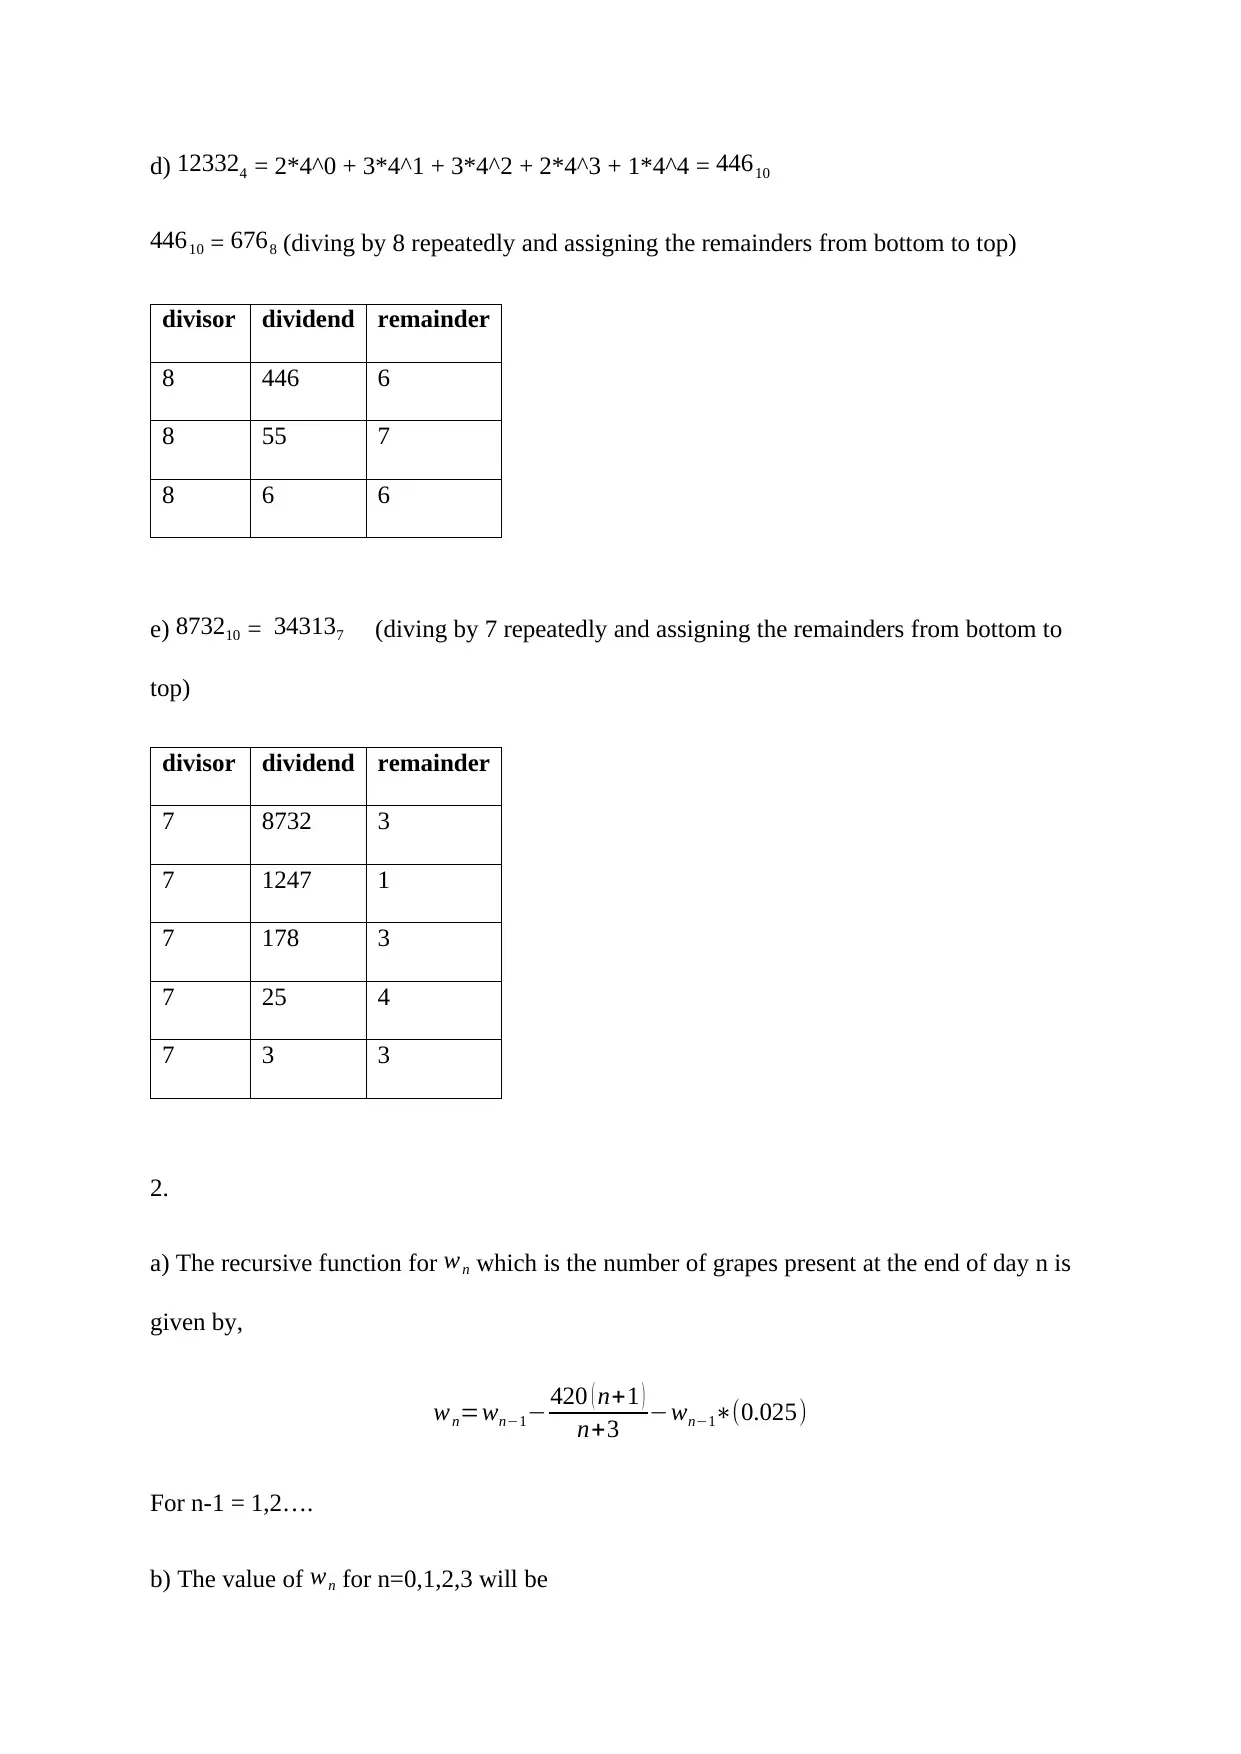
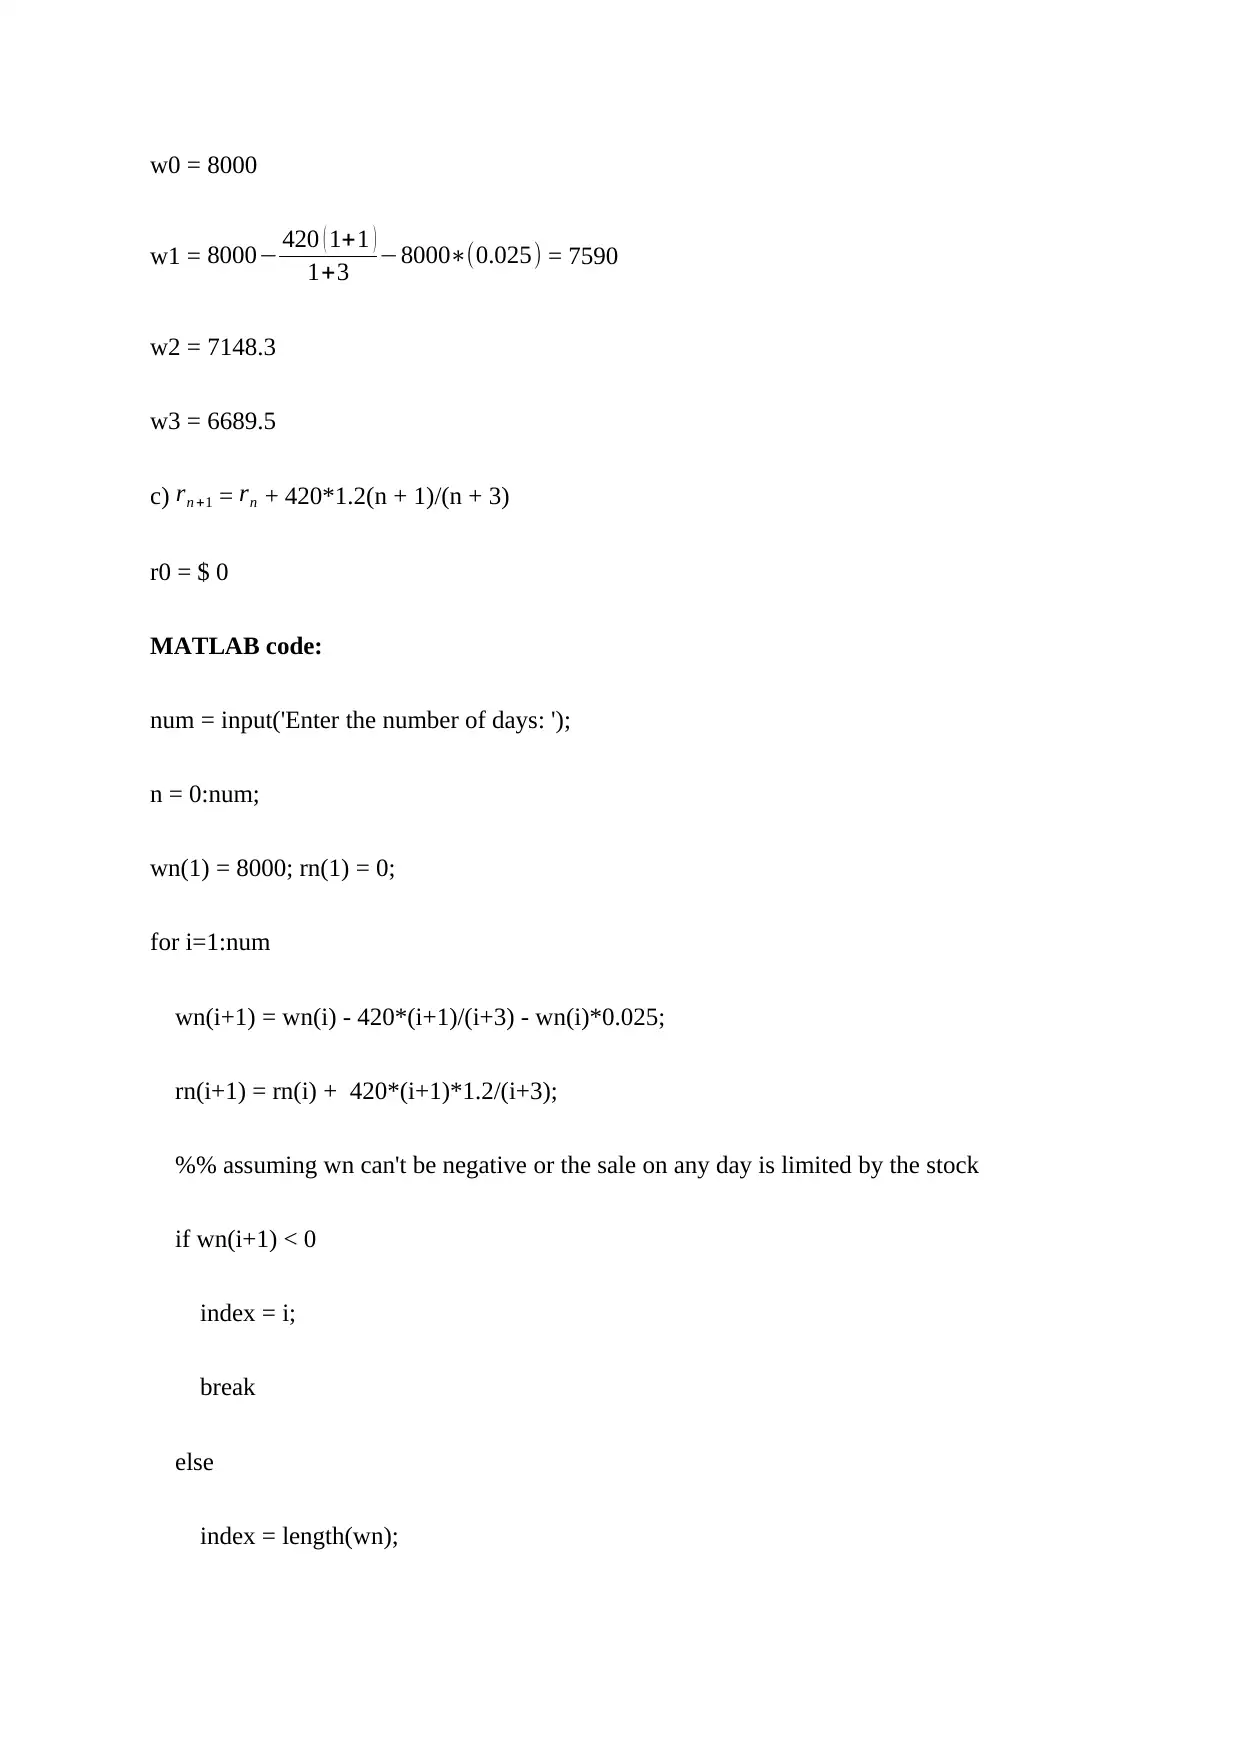
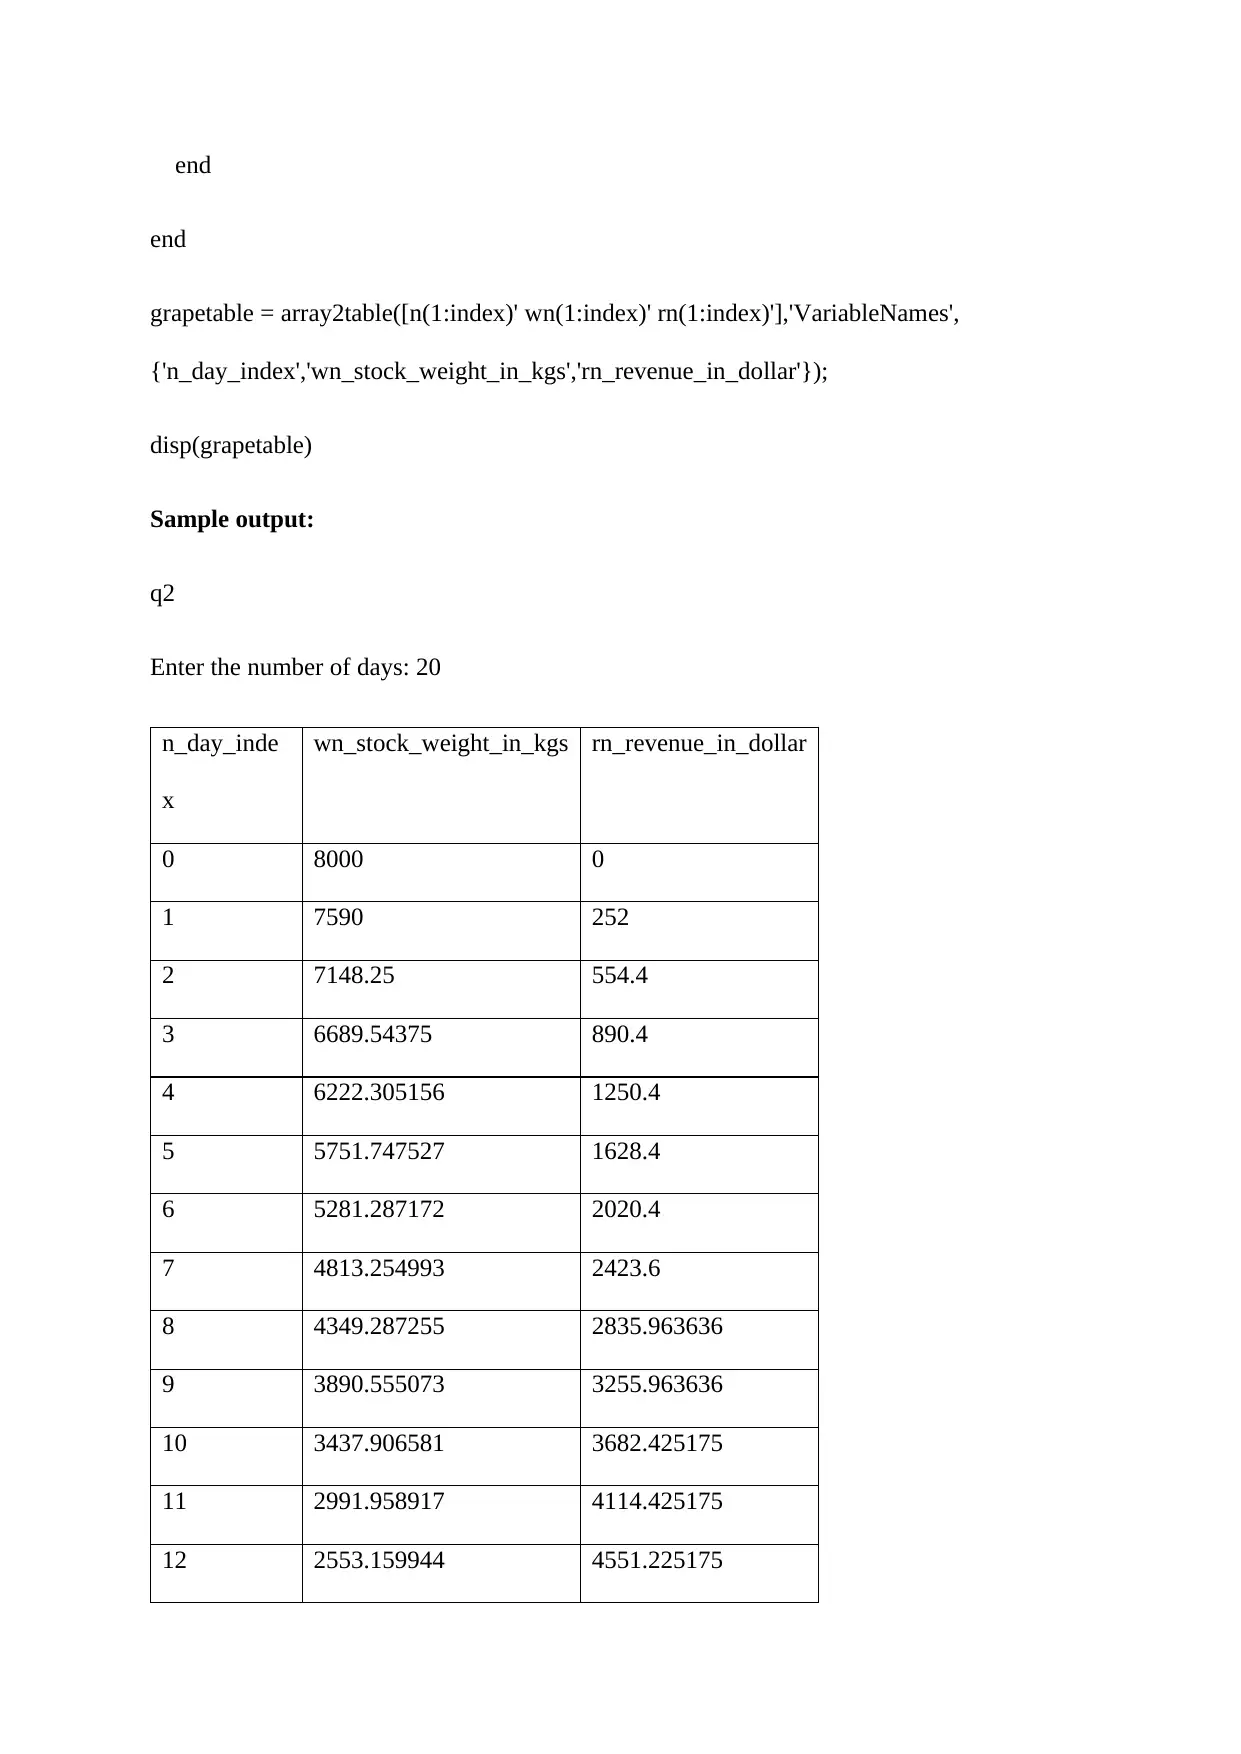
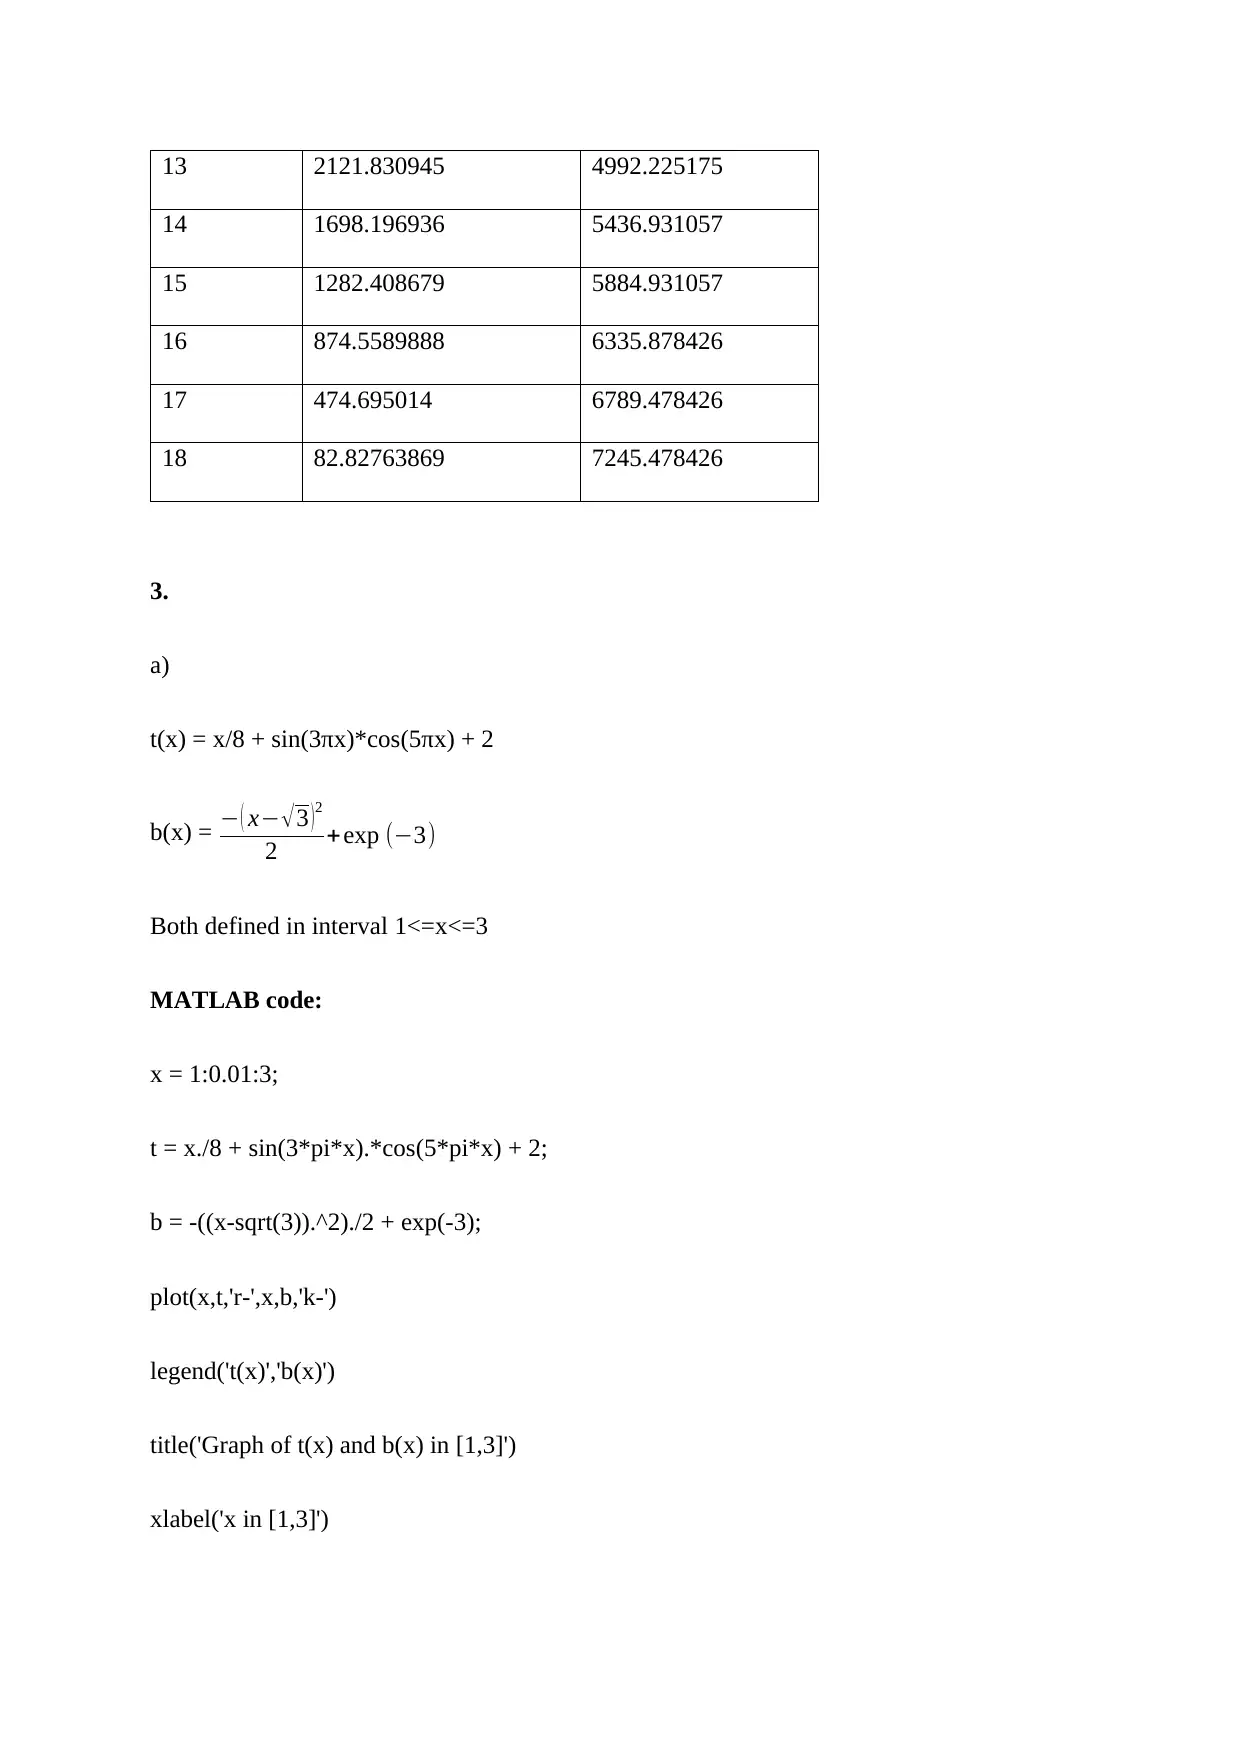
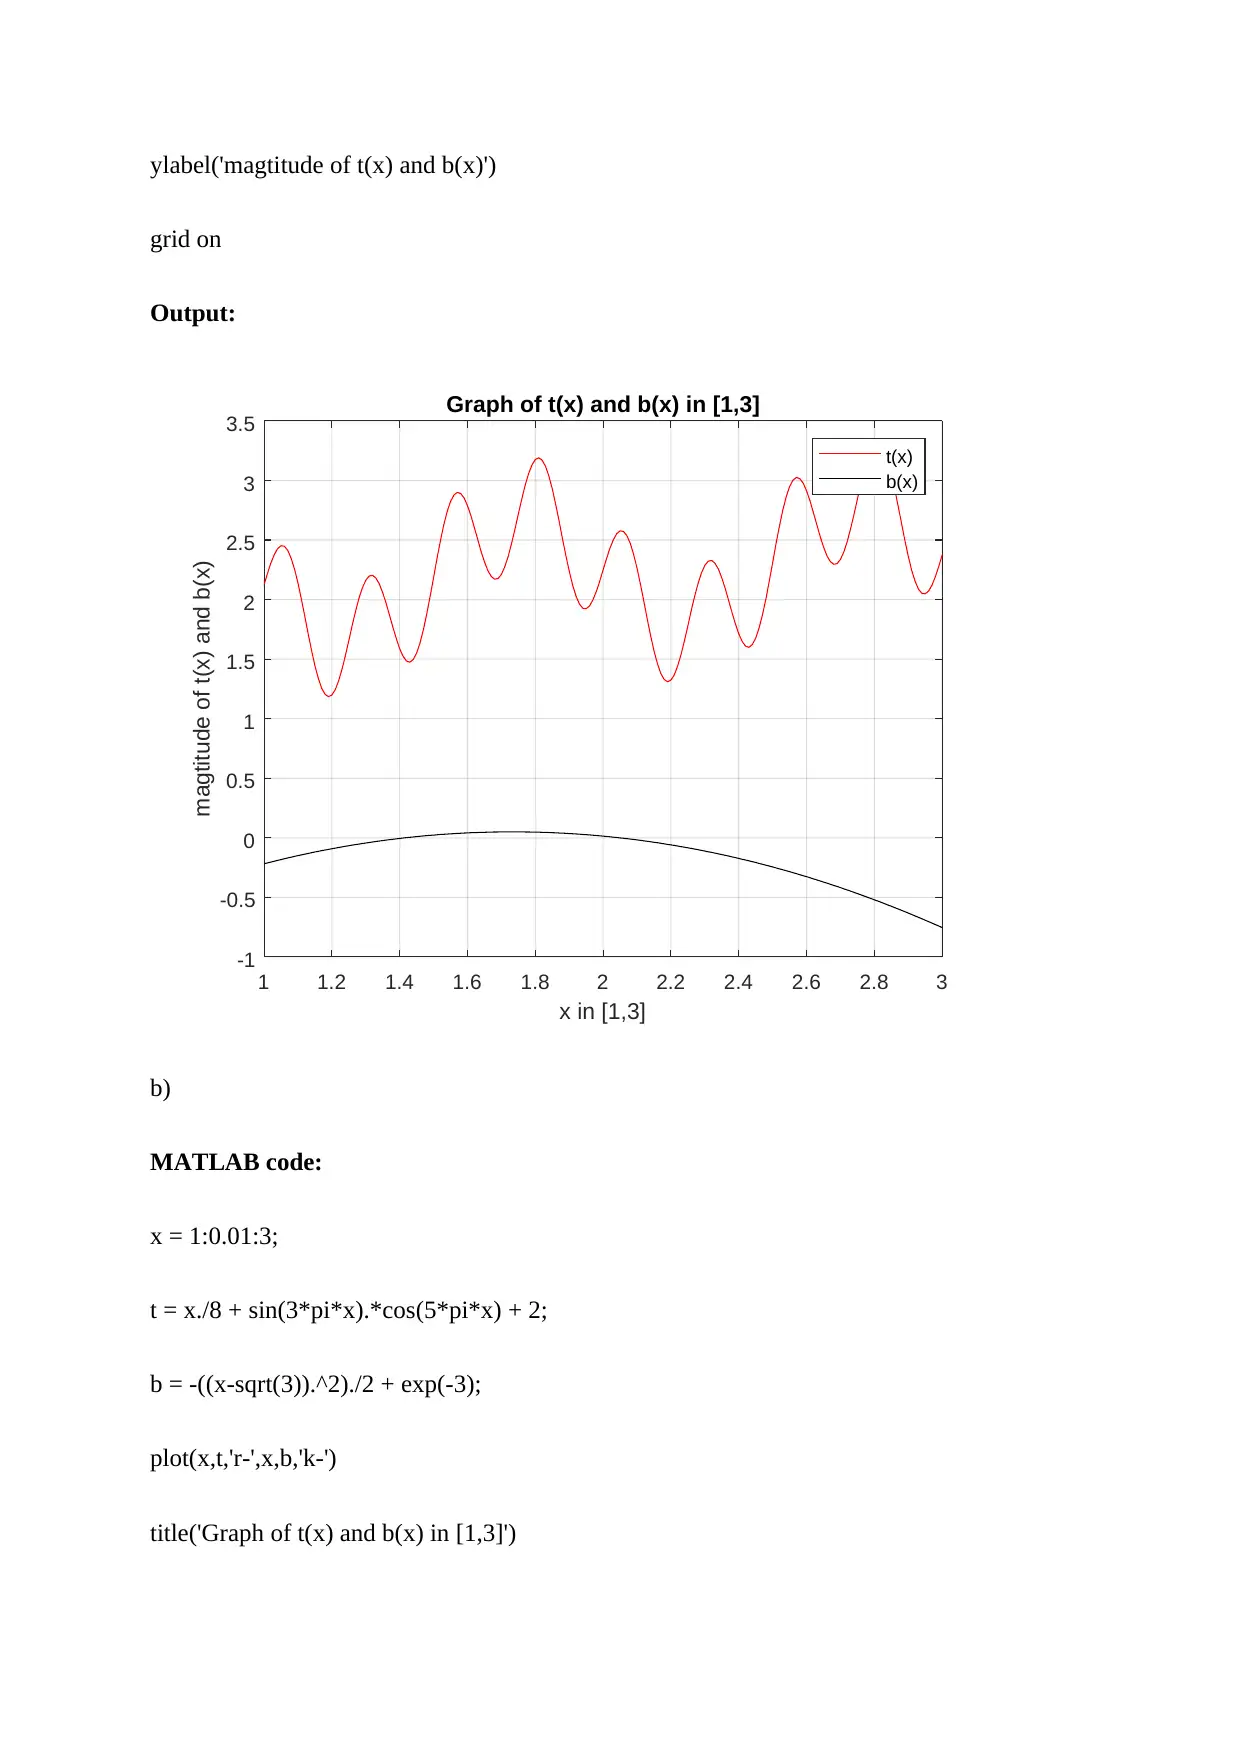
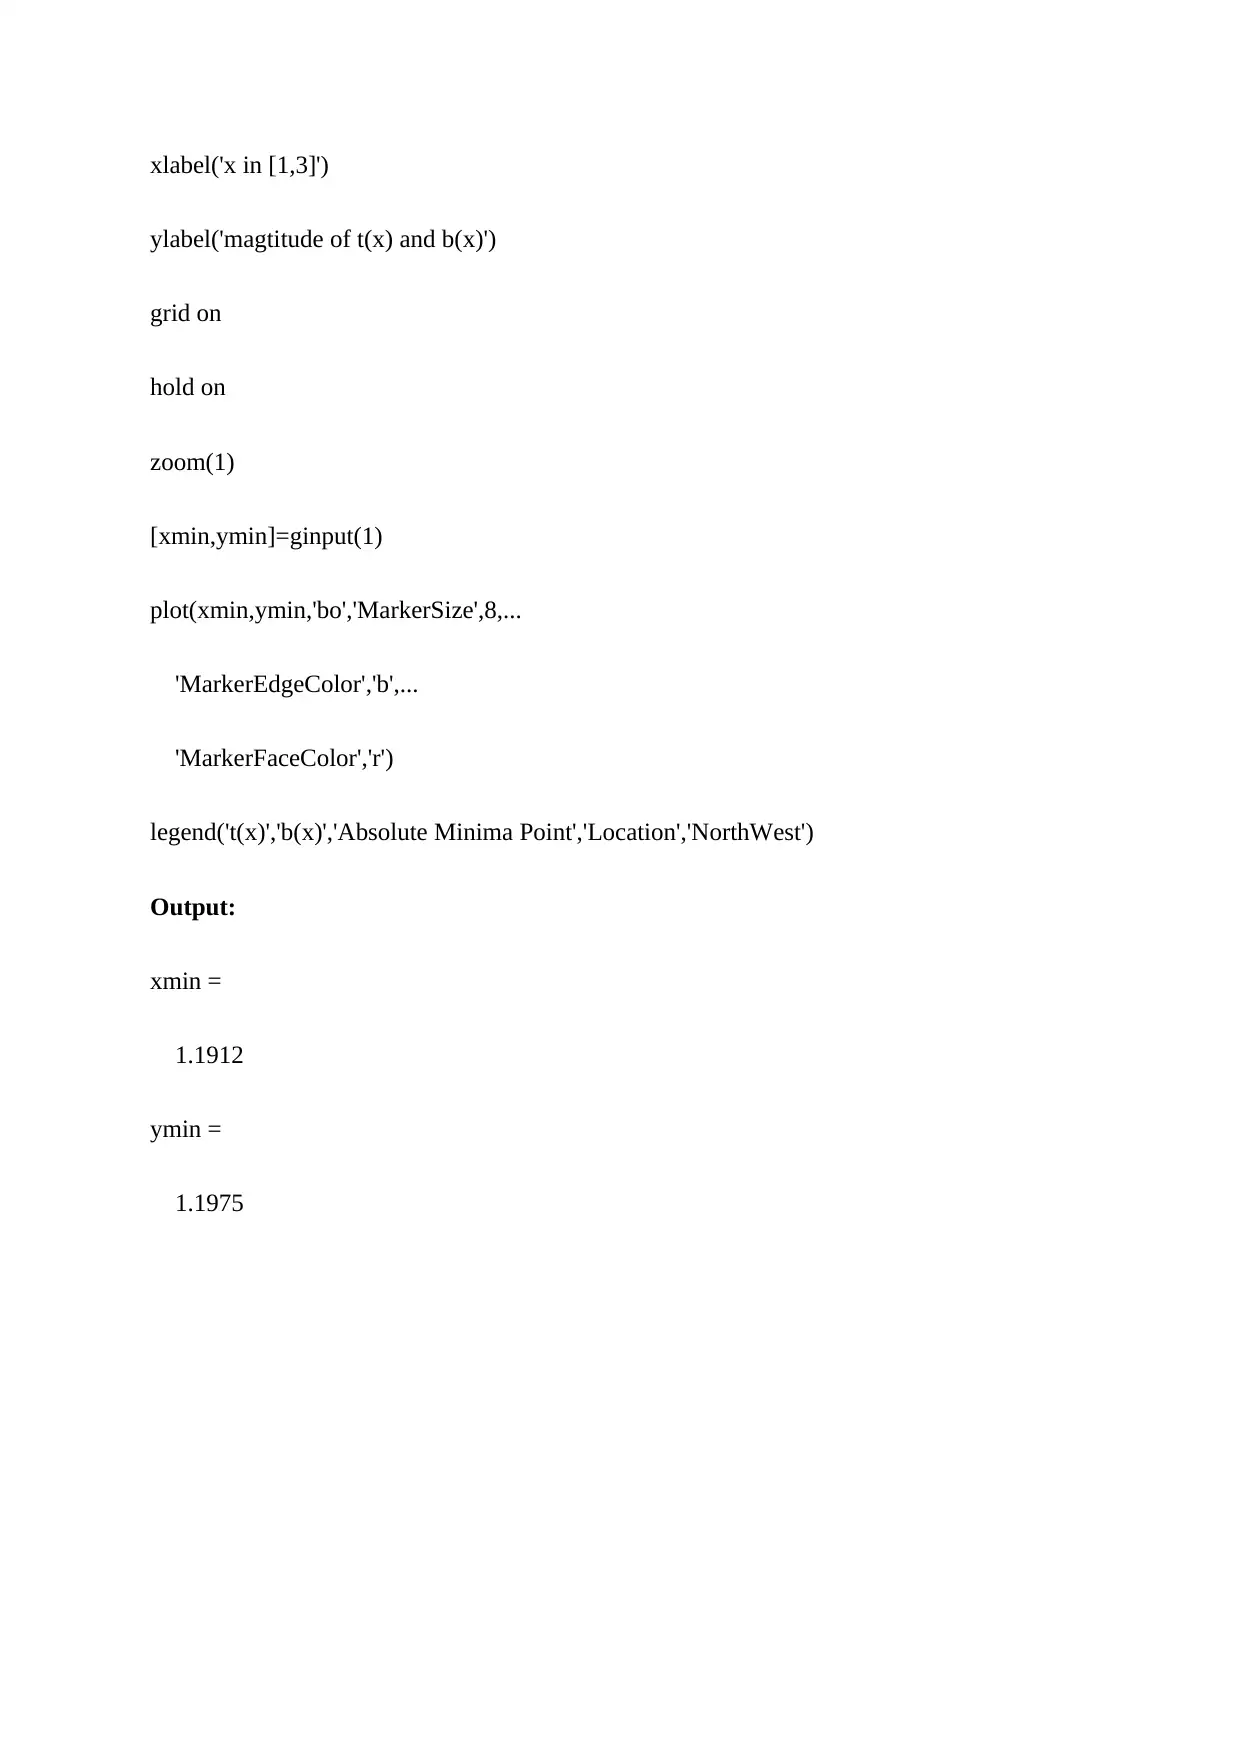
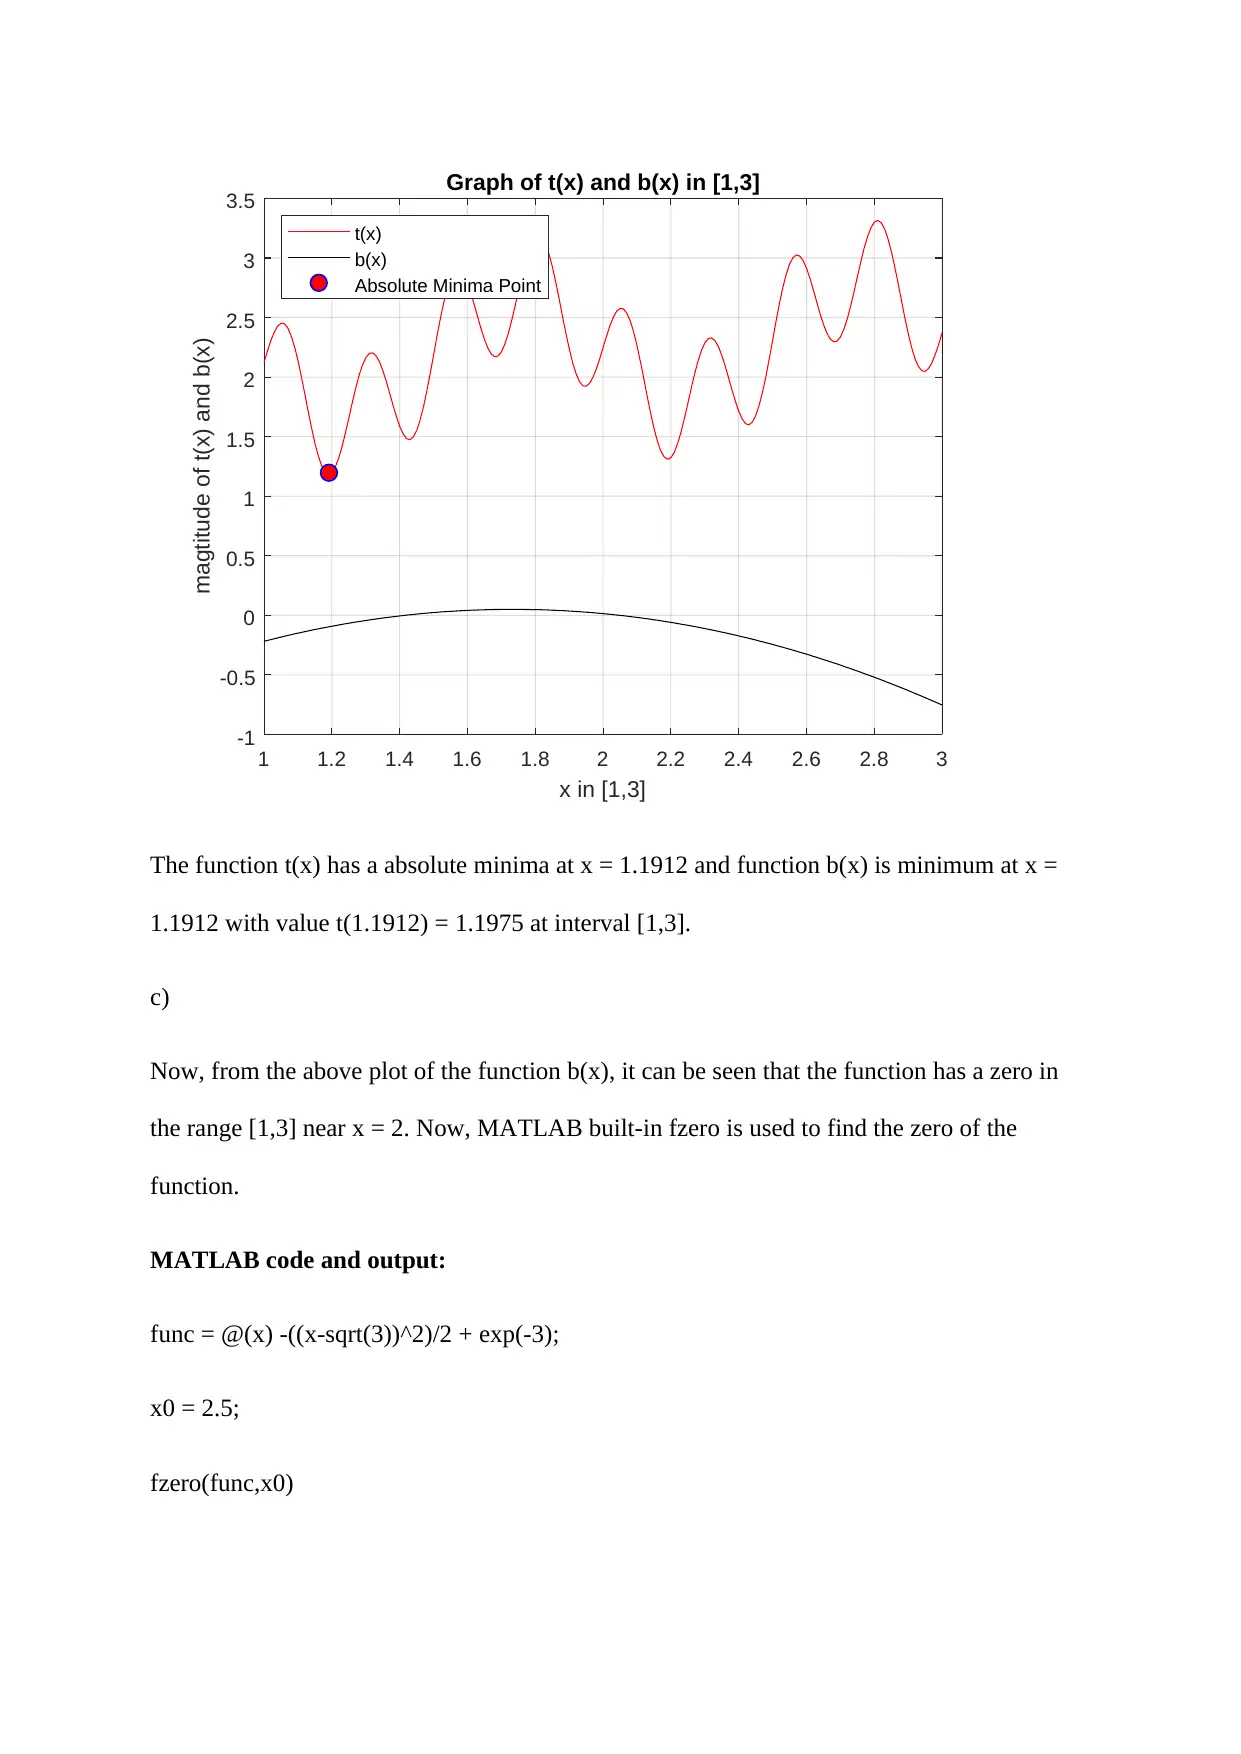
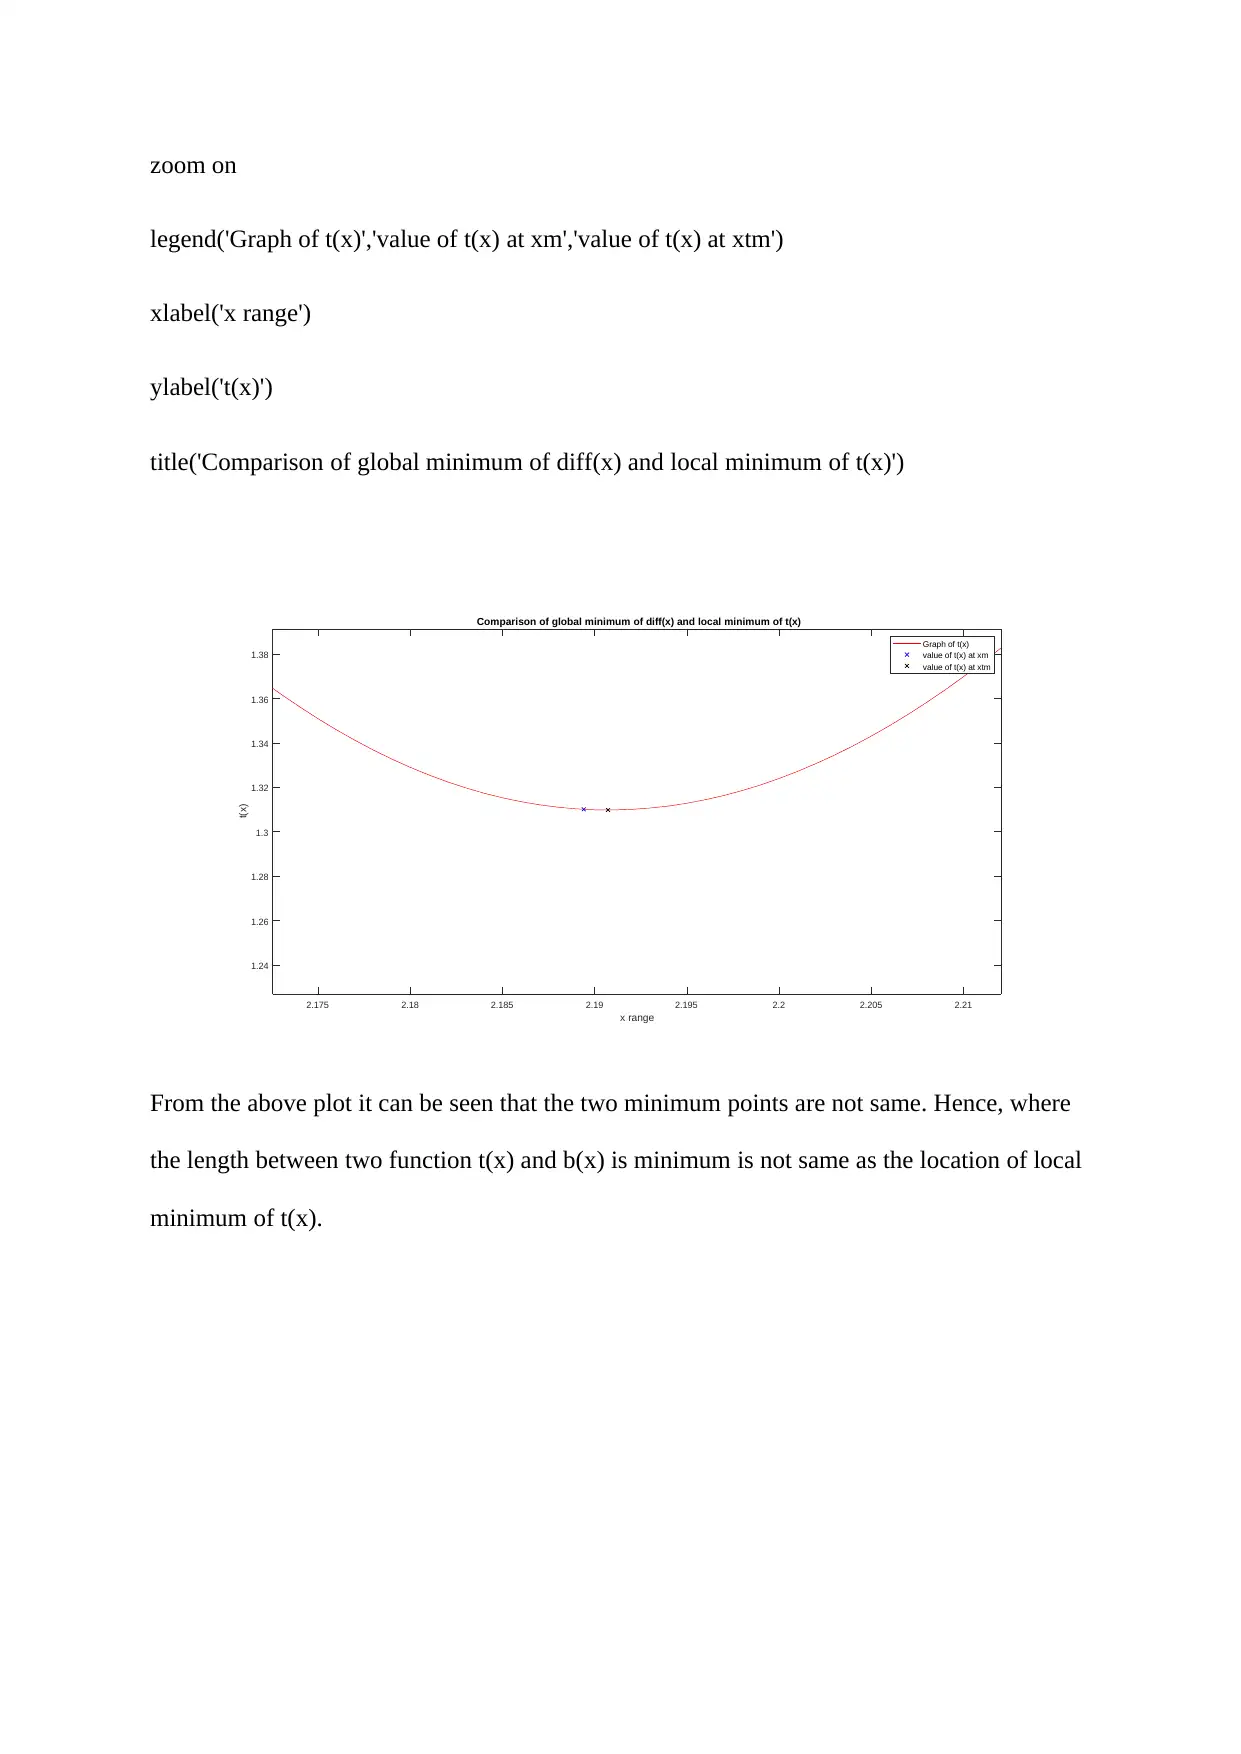
This document presents a comprehensive solution to Assignment 2 of the MAS162 Foundations of Discrete Mathematics course. The solution includes detailed hand calculations and conversions of numbers in different bases, such as base 9, 16, 2, 4, 8, and 7. It also covers the development and analysis of a recursive function to model a real-world scenario involving grapes, including MATLAB code for simulation, generating tables, and plotting graphs. Furthermore, the assignment solution involves the analysis of two mathematical functions, including plotting the functions, finding the minimum and zeros, and using MATLAB built-in functions like fzero and fminbnd to determine the roots and minima of the functions. The solution provides code, plots, and clear explanations for each step, ensuring a thorough understanding of the concepts covered in the assignment.

Running head: FOUNDATIONS OF DISCRETE MATHEMATICS
FOUNDATIONS OF DISCRETE MATHEMATICS
Name of the Student
Name of the University
Author Note
FOUNDATIONS OF DISCRETE MATHEMATICS
Name of the Student
Name of the University
Author Note
Paraphrase This Document
Need a fresh take? Get an instant paraphrase of this document with our AI Paraphraser

1.
a) ( 714 )9+ ( 78 )9
= ( 803 ) 9
Carry 1 1
7 1 4
+ 7 8
8 0 3
b) ( A 0 C . D 2 )16 = A∗162 +0∗161 +C∗160 + D∗16−1 +2∗16−2
= 2572.820312510
c) ( 1010110010100 )2 = 552410
Now, 552410 = 11121104 (diving by 4 repeatedly and assigning the remainders from bottom
to top)
divisor dividend remainder
4 5524 0
4 1381 1
4 345 1
4 86 2
4 21 1
4 5 1
4 1 1

d) 123324 = 2*4^0 + 3*4^1 + 3*4^2 + 2*4^3 + 1*4^4 = 44610
44610 = 6768 (diving by 8 repeatedly and assigning the remainders from bottom to top)
divisor dividend remainder
8 446 6
8 55 7
8 6 6
e) 873210 = 343137 (diving by 7 repeatedly and assigning the remainders from bottom to
top)
divisor dividend remainder
7 8732 3
7 1247 1
7 178 3
7 25 4
7 3 3
2.
a) The recursive function for wn which is the number of grapes present at the end of day n is
given by,
wn=wn−1− 420 ( n+1 )
n+3 −wn−1∗(0.025)
For n-1 = 1,2….
b) The value of wn for n=0,1,2,3 will be
⊘ This is a preview!⊘
Do you want full access?
Subscribe today to unlock all pages.

Trusted by 1+ million students worldwide

w0 = 8000
w1 = 8000− 420 ( 1+1 )
1+3 −8000∗(0.025) = 7590
w2 = 7148.3
w3 = 6689.5
c) rn +1 = rn + 420*1.2(n + 1)/(n + 3)
r0 = $ 0
MATLAB code:
num = input('Enter the number of days: ');
n = 0:num;
wn(1) = 8000; rn(1) = 0;
for i=1:num
wn(i+1) = wn(i) - 420*(i+1)/(i+3) - wn(i)*0.025;
rn(i+1) = rn(i) + 420*(i+1)*1.2/(i+3);
%% assuming wn can't be negative or the sale on any day is limited by the stock
if wn(i+1) < 0
index = i;
break
else
index = length(wn);
Paraphrase This Document
Need a fresh take? Get an instant paraphrase of this document with our AI Paraphraser

end
end
grapetable = array2table([n(1:index)' wn(1:index)' rn(1:index)'],'VariableNames',
{'n_day_index','wn_stock_weight_in_kgs','rn_revenue_in_dollar'});
disp(grapetable)
Sample output:
q2
Enter the number of days: 20
n_day_inde
x
wn_stock_weight_in_kgs rn_revenue_in_dollar
0 8000 0
1 7590 252
2 7148.25 554.4
3 6689.54375 890.4
4 6222.305156 1250.4
5 5751.747527 1628.4
6 5281.287172 2020.4
7 4813.254993 2423.6
8 4349.287255 2835.963636
9 3890.555073 3255.963636
10 3437.906581 3682.425175
11 2991.958917 4114.425175
12 2553.159944 4551.225175

13 2121.830945 4992.225175
14 1698.196936 5436.931057
15 1282.408679 5884.931057
16 874.5589888 6335.878426
17 474.695014 6789.478426
18 82.82763869 7245.478426
3.
a)
t(x) = x/8 + sin(3πx)*cos(5πx) + 2
b(x) = − ( x− √3 )2
2 +exp (−3)
Both defined in interval 1<=x<=3
MATLAB code:
x = 1:0.01:3;
t = x./8 + sin(3*pi*x).*cos(5*pi*x) + 2;
b = -((x-sqrt(3)).^2)./2 + exp(-3);
plot(x,t,'r-',x,b,'k-')
legend('t(x)','b(x)')
title('Graph of t(x) and b(x) in [1,3]')
xlabel('x in [1,3]')
⊘ This is a preview!⊘
Do you want full access?
Subscribe today to unlock all pages.

Trusted by 1+ million students worldwide

ylabel('magtitude of t(x) and b(x)')
grid on
Output:
1 1.2 1.4 1.6 1.8 2 2.2 2.4 2.6 2.8 3
x in [1,3]
-1
-0.5
0
0.5
1
1.5
2
2.5
3
3.5
magtitude of t(x) and b(x)
Graph of t(x) and b(x) in [1,3]
t(x)
b(x)
b)
MATLAB code:
x = 1:0.01:3;
t = x./8 + sin(3*pi*x).*cos(5*pi*x) + 2;
b = -((x-sqrt(3)).^2)./2 + exp(-3);
plot(x,t,'r-',x,b,'k-')
title('Graph of t(x) and b(x) in [1,3]')
Paraphrase This Document
Need a fresh take? Get an instant paraphrase of this document with our AI Paraphraser

xlabel('x in [1,3]')
ylabel('magtitude of t(x) and b(x)')
grid on
hold on
zoom(1)
[xmin,ymin]=ginput(1)
plot(xmin,ymin,'bo','MarkerSize',8,...
'MarkerEdgeColor','b',...
'MarkerFaceColor','r')
legend('t(x)','b(x)','Absolute Minima Point','Location','NorthWest')
Output:
xmin =
1.1912
ymin =
1.1975
ylabel('magtitude of t(x) and b(x)')
grid on
hold on
zoom(1)
[xmin,ymin]=ginput(1)
plot(xmin,ymin,'bo','MarkerSize',8,...
'MarkerEdgeColor','b',...
'MarkerFaceColor','r')
legend('t(x)','b(x)','Absolute Minima Point','Location','NorthWest')
Output:
xmin =
1.1912
ymin =
1.1975

1 1.2 1.4 1.6 1.8 2 2.2 2.4 2.6 2.8 3
x in [1,3]
-1
-0.5
0
0.5
1
1.5
2
2.5
3
3.5
magtitude of t(x) and b(x)
Graph of t(x) and b(x) in [1,3]
t(x)
b(x)
Absolute Minima Point
The function t(x) has a absolute minima at x = 1.1912 and function b(x) is minimum at x =
1.1912 with value t(1.1912) = 1.1975 at interval [1,3].
c)
Now, from the above plot of the function b(x), it can be seen that the function has a zero in
the range [1,3] near x = 2. Now, MATLAB built-in fzero is used to find the zero of the
function.
MATLAB code and output:
func = @(x) -((x-sqrt(3))^2)/2 + exp(-3);
x0 = 2.5;
fzero(func,x0)
⊘ This is a preview!⊘
Do you want full access?
Subscribe today to unlock all pages.

Trusted by 1+ million students worldwide

ans =
2.0476
Now, manually the root of the function is found by following method.
b(x) = 0 => − ( x− √ 3 ) 2
2 + exp ( −3 ) = 0
( x− √ 3 ) 2
2 =exp ( −3 )
x= √ ( 2 exp ( −3 ) ) + √ 3 = 2.0476.
This follows the root obtained by visual inspection from the plot of b(x) which is very close
to 2.
d) Now, the find function is used to find the vector at which the function b(x) is zero in [1,3].
MATLAB code and output:
xs = 1:0.01:3;
bs = -((xs-sqrt(3)).^2)./2 + exp(-3);
x0 = find(bs==0)
x0 =
1×0 empty double row vector
It can be seen that the x0 has no values or the Matlab function is unable to find the root of the
function b(x) in [1,3].
This happens because the function is not exactly zero at any point throughout the vector xs.
Hence, the Matlab function find can’t find the zero value in the region. This procedure will
Paraphrase This Document
Need a fresh take? Get an instant paraphrase of this document with our AI Paraphraser

not work even if the discretization is made smaller as the zero of the function is exactly an
integer, rather it is a floating point number.
e) Now, the minimum for the function diff(x) = t(x) – b(x) is found using built-in fminbnd to
find the position of minimal length vertical bar that connects b(x) and t(x).
MATLAB code and output:
>> diff = @(x) x/8 + sin(3*pi*x)*cos(5*pi*x) + 2 - (-((x-sqrt(3))^2)/2 + exp(-3));
>> xm = fminbnd(diff,1,3)
xm =
2.1894
At xm = 2.1894 the value of the function t(x) and b(x) is found as given below.
f) Now, this position xm is plotted along with the minimum of t(x) xtm.
MATLAB code and output:
x = 1:0.001:3;
t = x./8 + sin(3*pi*x).*cos(5*pi*x) + 2;
tfunc = @(x) x/8 + sin(3*pi*x)*cos(5*pi*x) + 2;
xm = 2.1894; tat_xm = tfunc(xm);
xtm = fminbnd(tfunc,2,2.4);
tat_xtm = tfunc(xtm);
plot(x,t,'r-',xm,tat_xm,'bx',xtm,tat_xtm,'kx')

zoom on
legend('Graph of t(x)','value of t(x) at xm','value of t(x) at xtm')
xlabel('x range')
ylabel('t(x)')
title('Comparison of global minimum of diff(x) and local minimum of t(x)')
2.175 2.18 2.185 2.19 2.195 2.2 2.205 2.21
x range
1.24
1.26
1.28
1.3
1.32
1.34
1.36
1.38
t(x)
Comparison of global minimum of diff(x) and local minimum of t(x)
Graph of t(x)
value of t(x) at xm
value of t(x) at xtm
From the above plot it can be seen that the two minimum points are not same. Hence, where
the length between two function t(x) and b(x) is minimum is not same as the location of local
minimum of t(x).
⊘ This is a preview!⊘
Do you want full access?
Subscribe today to unlock all pages.

Trusted by 1+ million students worldwide
1 out of 12
Related Documents
Your All-in-One AI-Powered Toolkit for Academic Success.
+13062052269
info@desklib.com
Available 24*7 on WhatsApp / Email
Unlock your academic potential
Copyright © 2020–2025 A2Z Services. All Rights Reserved. Developed and managed by ZUCOL.


