Foundations of Statistics: WIL Project Part 2 - Hypothesis Testing
VerifiedAdded on 2023/06/10
|15
|2487
|449
Project
AI Summary
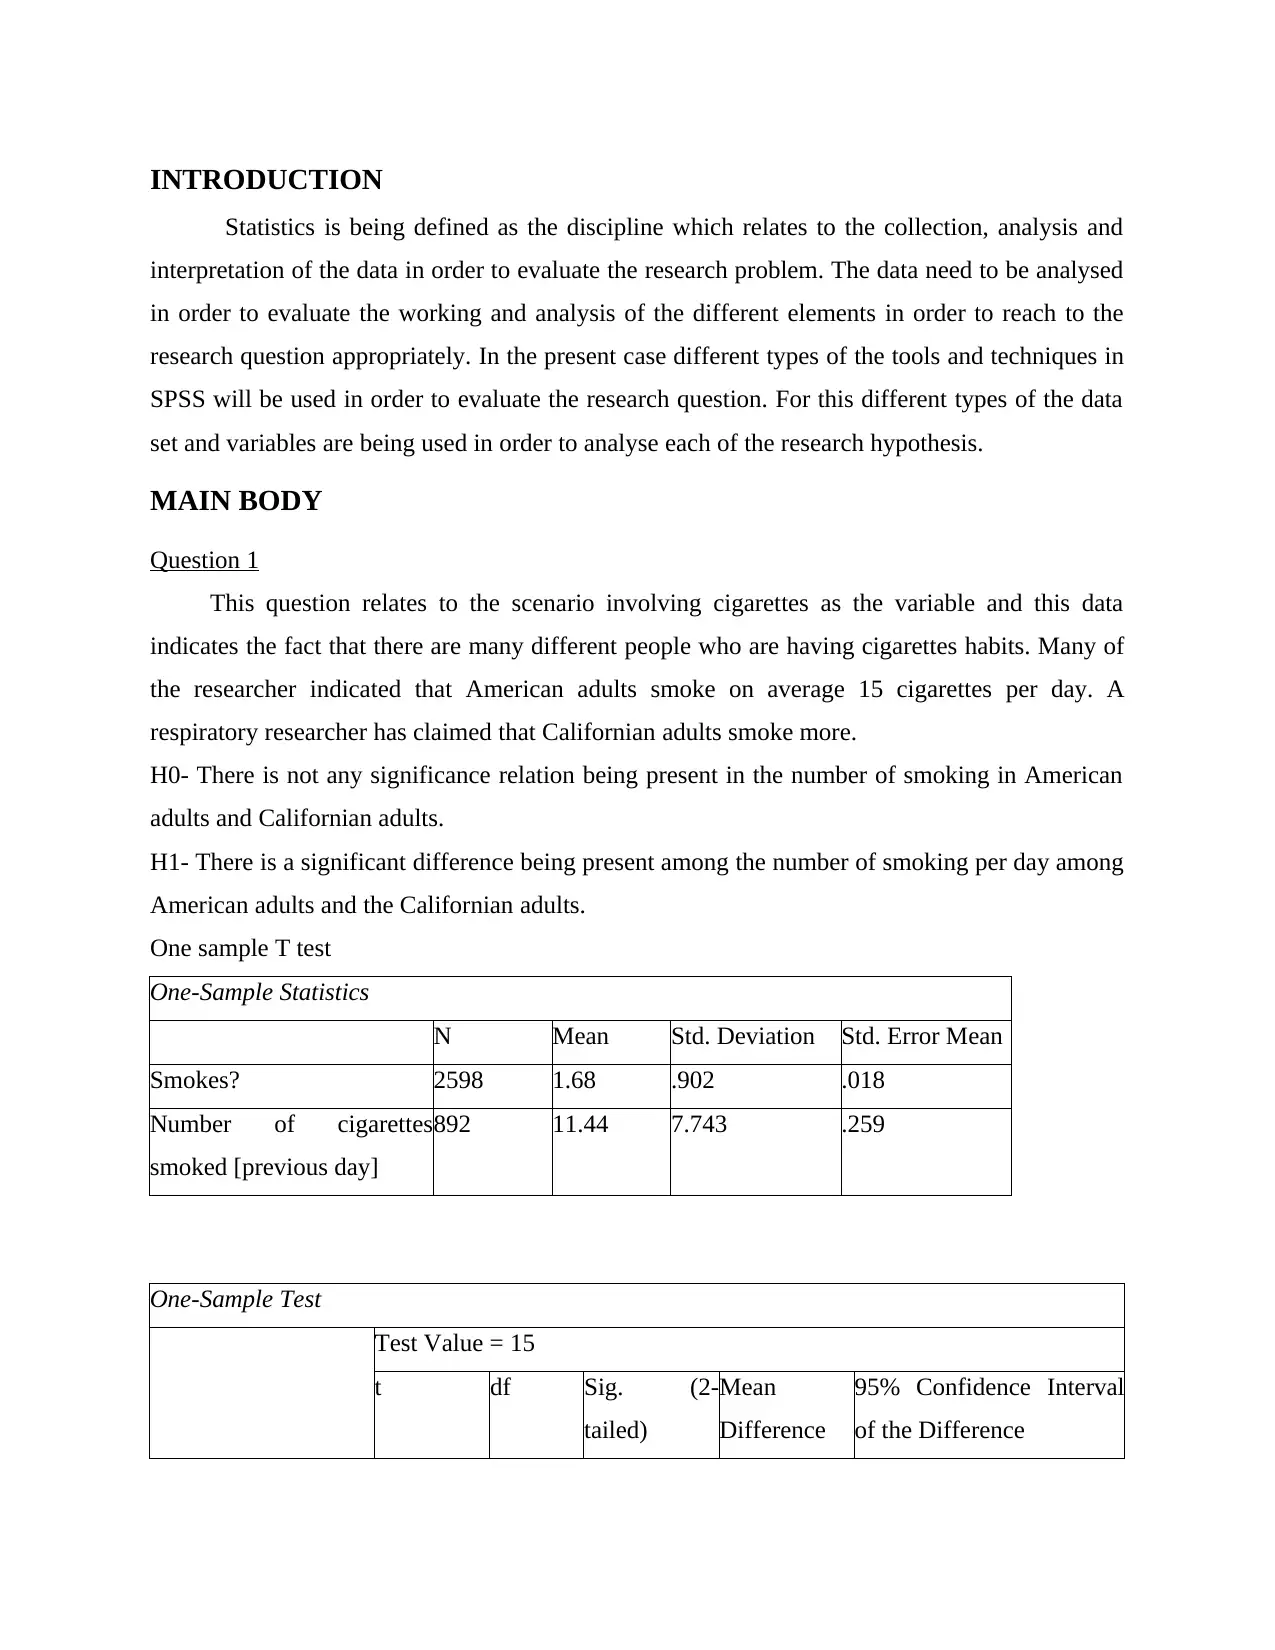
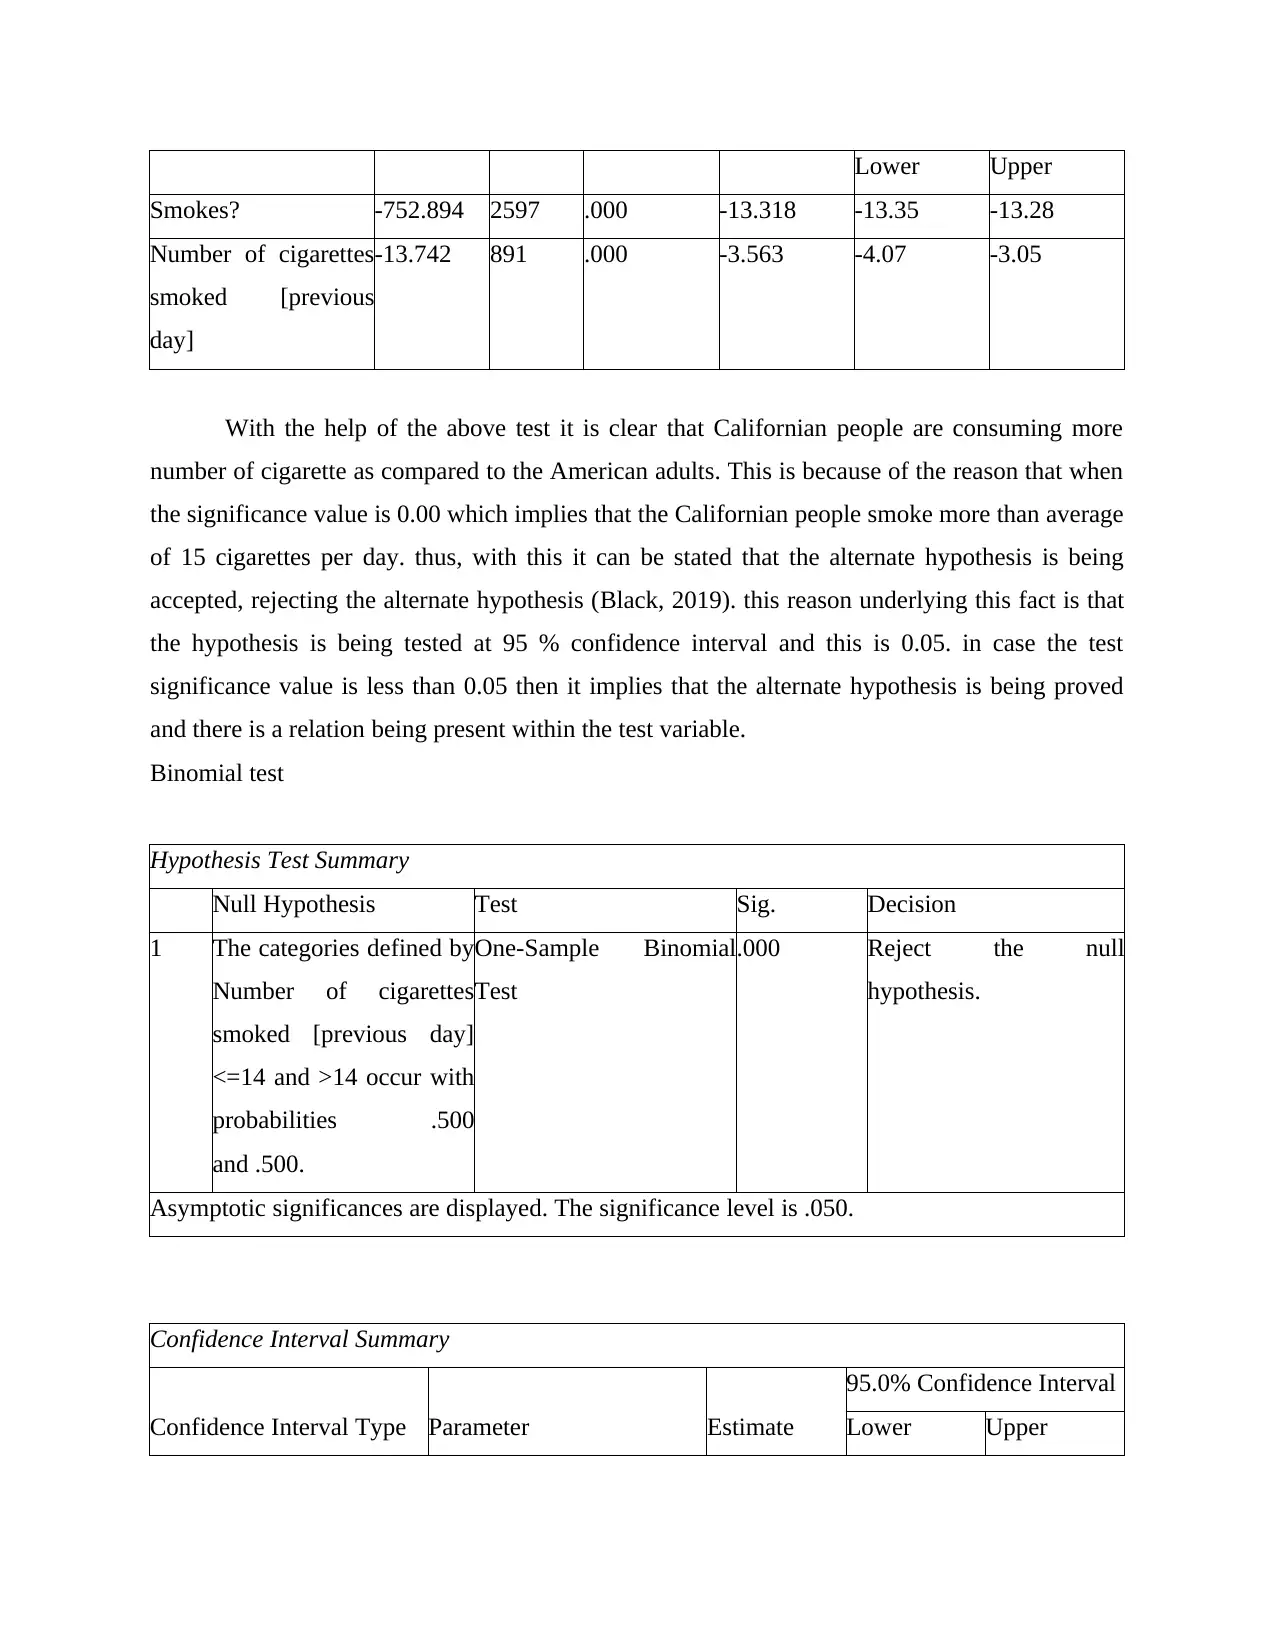
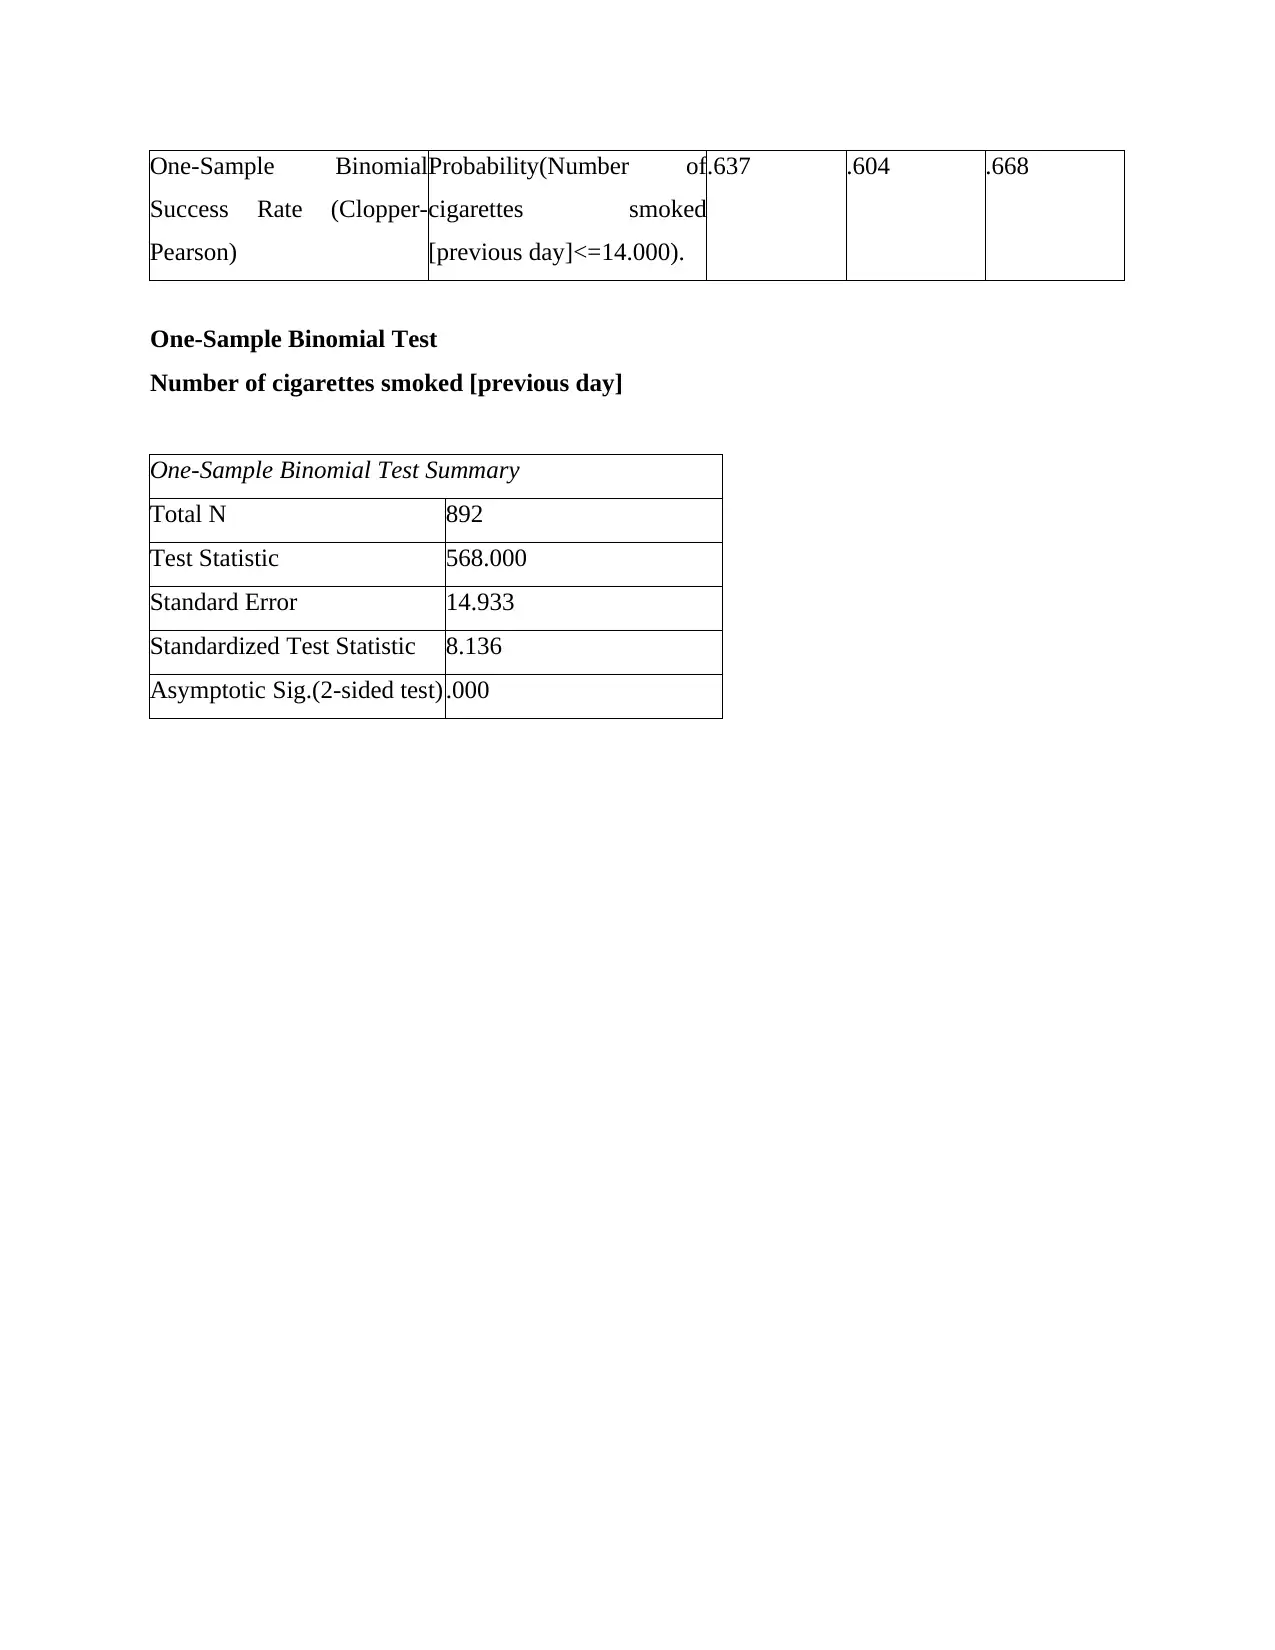
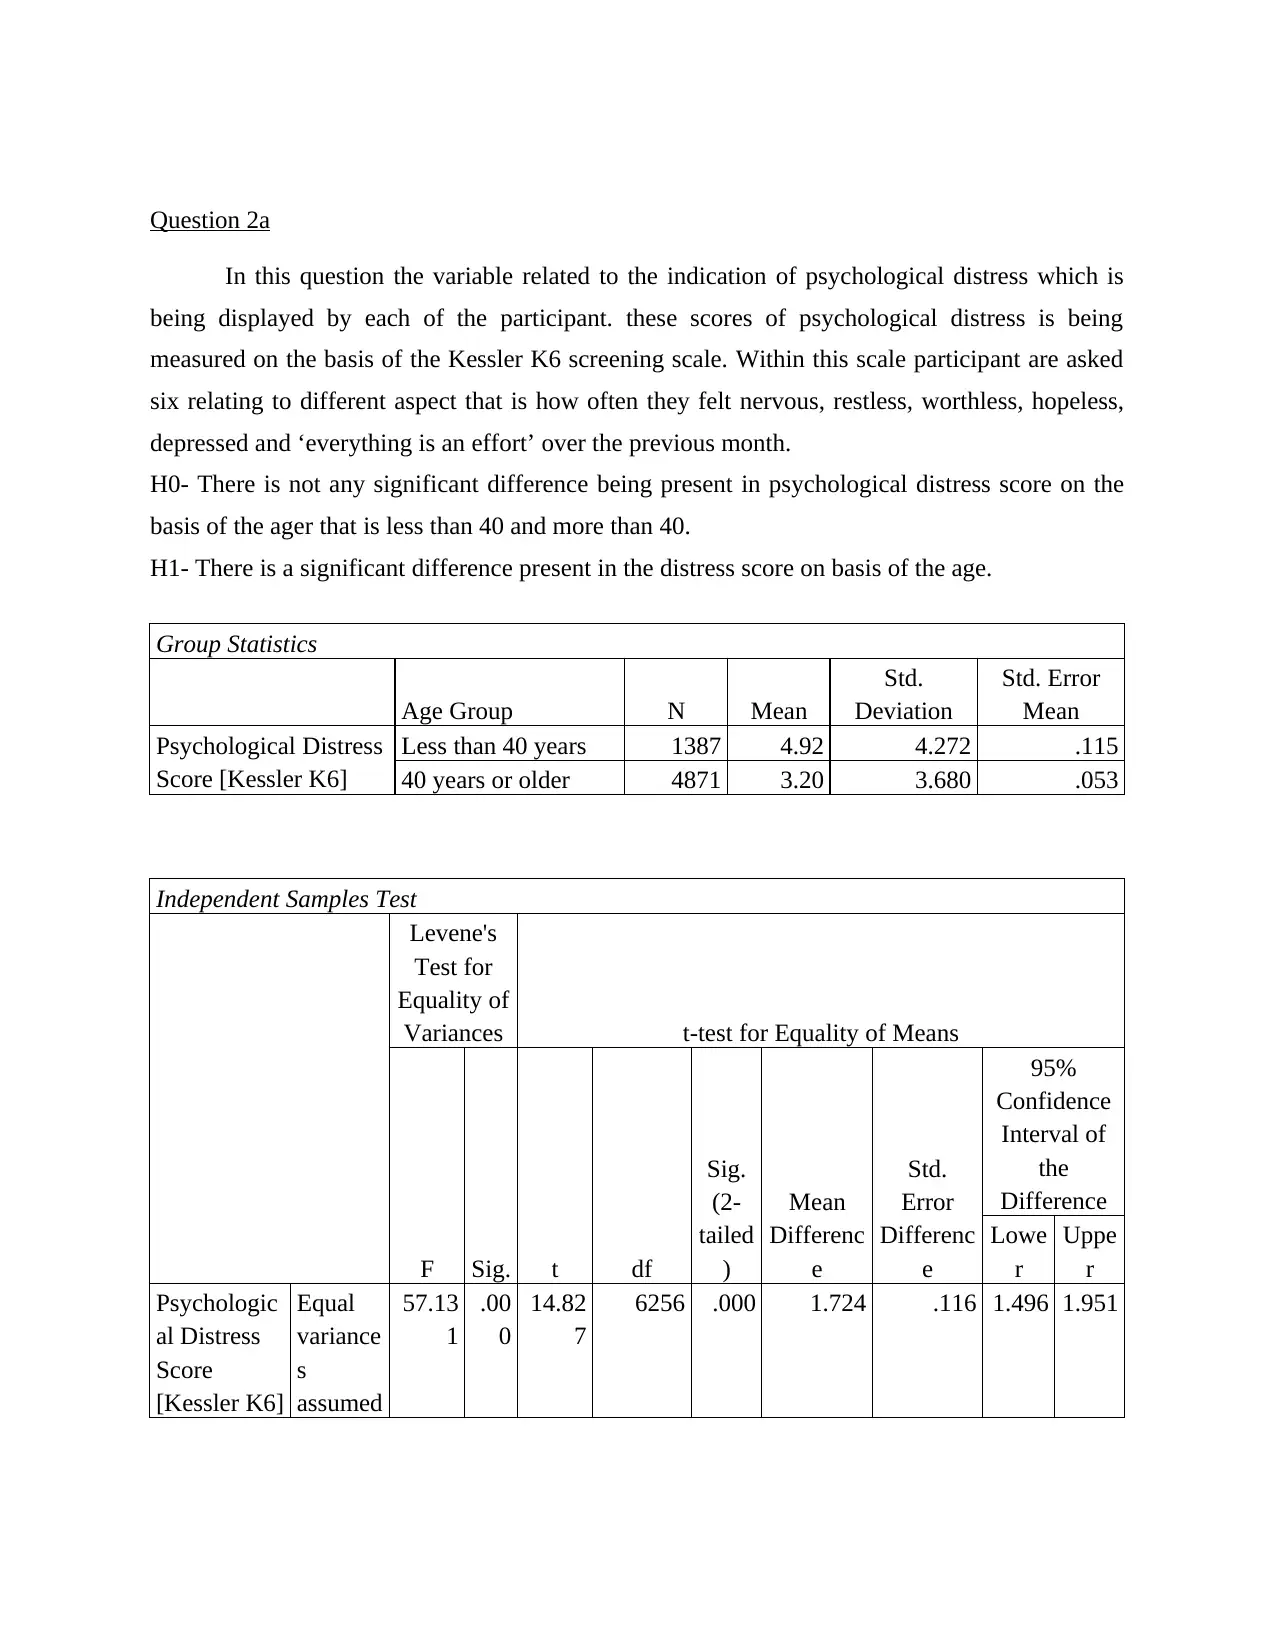
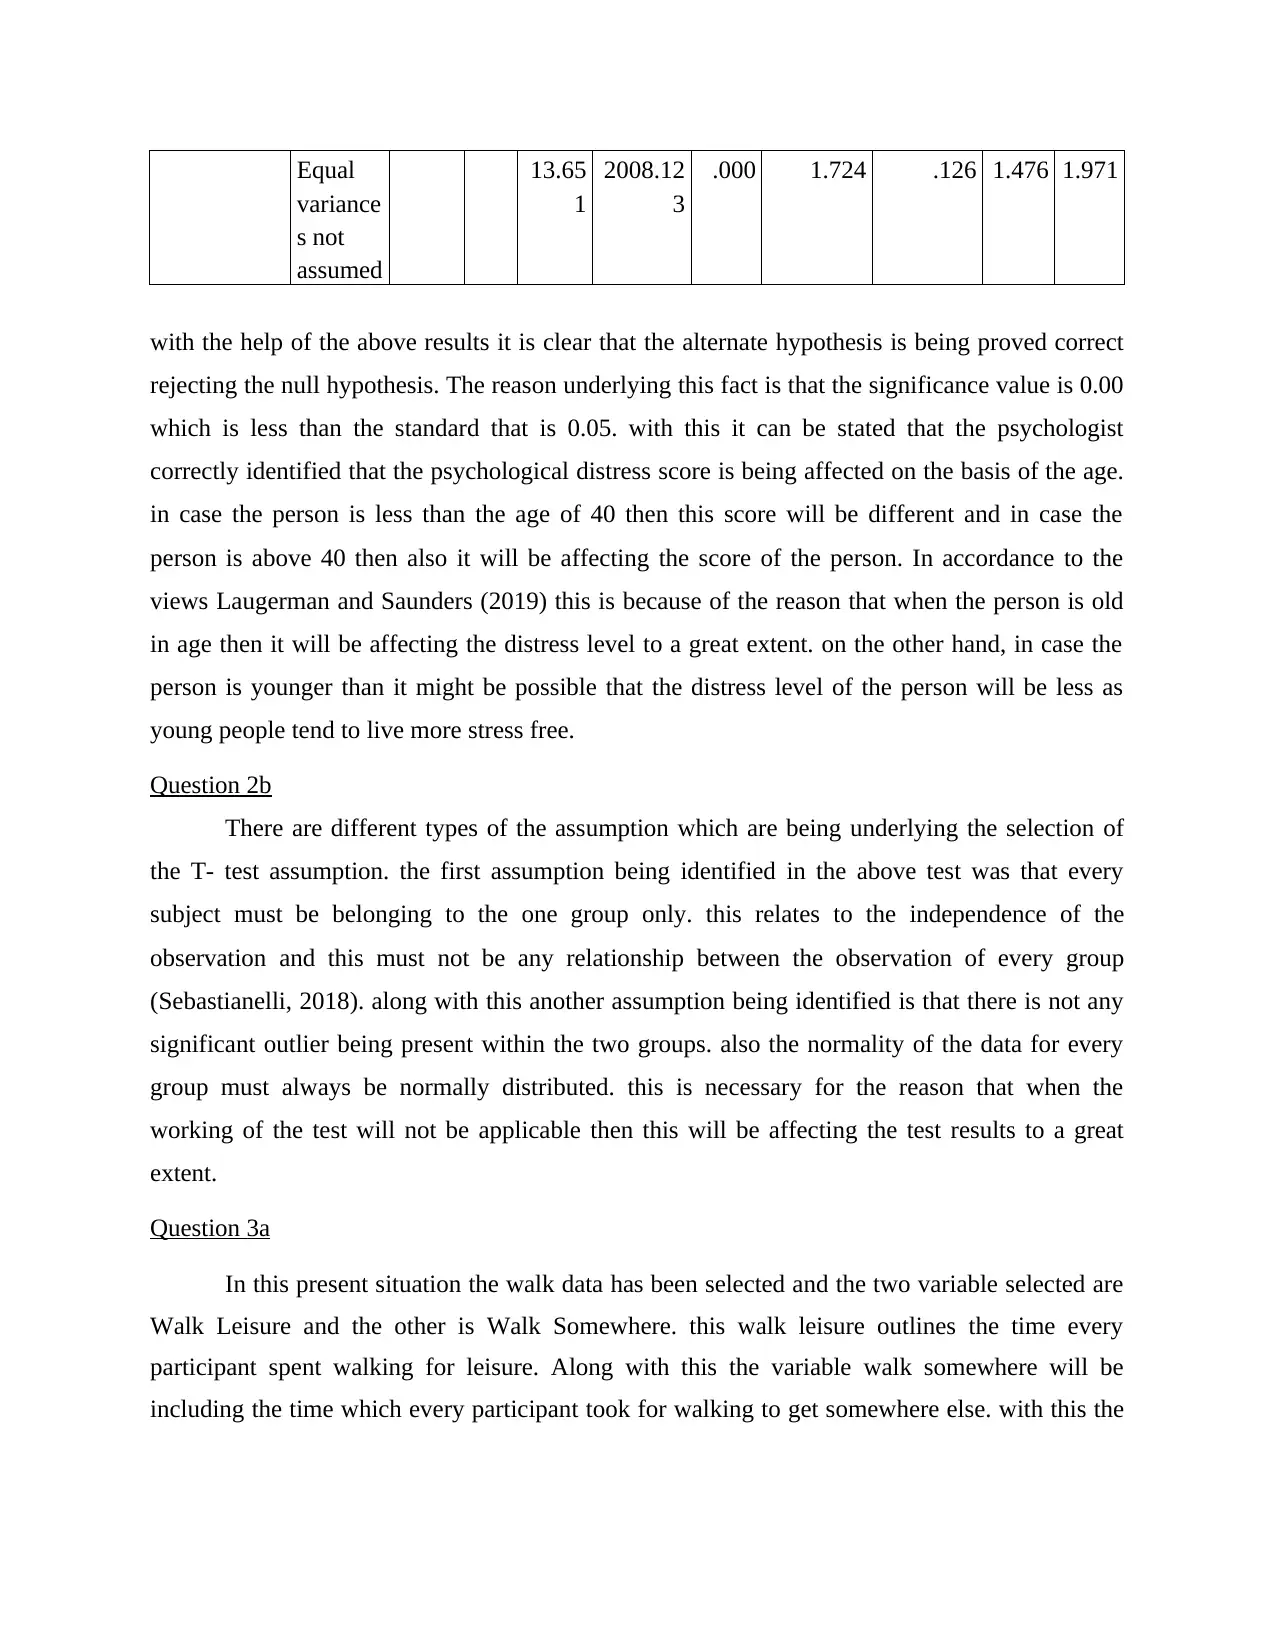
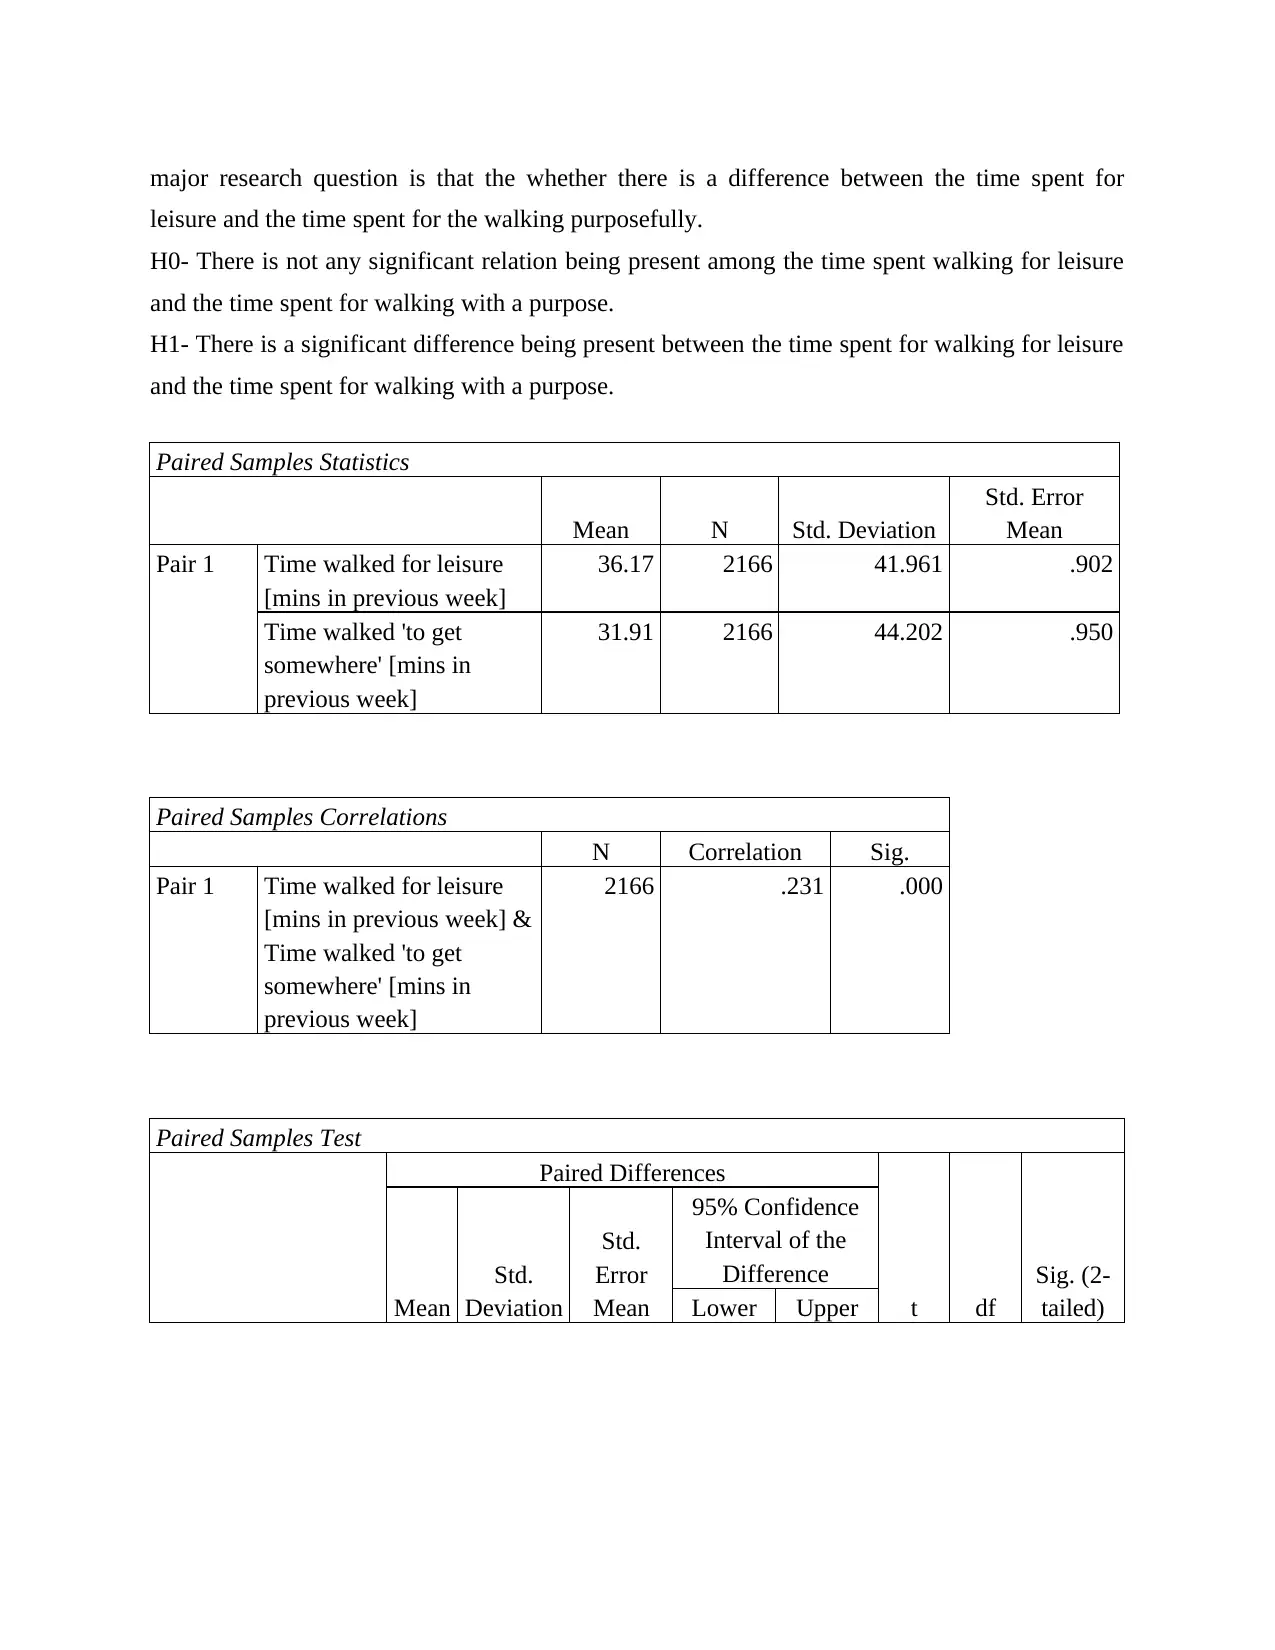
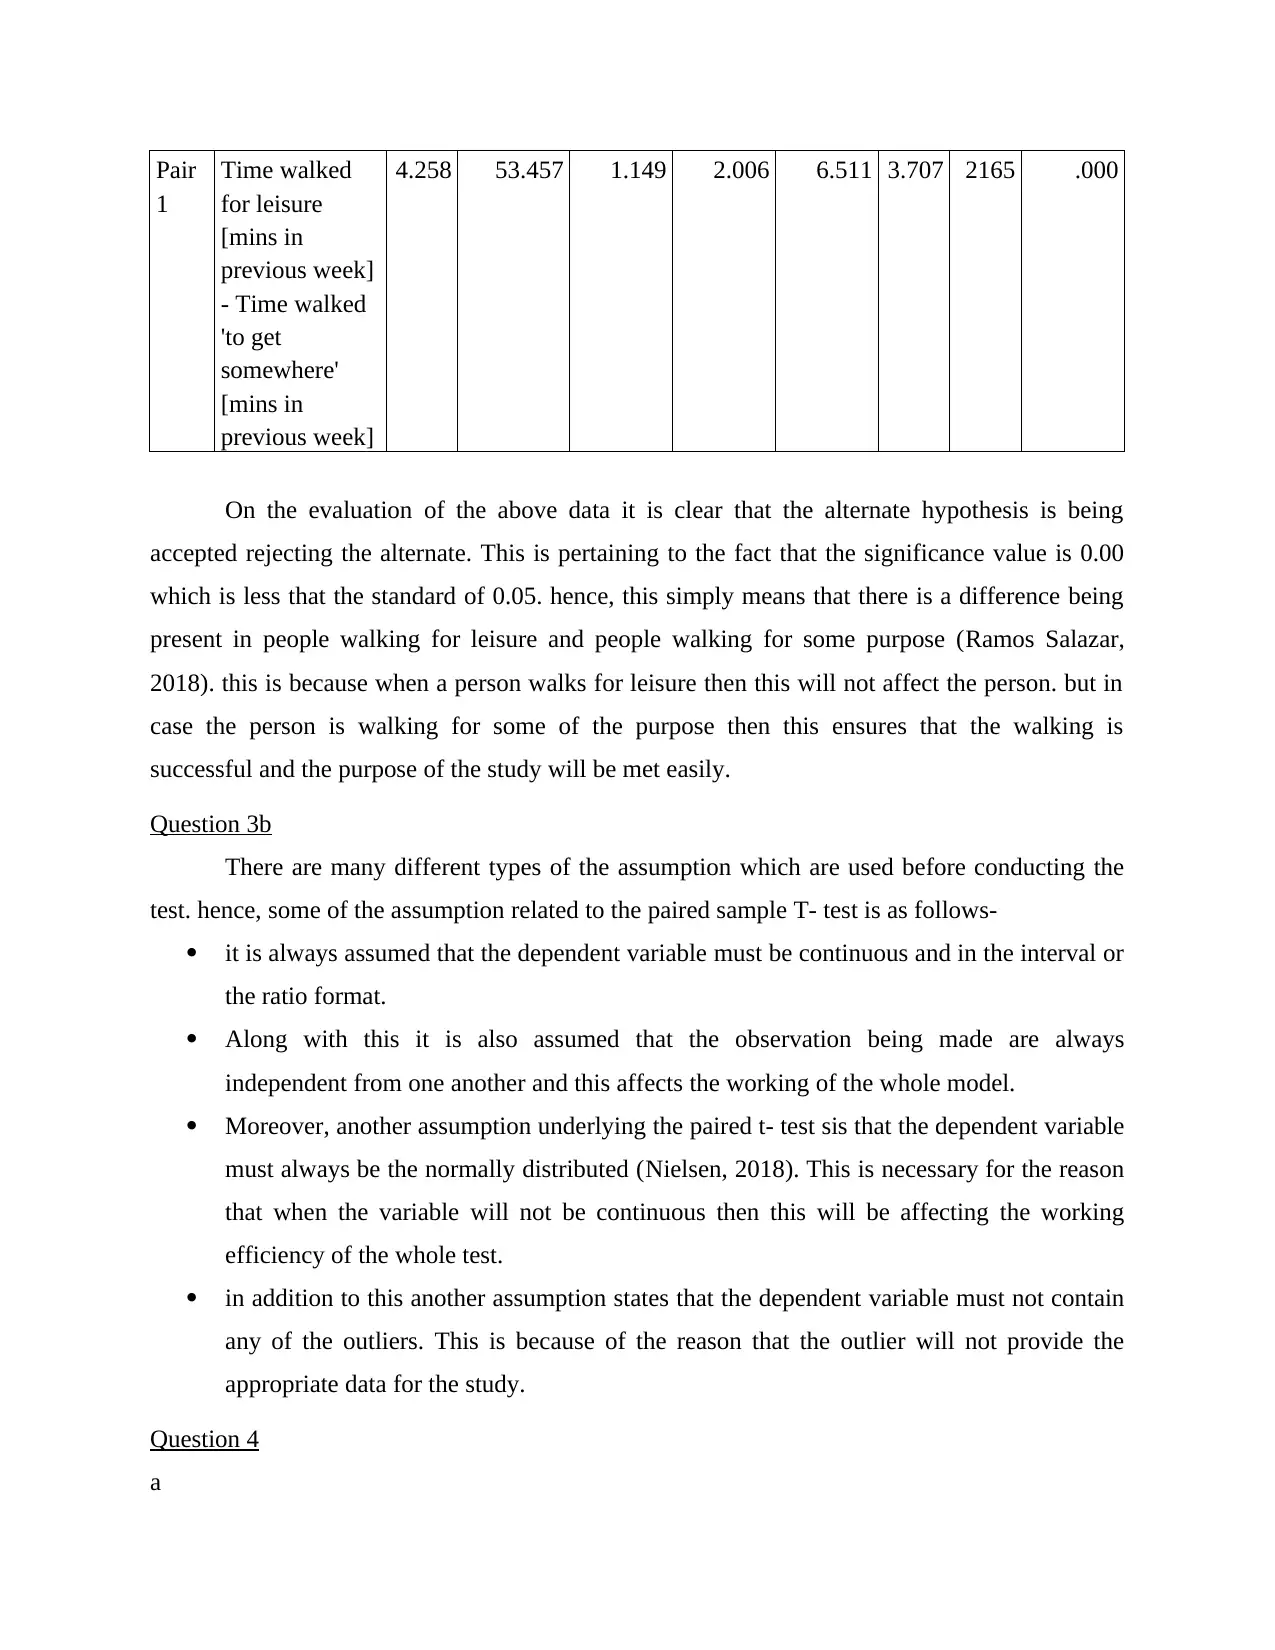
This statistics project involves using SPSS to analyze various datasets and test different hypotheses. The project covers several statistical tests, including one-sample t-tests, binomial tests, independent samples t-tests, and paired samples t-tests. The first question examines cigarette consumption among American and Californian adults. The second question analyzes psychological distress scores based on age groups. The third question explores the difference between time spent walking for leisure versus walking purposefully. The fourth question discusses ice cream consumption trends between Australian and American consumers and evaluates a dietician's conclusion. The project ultimately demonstrates the application of statistical tools and techniques to real-world scenarios, with the data and solutions available on Desklib, a platform offering study resources for students.

1 out of 15
Related Documents


Your All-in-One AI-Powered Toolkit for Academic Success.
+13062052269
info@desklib.com
Available 24*7 on WhatsApp / Email
![[object Object]](/_next/static/media/star-bottom.7253800d.svg)
Copyright © 2020–2026 A2Z Services. All Rights Reserved. Developed and managed by ZUCOL.