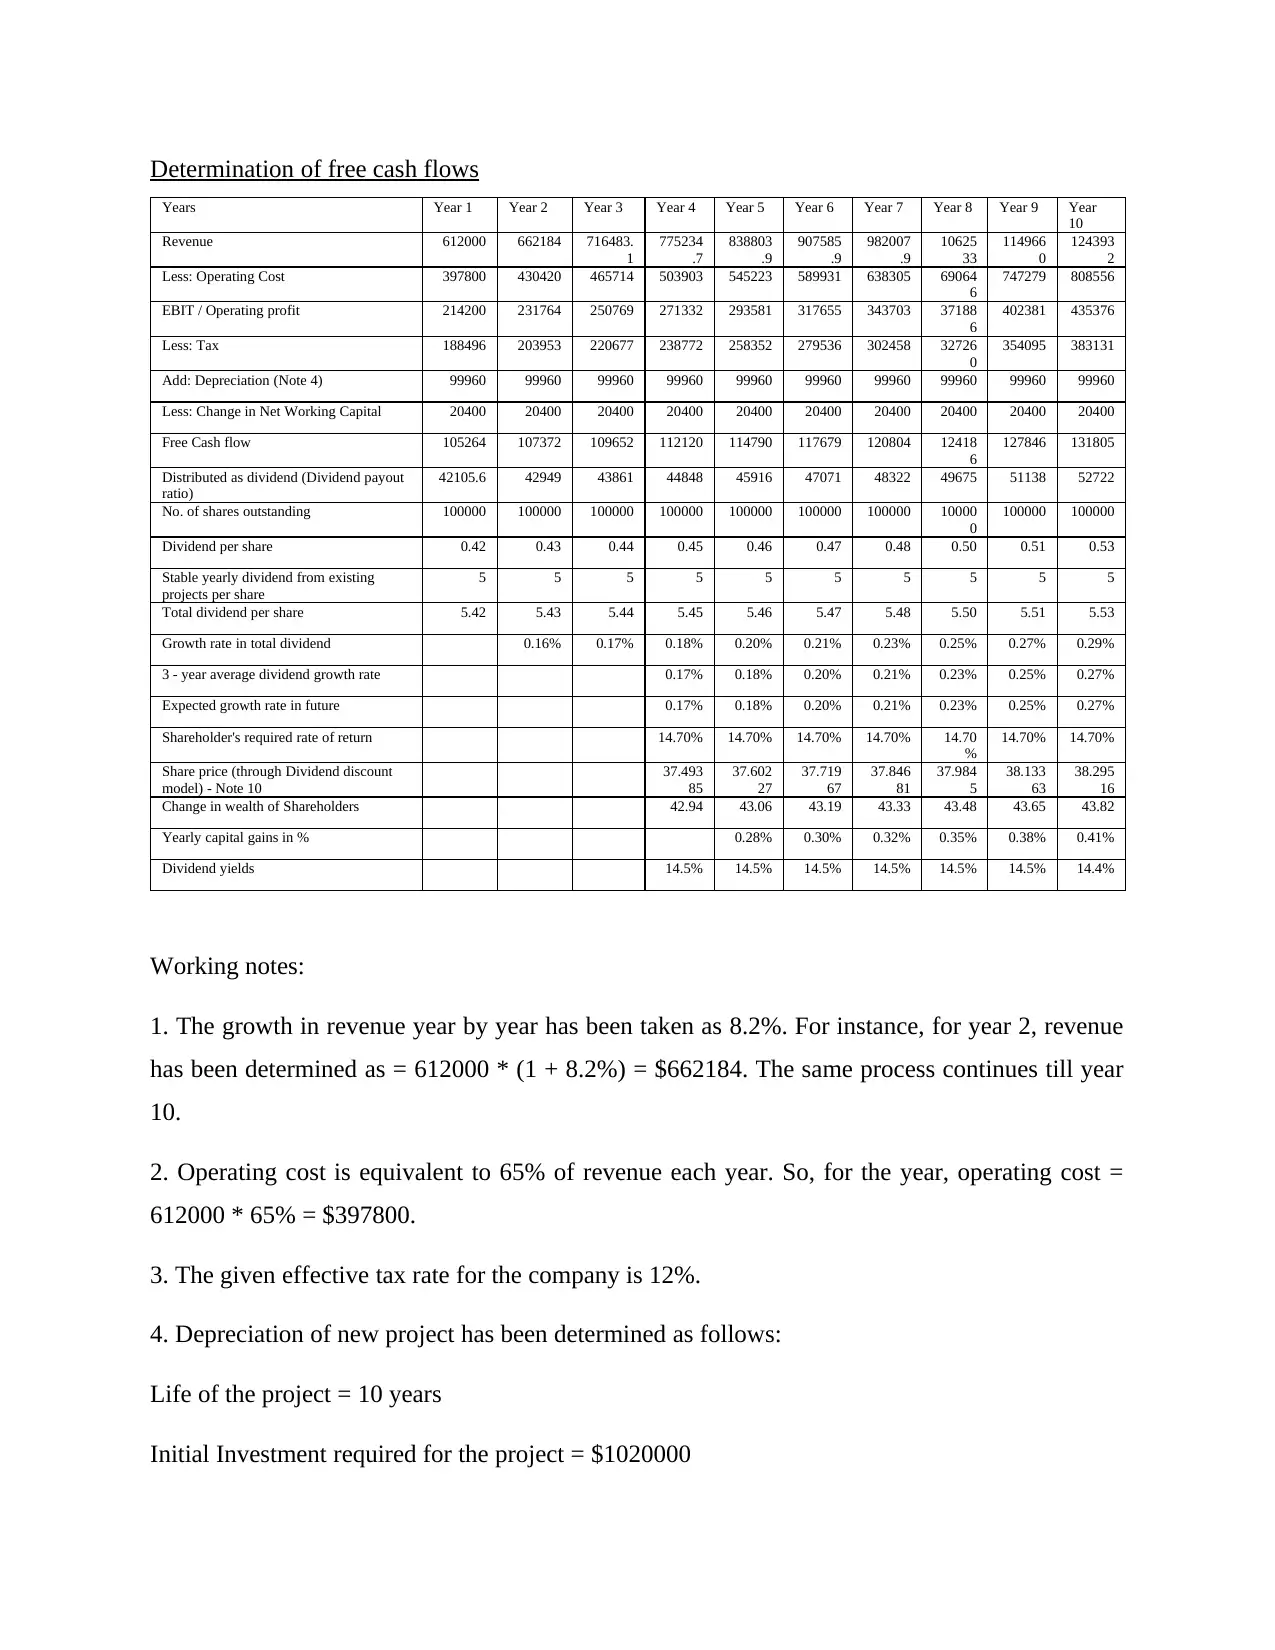
Determination of Free Cash Flows in Corporate Finance

Verified

Added on  2023/06/09

|6
|971
|484
AI Summary
This article explains the process of determining free cash flows in corporate finance and evaluating the feasibility of a proposed project. It covers the calculation of dividend per share, growth rate, and share price through the dividend discount model. The analysis shows consistent growth in total dividends paid to shareholders, resulting in higher share prices and an increase in shareholder wealth. The proposed project is feasible for the company to go ahead with. The article cites references from books and journals such as Corporate Finance: Theory and Practice by Vernimmen, Quiry, and Le Fur.
tabler-icon-diamond-filled.svg

Contribute Materials

Your contribution can guide someone’s learning journey. Share your documents today.
Document Page
CORPORATE FINANCE
tabler-icon-diamond-filled.svg

Secure Best Marks with AI Grader

Need help grading? Try our AI Grader for instant feedback on your assignments.
Document Page
Table of Contents
Determination of free cash flows.................................................................................................4
REFERENCES................................................................................................................................7
Books and Journals......................................................................................................................7
Document Page
Determination of free cash flows
Years Year 1 Year 2 Year 3 Year 4 Year 5 Year 6 Year 7 Year 8 Year 9 Year
10
Revenue 612000 662184 716483.
1
775234
.7
838803
.9
907585
.9
982007
.9
10625
33
114966
0
124393
2
Less: Operating Cost 397800 430420 465714 503903 545223 589931 638305 69064
6
747279 808556
EBIT / Operating profit 214200 231764 250769 271332 293581 317655 343703 37188
6
402381 435376
Less: Tax 188496 203953 220677 238772 258352 279536 302458 32726
0
354095 383131
Add: Depreciation (Note 4) 99960 99960 99960 99960 99960 99960 99960 99960 99960 99960
Less: Change in Net Working Capital 20400 20400 20400 20400 20400 20400 20400 20400 20400 20400
Free Cash flow 105264 107372 109652 112120 114790 117679 120804 12418
6
127846 131805
Distributed as dividend (Dividend payout
ratio)
42105.6 42949 43861 44848 45916 47071 48322 49675 51138 52722
No. of shares outstanding 100000 100000 100000 100000 100000 100000 100000 10000
0
100000 100000
Dividend per share 0.42 0.43 0.44 0.45 0.46 0.47 0.48 0.50 0.51 0.53
Stable yearly dividend from existing
projects per share
5 5 5 5 5 5 5 5 5 5
Total dividend per share 5.42 5.43 5.44 5.45 5.46 5.47 5.48 5.50 5.51 5.53
Growth rate in total dividend 0.16% 0.17% 0.18% 0.20% 0.21% 0.23% 0.25% 0.27% 0.29%
3 - year average dividend growth rate 0.17% 0.18% 0.20% 0.21% 0.23% 0.25% 0.27%
Expected growth rate in future 0.17% 0.18% 0.20% 0.21% 0.23% 0.25% 0.27%
Shareholder's required rate of return 14.70% 14.70% 14.70% 14.70% 14.70
%
14.70% 14.70%
Share price (through Dividend discount
model) - Note 10
37.493
85
37.602
27
37.719
67
37.846
81
37.984
5
38.133
63
38.295
16
Change in wealth of Shareholders 42.94 43.06 43.19 43.33 43.48 43.65 43.82
Yearly capital gains in % 0.28% 0.30% 0.32% 0.35% 0.38% 0.41%
Dividend yields 14.5% 14.5% 14.5% 14.5% 14.5% 14.5% 14.4%
Working notes:
1. The growth in revenue year by year has been taken as 8.2%. For instance, for year 2, revenue
has been determined as = 612000 * (1 + 8.2%) = $662184. The same process continues till year
10.
2. Operating cost is equivalent to 65% of revenue each year. So, for the year, operating cost =
612000 * 65% = $397800.
3. The given effective tax rate for the company is 12%.
4. Depreciation of new project has been determined as follows:
Life of the project = 10 years
Initial Investment required for the project = $1020000
Document Page
Residual value = 2% of original value = 20400
Depreciation to be charged each year on the basis of straight line method can be determined as
follows:
Depreciation = Initial investment – residual value / Life of the project
Depreciation = 1020000 – 20400 / 10 = 99960 per annum
5. Free cash flows have been determined through the following formula:
Free cash flow = EBIT – Tax + Depreciation – Net Working Capital (Eka, 2018)
6. Dividend distribution for each year = Free cash flow * Dividend payout ratio = 105264 * 40%
= $42105.6.
7. Dividend per share = Profit distributed as dividends / Number of shares outstanding = 42105.6
/ 100000 = $0.42.
8. Total dividend = Stable dividends from existing project + Dividend from new project
9. Growth rate in total dividend = Current year dividend – Previous year dividend / Previous year
dividend * 100.
10. Formula for share price (through Dividend Discount Model) = Dividend / (Required rate of
return – Growth rate).
11. Change in wealth of shareholders = Total dividends + Share price = 5.45 + 37.49 = $42.94.
12. Yearly capital gain = (Wealth of shareholder in current year – Wealth of shareholder in
previous year) / Wealth of shareholder in previous year * 100 = (43.06 – 42.94) / 42.94 * 100 =
0.28%.
13. Dividend yields = Dividend per share / Share price * 100 = 5.45 / 37.49 * 100 = 14.5%.
Interpretation:
From the above analysis, it has been identified that there is a consistent growth in total
dividends paid to shareholders which results in higher share price every next year. Accordingly,
there is an increase in the wealth of shareholders throughout the life of the project as seen
through increase in capital gains to shareholder year by year. However, the dividend yields were
tabler-icon-diamond-filled.svg

Secure Best Marks with AI Grader

Need help grading? Try our AI Grader for instant feedback on your assignments.
Document Page
found out to be consistent throughout the life of the project. Therefore, from the perspective of
shareholders where the underlying objective is always to maximize wealth, the proposed project
is feasible for the company to go ahead with (Vernimmen, Quiry and Le Fur, 2022).
Document Page
REFERENCES
Books and Journals
Vernimmen, P., Quiry, P. and Le Fur, Y., 2022. Corporate finance: theory and practice. John
Wiley & Sons.
Eka, H., 2018. Corporate finance and firm value in the Indonesian manufacturing
companies. Business Studies, 11(2), pp.113-127.
chevron_up_icon
1 out of 6
circle_padding
hide_on_mobile
zoom_out_icon
[object Object]

Your All-in-One AI-Powered Toolkit for Academic Success.

Available 24*7 on WhatsApp / Email

[object Object]