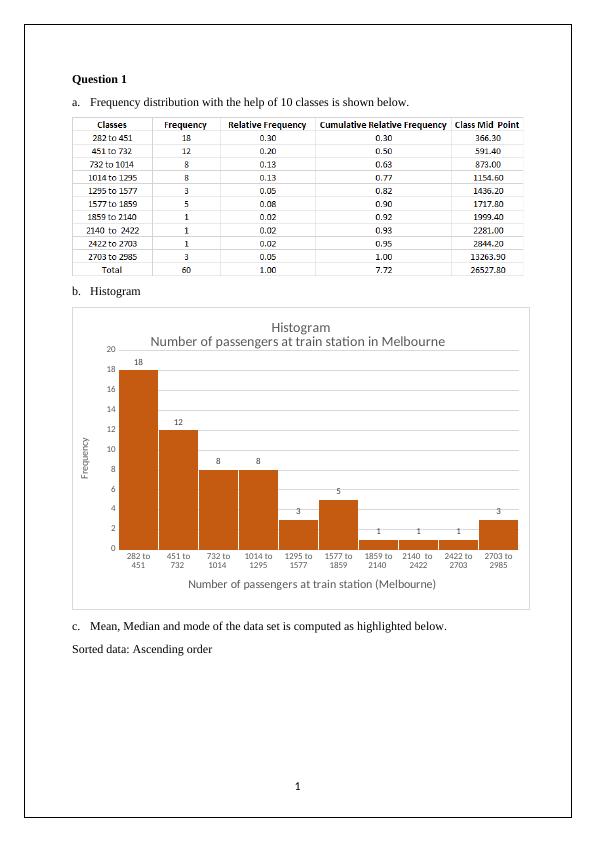
Frequency distribution of Melbourne 20 18 18 16 14 12 to 1577 1577 to 1859 1 1 1859 to 2140 2140 to 2422 2422 to 2703 Number of passengers at train station (Melbourne) 20 18 18 16 14 12
This is a group assignment worth 20% of the final grade. It requires the application of principles and techniques taught in the course. The assignment must be submitted in Word format and any required Excel output should be included. Plagiarism checking will be conducted.
11 Pages1565 Words67 Views
Added on 2023-04-23
Frequency distribution of Melbourne 20 18 18 16 14 12 to 1577 1577 to 1859 1 1 1859 to 2140 2140 to 2422 2422 to 2703 Number of passengers at train station (Melbourne) 20 18 18 16 14 12
This is a group assignment worth 20% of the final grade. It requires the application of principles and techniques taught in the course. The assignment must be submitted in Word format and any required Excel output should be included. Plagiarism checking will be conducted.
Added on 2023-04-23
ShareRelated Documents
End of preview
Want to access all the pages? Upload your documents or become a member.
Statistics: Frequency distribution, Regression equation, Probability
|12
|1656
|428
Applied Quantitative Methods Assignment 2
|19
|1391
|74