HI6007 Holmes Institute: Statistical Analysis of Frequency and Demand

Verified

Added on  2023/06/12

|2
|757
|346
Homework Assignment
AI Summary
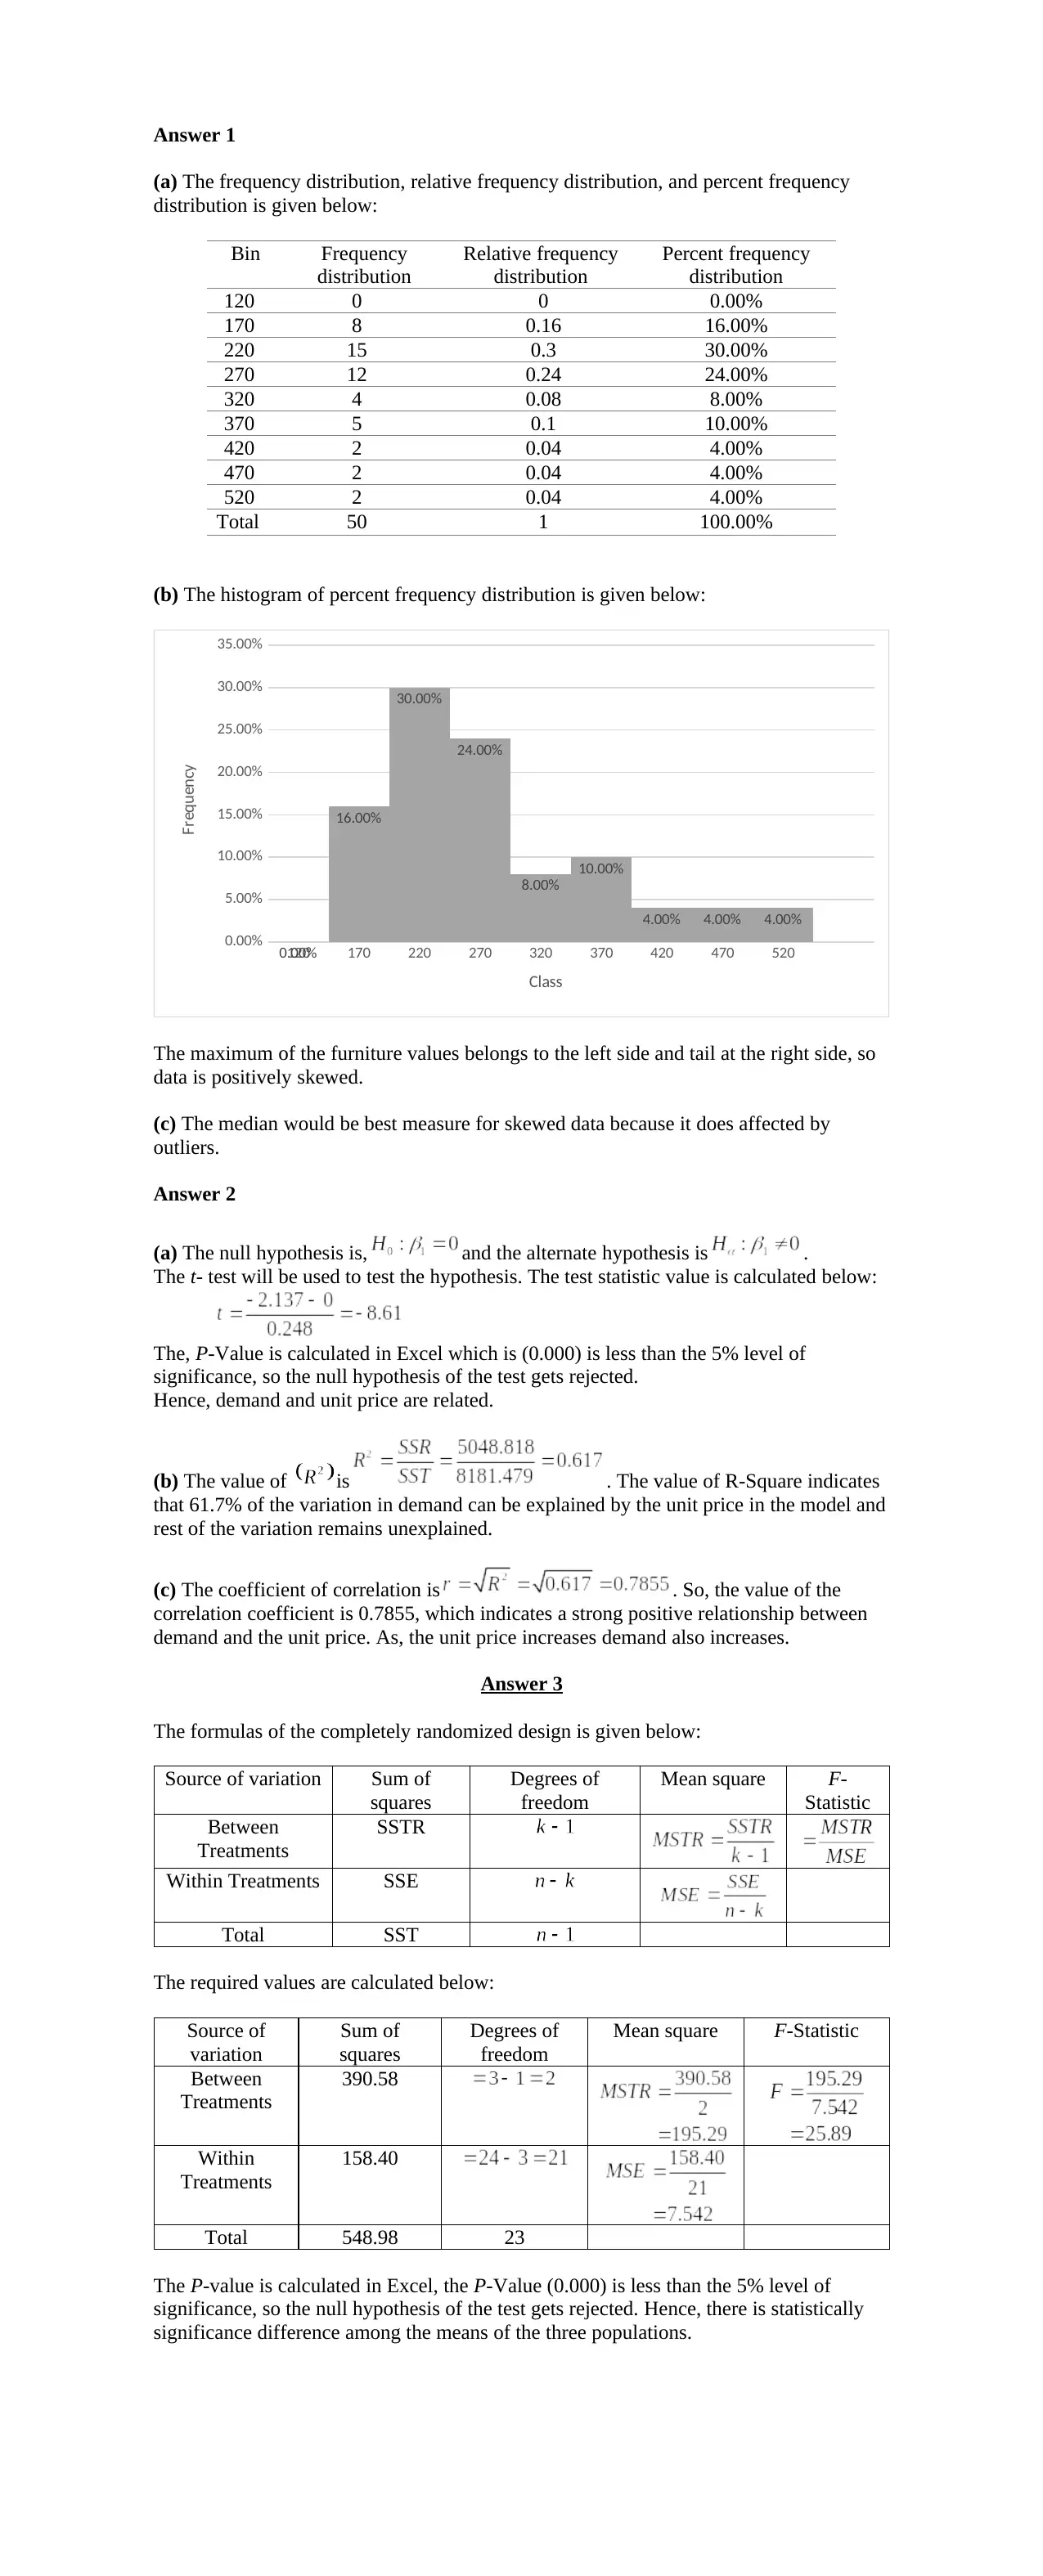
This assignment provides solutions to statistical problems, including frequency distribution analysis, regression analysis, and hypothesis testing. It begins with creating frequency, relative frequency, and percent frequency distributions for furniture order values, followed by a histogram analysis to determine data skewness. The assignment then performs a t-test to assess the relationship between demand and unit price, calculating the coefficient of determination (R-squared) and correlation coefficient. Furthermore, it conducts an ANOVA test for a completely randomized design to determine significant differences among population means. Finally, the assignment estimates a regression equation, performs F-tests and t-tests to assess the significance of independent variables, and predicts mobile phone sales based on advertising expenditure, demonstrating a comprehensive application of statistical techniques. Desklib offers a wealth of similar solved assignments and past papers for students seeking further assistance.
Document Page
Answer 1
(a) The frequency distribution, relative frequency distribution, and percent frequency
distribution is given below:
Bin Frequency
distribution
Relative frequency
distribution
Percent frequency
distribution
120 0 0 0.00%
170 8 0.16 16.00%
220 15 0.3 30.00%
270 12 0.24 24.00%
320 4 0.08 8.00%
370 5 0.1 10.00%
420 2 0.04 4.00%
470 2 0.04 4.00%
520 2 0.04 4.00%
Total 50 1 100.00%
(b) The histogram of percent frequency distribution is given below:
120 170 220 270 320 370 420 470 520
0.00%
5.00%
10.00%
15.00%
20.00%
25.00%
30.00%
35.00%
0.00%
16.00%
30.00%
24.00%
8.00%
10.00%
4.00% 4.00% 4.00%
Class
Frequency
The maximum of the furniture values belongs to the left side and tail at the right side, so
data is positively skewed.
(c) The median would be best measure for skewed data because it does affected by
outliers.
Answer 2
(a) The null hypothesis is, and the alternate hypothesis is .
The t- test will be used to test the hypothesis. The test statistic value is calculated below:
The, P-Value is calculated in Excel which is (0.000) is less than the 5% level of
significance, so the null hypothesis of the test gets rejected.
Hence, demand and unit price are related.
(b) The value of is . The value of R-Square indicates
that 61.7% of the variation in demand can be explained by the unit price in the model and
rest of the variation remains unexplained.
(c) The coefficient of correlation is . So, the value of the
correlation coefficient is 0.7855, which indicates a strong positive relationship between
demand and the unit price. As, the unit price increases demand also increases.
Answer 3
The formulas of the completely randomized design is given below:
Source of variation Sum of
squares
Degrees of
freedom
Mean square F-
Statistic
Between
Treatments
SSTR
Within Treatments SSE
Total SST
The required values are calculated below:
Source of
variation
Sum of
squares
Degrees of
freedom
Mean square F-Statistic
Between
Treatments
390.58
Within
Treatments
158.40
Total 548.98 23
The P-value is calculated in Excel, the P-Value (0.000) is less than the 5% level of
significance, so the null hypothesis of the test gets rejected. Hence, there is statistically
significance difference among the means of the three populations.
tabler-icon-diamond-filled.svg

Paraphrase This Document

Need a fresh take? Get an instant paraphrase of this document with our AI Paraphraser
Document Page
Answer 4
(a) The estimated regression equation relating Y to and is given below:
(b) The null hypothesis for the test is . And, the alternative hypothesis is
. The value of F-test statistic is,
The, P-Value calculated in excel, the P-Value is (0.000) is less than the 5% level of
significance, so the null hypothesis of the test gets rejected. Hence, there is a significant
relationship between all independent variables and dependent variables.
(c). The null hypothesis is, and the alternate hypothesis is .
The t- test will be used to test the hypothesis. The test statistic value is calculated below:
The, P-Value calculated in Excel which is (0.000). The P-value is greater than the 5%
level of significance, so the null hypothesis of the test does not get rejected. Hence, is
not different from 0.
The null hypothesis is, and the alternate hypothesis is .
The t- test will be used to test the hypothesis. The test statistic value is calculated below:
The, P-Value calculated in excel which is (0.000). The P-value is is greater than the 5%
level of significance, so the null hypothesis of the test does not get rejected. Hence, is
different from 0.
(d) The estimated slope for advertising sports is 0.4733, the slope indicates that as
the advertising sports increases by 1 the mobile phone sold per day will increases by
0.4733 percentages.
(e) The predicted value of mobile phones that will be sell is,
Hence, about 15 mobile phones that would be sell if company charges $20000 using 10
advertising sports.
chevron_up_icon
1 out of 2
circle_padding
hide_on_mobile
zoom_out_icon
[object Object]