logo

Frequency Distribution, Hypothesis Testing, Regression Analysis


Added on  2023-06-12

2 Pages757 Words346 Views
Answer 1
(a) The frequency distribution, relative frequency distribution, and percent frequency
distribution is given below:
Bin Frequency
distribution
Relative frequency
distribution
Percent frequency
distribution
120 0 0 0.00%
170 8 0.16 16.00%
220 15 0.3 30.00%
270 12 0.24 24.00%
320 4 0.08 8.00%
370 5 0.1 10.00%
420 2 0.04 4.00%
470 2 0.04 4.00%
520 2 0.04 4.00%
Total 50 1 100.00%
(b) The histogram of percent frequency distribution is given below:
120 170 220 270 320 370 420 470 520
0.00%
5.00%
10.00%
15.00%
20.00%
25.00%
30.00%
35.00%
0.00%
16.00%
30.00%
24.00%
8.00%
10.00%
4.00% 4.00% 4.00%
Class
Frequency
The maximum of the furniture values belongs to the left side and tail at the right side, so
data is positively skewed.
(c) The median would be best measure for skewed data because it does affected by
outliers.
Answer 2
(a) The null hypothesis is, and the alternate hypothesis is .
The t- test will be used to test the hypothesis. The test statistic value is calculated below:
The, P-Value is calculated in Excel which is (0.000) is less than the 5% level of
significance, so the null hypothesis of the test gets rejected.
Hence, demand and unit price are related.
(b) The value of is . The value of R-Square indicates
that 61.7% of the variation in demand can be explained by the unit price in the model and
rest of the variation remains unexplained.
(c) The coefficient of correlation is . So, the value of the
correlation coefficient is 0.7855, which indicates a strong positive relationship between
demand and the unit price. As, the unit price increases demand also increases.
Answer 3
The formulas of the completely randomized design is given below:
Source of variation Sum of
squares
Degrees of
freedom
Mean square F-
Statistic
Between
Treatments
SSTR
Within Treatments SSE
Total SST
The required values are calculated below:
Source of
variation
Sum of
squares
Degrees of
freedom
Mean square F-Statistic
Between
Treatments
390.58
Within
Treatments
158.40
Total 548.98 23
The P-value is calculated in Excel, the P-Value (0.000) is less than the 5% level of
significance, so the null hypothesis of the test gets rejected. Hence, there is statistically
significance difference among the means of the three populations.
Frequency Distribution, Hypothesis Testing, Regression Analysis_1

End of preview

Want to access all the pages? Upload your documents or become a member.

Related Documents
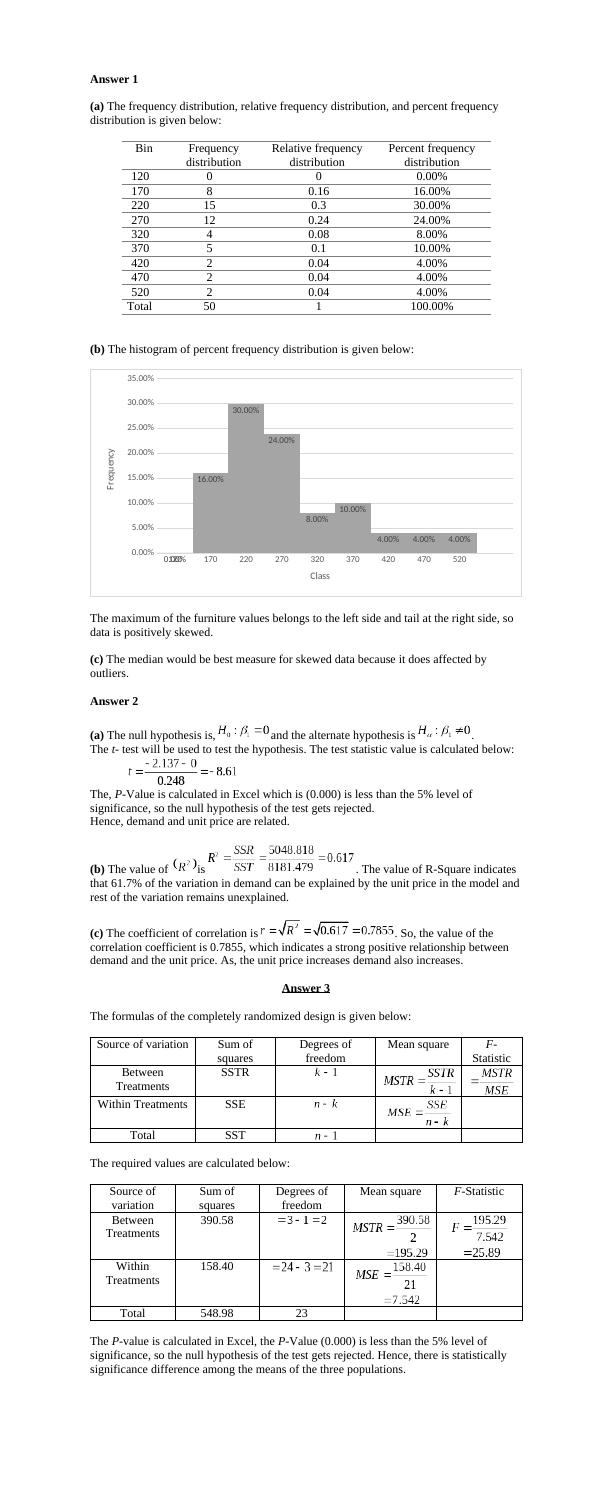
Analysis of Sample Furniture Orders, Regression and ANOVA Tables
|8
|1203
|296

Deslib - Statistics Assignment Solution
|15
|2468
|269

Analytical Methods
|9
|560
|21

Data Analysis: Frequency Table, Histogram, Regression Analysis, Hypothesis Testing
|4
|527
|497

SPSS Assessment: Program Evaluation, Gender and Activity Association, Mood and Stress Relationship, Impact of Mood, Motivation, and Stress on Cognitive Performance
|13
|1880
|50

Business Data Modelling - Desklib
|13
|1381
|278